JSCS–4840 Original scientific paper
Interval partial least squares and moving window partial least
squares in determining the enantiomeric composition of
tryptophan using UV–Vis spectroscopy
LONG JIAO1,2*, SHAN BING1, XIAOFENG ZHANG1 and HUA LI21College of Chemistry and Chemical Engineering, Xi’an Shiyou University, Xi’an 710065, China and 2College of Chemistry and Materials Science, Northwest University,
Xi’an 710069, China
(Received 27 February, revised 2 August, accepted 3 August 2015) Abstract: The application of interval partial least squares (IPLS) and moving window partial least squares (MWPLS) for the enantiomeric analysis of tryp-tophan (Trp) was investigated. A UV–Vis spectroscopic method for deter-mining the enantiomeric composition of Trp was developed. The calibration model was built using partial least squares (PLS), IPLS and MWPLS, respect-ively. Leave-one-out cross validation and external test validation were used to assess the prediction performance of the established models. The validation result demonstrated the established full-spectrum PLS model is impractical for quantifying the relationship between the spectral data and enantiomeric com-position of L-Trp. On the contrary, the developed IPLS and MWPLS models are both practicable for modeling this relationship. For the IPLS model, the root mean square relative error (RMSRE) values of the external test validation and leave-one-out cross validation were 4.03 and 6.50, respectively. For the MWPLS model, the RMSRE values of the external test validation and leave- -one-out cross validation were 2.93 and 4.73, respectively. Obviously, the pre-diction accuracy of the MWPLS model was higher than that of the IPLS model. It was demonstrated that UV–Vis spectroscopy combined withMWPLS is a commendable method for determining the enantiomeric composition of Trp. MWPLS was superior to IPLS for selecting the spectral region in the UV–Vis spectroscopy analysis.
Keywords: UV–Vis spectroscopy; interval partial least squares; moving win-dow partial least squares; enantiomeric composition; tryptophan.
INTRODUCTION
Enantiomeric pure products are required in various fields because enantio-mers may show great differences in their chemical and biological reactions.1,2 At
present, determining the enantiomeric composition of chiral compounds has gained much attention.
Spectroscopic methods, including UV–Vis,3–9 NIR10,11 and fluorescence12–14
have been successfully used to determine the enantiomeric composition of chiral compounds. It was shown that a quantitative relationship between the enantio-meric composition and the spectra of chiral compounds exist.3–14 Multivariable
calibration methods are required to reveal this relationship. The partial least squares (PLS) method was usually used to develop the calibration model. The models reported in these studies were all full-spectrum PLS models, which were developed using the whole spectrum as the independent variable. However, a spectrum often contains spectral regions related to non-modeled information ori-ginating from unwanted constituents, background variations, random interfer-ences and interactions. These spectral regions may degrade the calibration model and should not be used in model building.15–17 Thus, selection of the spectral
region is often required in multi-component spectroscopic analysis in order to eli-minate the influence of non-modeled spectral regions and build well-fitted calib-ration models.17–21
Many studies have shown that spectral region selection can lead to signific-ant improvement of the prediction performance over full-spectrum calibration models.15–24 It seems spectral region selection could improve the accuracy of the
calibration model when spectroscopic methods are used to determine the enantio-meric composition of chiral compounds. However, spectral region selection has not hitherto been applied to the spectroscopic determination of enantiomeric composition. Interval partial least squares (IPLS) and moving window partial least squares (MWPLS) are two local modeling methods which have been com-monly used to select spectral regions in spectroscopy analysis.16–18,22–35
Tryptophan (Trp) is an essential amino acid for humans. The biological function of L-Trp is quite different from D-Trp. Thus, a method for the enan-tiomeric determination of Trp is desirable. Therefore, in the present study, IPLS and MWPLS were applied to the determination of the enantiomeric composition of Trp. UV-Vis spectroscopy was used to measure the spectra of Trp enantio-mers. An IPLS model and a MWPLS model were developed and investigated.
EXPERIMENTAL Reagents
Spectra
The UV–Vis spectra of the prepared samples were collected with an Agilent 8453 UV– –visible spectrophotometer (Agilent, U.S.A.) over the wavelength range from 190 nm to 789 nm. Quartz cells of 1.0 cm path length were used. All the spectra were blank corrected. Data and software
The root mean square relative error (RMSRE) was employed to assess the prediction performance of the obtained models. It is defined as:
2 1
1 n ( ) i i
RMSRE RE
n
=
=
(1)where REi denotes the relative error of prediction for the ith sample and n is the number of samples.
PLS toolbox 5.5 (Eigenvector Research Inc., U.S.A.) was used to perform PLS. IPLS and MWPLS were conducted using iToolbox (programmed by Prof. Nørgaard, KVL, Den-mark; shared at http://www.models.kvl.dk/iToolbox). The independent variable matrix (X matrix) of PLS, IPLS and MWPLS was generated by assembling the spectral data of each sample as a row vector. The dependent variable (Y matrix) of each model is composed by the mol fraction of L-Trp. The X and Y matrix were mean-centered in the procedure of PLS, IPLS and MWPLS.
RESULTS AND DISCUSSION
Spectra of the samples
Twenty samples were prepared. Each sample contained 0.01 mmol L–1 Trp
and 0.02 mmol L–1 BSA. The enantiomeric composition of the 20 samples was
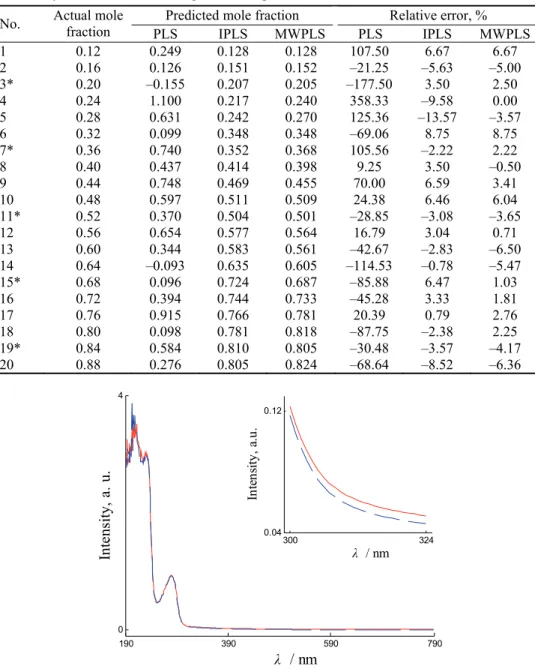
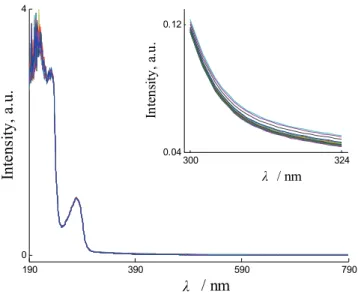
varied from mol fraction 0.12 to 0.88 of L-Trp. The mol fractions of L-Trp in these samples are listed in Table I. In the prepared samples, BSA formed two different guest–host complexes with the enantiomers of Trp. The complex formed from L-Trp is diastereomeric to the complex formed from D-Trp. Hence, the two complexes were different in their UV–Vis spectra, as shown in Fig. 1. Correspondingly, the twenty prepared samples should differ in their UV–Vis spectra because they differ in their enantiomeric composition. The UV–Vis spectra of the twenty samples are shown in Fig. 2, from which the slight differ-ences could be seen. These spectral differdiffer-ences are actually related to the enan-tiomeric composition of Trp. However, the differences are so small that a quan-titative relationship between the spectra and the enantiomeric composition of Trp could not be modeled using the classical least squares method. Thus, PLS, IPLS and MWPLS were used to build calibration models between the spectral data and the enantiomeric composition of Trp.
Full-spectrum PLS model
TABLE I. Result of external test validation and leave-one-out cross validation; the samples marked by an asterisk are the samples in Group II (see text)
No. Actual mole fraction PLS Predicted mole fraction IPLS MWPLS PLS Relative error, % IPLS MWPLS
1 0.12 0.249 0.128 0.128 107.50 6.67 6.67
2 0.16 0.126 0.151 0.152 –21.25 –5.63 –5.00
3* 0.20 –0.155 0.207 0.205 –177.50 3.50 2.50
4 0.24 1.100 0.217 0.240 358.33 –9.58 0.00
5 0.28 0.631 0.242 0.270 125.36 –13.57 –3.57
6 0.32 0.099 0.348 0.348 –69.06 8.75 8.75
7* 0.36 0.740 0.352 0.368 105.56 –2.22 2.22
8 0.40 0.437 0.414 0.398 9.25 3.50 –0.50
9 0.44 0.748 0.469 0.455 70.00 6.59 3.41
10 0.48 0.597 0.511 0.509 24.38 6.46 6.04
11* 0.52 0.370 0.504 0.501 –28.85 –3.08 –3.65
12 0.56 0.654 0.577 0.564 16.79 3.04 0.71
13 0.60 0.344 0.583 0.561 –42.67 –2.83 –6.50 14 0.64 –0.093 0.635 0.605 –114.53 –0.78 –5.47 15* 0.68 0.096 0.724 0.687 –85.88 6.47 1.03
16 0.72 0.394 0.744 0.733 –45.28 3.33 1.81
17 0.76 0.915 0.766 0.781 20.39 0.79 2.76
18 0.80 0.098 0.781 0.818 –87.75 –2.38 2.25 19* 0.84 0.584 0.810 0.805 –30.48 –3.57 –4.17 20 0.88 0.276 0.805 0.824 –68.64 –8.52 –6.36
190 390 590 790
0 4
λ
In
te
ns
ity
, a
. u
.
/ nm
300 324
0.04 0.12
λ
In
te
ns
ity
, a
.u
.
/ nm
Fig. 1. UV–Vis spectra of two solutions containing 0.01 mmol L-1 Trp and 0.02 mmol L-1
BSA; solid line: D-Trp+BSA; dashed line: L-Trp+BSA. Inset: spectra from 300 to 324 nm.
the prediction performance of this model. The prepared 20 samples were split into two groups: Group I and Group II. Group I comprised 15 samples. Group II comprised 5 samples (marked by an asterisk in Table I).
190 390 590 790
0 4
λ
In
te
ns
ity
, a
.u
.
/ nm
300 324
0.04 0.12
λ
In
te
ns
ity
, a
.u
.
/ nm
Fig. 2. UV–Vis spectra of the twenty prepared samples. Inset: spectra from 300 to 324 nm.
First, the external test validation was performed. The PLS model was gener-ated by using Group I as the calibration set. The obtained model contained four latent variables. Group II was used as the external test set. The mole fraction of L-Trp of the 5 samples in Group II was predicted using the obtained PLS model. The prediction result is listed in Table I. For the 5 samples, the prediction
RMSRE was 101.77. Subsequently, the leave-one-out cross validation was
per-formed. The mole fraction of L-Trp in Group I was predicted in turn. The used PLS model still included four latent variables. The prediction result is listed in Table I. For the 15 samples, the RMSRE of prediction reached 114.48. It could be
IPLS model
IPLS was used to perform spectral region selection and develop a calibration model. The prediction accuracy of the established IPLS model was evaluated by external test validation and leave-one-out cross validation.
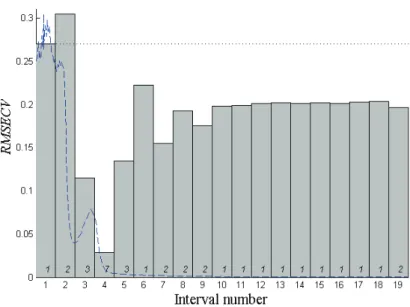
In the external test validation, Group I was used as the calibration set to build the IPLS model. The full spectrum was split into 19 intervals. The wave-length range of these intervals were 190−221, 222−253, 254−285, 286−317, 318−349, 350−381, 382−413, 414−445, 446−477, 478−509, 510−541, 542−572, 573−603, 604−634, 635−665, 666−696, 697−727, 728−758 and 759−789 nm. The results of IPLS are shown in Fig. 3. According to Fig. 3, the optimal calib-ration model was obtained at the fourth interval (the wavelength range 286−317 nm) coupled with seven latent variables. This local model is the IPLS model was required. Then, it was used to predict the mol fraction of L-Trp of Group II. The results are presented in Table I. The RMSRE of the prediction was 4.03 for the
five samples.
In the leave-one-out cross validation, the used IPLS model was again developed using the spectral data for 286−317 nm and it included seven latent variables. The prediction results are presented in Table I. The RMSRE of this
prediction was 6.50 for the 15 samples. As shown in Table I, the predicted mole fractions were almost in agreement with the actual values, which showed that IPLS was practicable for modeling the quantitative relationship between the
Fig. 3. Root mean square error of cross validation (RMSECV) plot obtained from IPLS. Vertical bar is the RMSECV for each local model. The figure in each bar is the optimal number of latent variables for each local model. The dashed line gives the mean spectrum of
spectral data and the mol fraction of L-Trp. Obviously, selection of the spectral region is a crucial step to build a feasible calibration model. IPLS was superior to PLS for building the calibration model, because it involves the procedure for the selection of the spectral region.
Although the obtained IPLS model was acceptable, it was still worthwhile to search for a better calibration model because the prediction error of samples 5 was somewhat large. IPLS can only divide the spectrum into a series of equidis-tant intervals at certain positions. The spectral intervals built by IPLS may still contain non-modeled information and so was not the best region for building the model. If a more informative spectral region could be found to build the model, a better calibration model should be obtained.
MWPLS model
MWPLS finds the optimal spectral region by moving the window through the total spectral range. It can inspect more potential spectral regions than IPLS. Thus, a MWPLS model was developed in order to improve the obtained calib-ration model.
The prediction performance of the obtained MWPLS model was still assessed by external test validation and leave-one-out cross validation. In the external test validation, Group I was used as the calibration set to build the model. The window size was set to 31 nm. The results of MWPLS are illustrated in Fig. 4. In terms of the RMSECV, the optimal calibration model was the local
model built at the position 306 nm, i.e., the established MWPLS model was
actually the local PLS model developed from the spectral region 291−321 nm. This model includes five latent variables. The mol fraction of L-Trp of Group II was then predicted using this model. The results are listed in Table I. The
RMSRE of the prediction was 2.93 for the five samples. In the leave-one-out
cross validation, the used MWPLS model was also developed from the spectral region of 291−321 nm and it included five latent variables. The prediction results are presented in Table I. For the 15 samples, the RMSRE of the prediction was
4.73. As shown in Table I, the predicted mol fractions were in good agreement with the actual values.
spectral region significantly influences the calibration results of PLS in the analysis of UV–Vis spectroscopic results. Inspecting more regions of the spectra is helpful in obtaining better calibration results.
Fig. 4. RMSECV plots obtained from MWPLS. The solid line gives the RMSECV for all the local models. The dotted line represents the RMSECV for the full-spectrum PLS model. The
dashed shows the mean spectrum of the 20 samples. CONCLUSIONS
A UV–Vis spectroscopic method for the determination of the enantiomeric composition of Trp was developed. The result of external test validation and leave-one-out cross validation demonstrated that both IPLS and MWPLS are practicable for modeling the quantitative relationship between the spectral data and the mol fraction of L-Trp. On the contrary, full-spectrum PLS is unable to model this relationship. It was shown that the selection of the spectral region is an indispensable step to determine the enatiomeric composition of Trp by UV– –Vis spectroscopy.
spectro-scopic analysis. MWPLS is superior to IPLS for selecting the spectral region in UV–Vis spectroscopy analysis.
The combination of UV–Vis spectroscopy and MWPLS is an easy-to-use and commendable method for determining the enantiomeric composition of Trp at low concentration levels. The enantiomeric composition of Trp can be accur-ately determined provided there is 0.01 mmol L–1 Trp in the sample. Although
this method was only applied to Trp in the present study, it should be a promising method for other chiral compounds.
Acknowledgements. The work was supported by the National Natural Science Found-ation of China (Nos. 21305108 and 21375105), the Natural Science Basic Research Plan in Shaanxi Province of China (Program No. 2014JM2039) and the Innovative Research Team of Xi’an Shiyou University (No. 2013QNKYCXTD01). We greatly appreciate Dr. Yunxia Wang (Northwest University, China) for her cooperation and Prof. L. Nørgaard (KVL, Denmark) for sharing the iToolbox program at the website of KVL.
И З В О Д
МЕТОДЕПАРЦИЈАЛНИХНАЈМАЊИХКВАДРАТАУЗФИКСНУИМОБИЛНУ СЕЛЕКЦИЈУИНТЕРВАЛАУОДРЕЂИВАЊУЕНАНТИОМЕРНОГСАСТАВА
ТРИПТОФАНАПРИМЕНОМ UV–VIS СПЕКТРОСКОПИЈЕ
LONG JIAO1,2,, SHAN BING1, XIAOFENG ZHANG1и HUA LI2
1College of Chemistry and Chemical Engineering, Xi’an Shiyou University, Xi’an 710065, China и2College of
chemistry and materials science, Northwest University, Xi’an 710069, China
Испитиванајеприменаметодепарцијалнихнајмањихквадрата (PLS) узфикснуи мобилну селекцију спектралних интервала (IPLS и MWPLS, редом) у анализи енан -тиомератриптофана (Trp). Развијенаје UV–Vis спектроскопска метода заодређивање енентиомерног састава Trp. Добијенису калибрационимоделиприменом PLS, IPLS и
MWPLS приступа. Методомунакрсневалидацијепојединачнихизостављања (leave-one-
-out) ивалидацијомна екстерном сету објекатапроцењена је поузданост предвиђања
добијенихмодела. Резултативалидацијепоказујунепрактичностпримене PLS приступа у моделовању целог спектралног опсега, у циљу одређивања енантиомерног састава
L-Trp на основу спектралних података. Насупрот томе, оба новоразвијена приступа,
IPLS и MWPLS, супогодназамоделовање. У IPLS моделу, релативнагрешкаизражена каокоренсредњевредностиквадратаодступањаизмерених одпредвиђених вредности (RMSRE) услучајуекстерне калибрацијеиунакрсневалидацијепојединачнихизостав -љањаизносе 4,03 и 6,50, редом. За MWPLS модел, RMSREтестаекстернекалибрацијеи унакрсневалидацијеизносе 2,93 и 4,73, редом. Очигледноједаје предвиђенатачност
MWPLS моделавиша негокод IPLS модела. Показаноједа је UV–Vis спектроскопија
комбинована са MWPLS погодна за одређивање енантиомерног састава Trp. MWPLS моделјесупериорнијиуодносуна IPLS заселекцијуспектралнеобластии UV–Vis спек -троскопскуанализу.
(Примљено 27. фебруара, ревидирано 2. августа, прихваћено 3. августа 2015)
2. L. Wang, Y. F. Chai, Z. Q. Ni, L. Wang, R. L. Hu, Y. J. Pan, C. R. Sun, Anal. Chim. Acta
809 (2014) 104
3. M. Blanco, J. Coello, H. Iturriaga, S. Maspoch, M. Porcel, Anal. Chim. Acta431 (2001) 115 4. K. W. Busch, I. M. Swamidoss, S. O. Fakayode, M. A. Busch, J. Am. Chem. Soc.125
(2003) 1690
5. K. W. Busch, I. M. Swamidoss, S. O. Fakayode, M. A. Busch, Anal. Chim. Acta525 (2004) 53
6. S. O. Fakayode, M. A. Busch, K. W. Busch, Talanta68 ( 2006) 1574 7. C. D. Tran, V. I. Grishko, D. Oliveira, Anal. Chem. 75 (2003) 6455 8. C. D. Tran, D. Oliveira, S. F. Yu, Anal. Chem. 78 (2006) 1349
9. S. O. Fakayode, P. N. Brady, D. A. Pollard, A. K. Mohammed, I. M. Warner, Anal. Bioanal. Chem.394 (2009) 1645
10. S. O. Fakayode, I. M. Swamidoss, M. A. Busch, K. W. Busch, Talanta65 (2005) 838 11. S. O. Fakayode, M. A. Busch, D. J. Bellert, K. W. Busch, Analyst130 (2005) 233 12. Y. X. Wang, F. Zhang, J. Liang, H. Li, J. L. Kong, Spectrochim. Acta, A68 (2007) 279 13. C. D. Tran, D. Oliveira, Anal. Biochem. 356 (2006) 51
14. P. Valderrama, R. J. Poppi, Anal. Chim. Acta623 (2008) 38
15. B. Hemmateenejad, M. Akhond, F. Samari, Spectrochim. Acta, A67 (2007) 958
16. L. Norgaard, A. Saudland, J. Wagner, J. P. Nielsen, L. Munck, S. B. Engelsen, Appl. Spectr.54 (2000) 413
17. X. B. Zou, J. W. Zhao, M. J. W. Povey, M. Holmes, H. P. Mao, Anal. Chim. Acta667 (2010) 14
18. J. H. Jiang, R. J. Berry, H. W. Siesler, Y. Ozaki, Anal. Chem.74 (2002) 3555
19. C. H. Spiegelman, M. J. McShane, M. J. Goetz, M. Motamedi, Q. L. Yue, G. L. Cote, Anal. Chem.70 (1998) 35
20. H. C. Goicoechea, A. C. Olivieri, J. Chem. Inf. Comput. Sci.42 (2002) 1146 21. R. Leardi, L. Norgaard, J. Chemometr.18 (2004) 486
22. A. Villar, S. Fernández, E. Gorritxategi, J. I. Ciria, L. A. Fernández, Chemometr. Intell. Lab. Syst. 130 (2014) 68
23. A. Borin, R. J. Poppi, Vib. Spectrosc.37 (2005) 27
24. R. M. Balabin, S. V. Smirnov, Anal. Chim. Acta692 (2011) 63
25. Y. J. Zhou, B. R. Xiang, Z. W. Wang, C. Y. Chen, Anal. Lett.42 (2009) 1518 26. Y. Z. Lu, C. W. Du, C. B. Yu, J. M. Zhou, J. Sci. Food Agric.94 (2014) 2239 27. A. Bogomolov, A. Melenteva, Chemometr. Intell. Lab. Syst. 126 (2013) 129
28. N. Shetty, R. Gislum, A. Mette D. Jensen, B. Boelt, Chemometr. Intell. Lab. Syst.111 (2012) 34
29. E. Martínez-Sabater, M. A. Bustamante, F. C. Marhuenda-Egea, M. El-Khattabi, R. Moral, E. Lorenzo, C. Paredes, L. N. Gálvez, J. D. Jordá, J. Agric. Food Chem.57 (2009) 9613
30. X. B. Zou, J. W. Zhao, Y. X. Li, Vib. Spectrosc.44 (2007) 220
31. H. Z. Chen, T. Pan, J. M. Chen, Q. P. Lu, Chemometr. Intell. Lab. Syst.107 (2011) 139 32. M. J. Zhang, S. Z. Zhang, J. Iqbal, Chemometr. Intell. Lab. Syst.128 (2013) 17 33. T. Pan, Z. H. Chen, J. M. Chen, Z. Y. Liu, Anal. Methods4 (2012) 1046
34. Y. H. Ma, Q. Wang, L. Y. Li, J. Quant. Spectrosc. Radiat. Transfer117 (2013) 7 35. Q. Wang, Y. H. Ma, Chemometr. Intell. Lab. Syst.127 (2013) 43
36. L. Jiao, Z. W. Xue, G. F. Wang, X. F. Wang, H. Li, Chemometr. Intell. Lab. Syst.137 (2014) 91