Article
J. Braz. Chem. Soc., Vol. 24, No. 7, 1198-1205, 2013. Printed in Brazil - ©2013 Sociedade Brasileira de Química 0103 - 5053 $6.00+0.00
A
*e-mail: [email protected]
Simultaneous Determination of Rifampicin and Isoniazid in Urine and
Pharmaceutical Formulations by Multivariate Visible Spectrophotometry
Sandra Stets,a Talita M. Tavares,a Patricio G. Peralta-Zamora,a
Christiana A. Pessoab and Noemi Nagata*,a
aDepartamento de Química, Universidade Federal do Paraná, 81531-990 Curitiba-PR, Brazil
bDepartamento de Química, Universidade Estadual de Ponta Grossa, 84030-900 Ponta Grossa-PR, Brazil
O método de regressão por mínimos quadrados parciais (PLSR) foi utilizado para a quantificação simultânea de dois tuberculostáticos rifampicina (RIF) e isoniazida (INH) por espectrofotometria na região do visível utilizando uma reação de derivatização simples. Na presença de neocuproína, íons cobre(II) foram facilmente reduzidos por INH para um complexo Cu(I)-neocuproína de absorção máxima a 455 nm. Sob essas mesmas condições, RIF mostrou uma absorção máxima a 449 nm. O conjunto de calibração foi estabelecido entre 8 e 57 mg L-1 de RIF e 1,5 e 7 mg L-1 de
INH. O método foi aplicado para a determinação das drogas em amostras de urina (recuperações entre 92 e 119%) e em formulações farmacêuticas (erro relativo inferior a 5%).
Partial least squares regression (PLSR) was used for the simultaneous quantification of rifampicin (RIF) and isoniazid (INH) by visible spectrophotometry using a simple derivatization reaction. In the presence of neocuproine, copper(II) is easily reduced by INH to a Cu(I)-neocuproine complex that shows an absorption maximum at 455 nm. Under these conditions, RIF shows an absorption maximum at 449 nm. The calibration set was established between 8 and 57 mg L-1 for
RIF and 1.5 and 7 mg L-1 for INH. The method was applied to the determination of the drugs in
urine samples (recoveries between 92 and 119%) and in pharmaceutical formulations (relative error lower than 5%).
Keywords: antibiotics, PLSR, urine, derivatization reaction
Introduction
The World Health Organization (WHO) classifies tuberculosis (TB) as a neglected disease that affects thousands of people but does not present an attractive opportunity for economic investment and development of pharmaceuticals, particularly for reaching people in
developing countries.1 According to the WHO, Brazil, the
Russian Federation, India, China and South Africa report
48% of the world TB cases.2
One of the most effective antituberculosis treatments used in many countries is based on a fixed dose combination (FDC) of two or more tuberculostatic agents in a single pharmaceutical formulation. In general, the use of FDC increases the treatment continuity and reduces the risk of resistance or relapses, treatment costs and errors in drug
administration and distribution.3,4 The combination of drugs
has therapeutic advantages; however, the combination of drugs brings new challenges to the pharmaceutical industry with respect to stability studies of combined drugs and their
simultaneous analysis.5
The analysis of antituberculosis drugs (e.g., rifampicin, isoniazid, pyrazinamid and daptomycin) has been performed for pharmaceutical formulations and/or biological fluids. The analytical methods include chromatographic techniques such as high-performance thin-layer chromatography
(HPTLC),6 high-performance liquid chromatography
(HPLC),7-12 ultra-performance liquid chromatography
(UPLC),13 micellar electrokinetic capillary chromatography
(MEKC),14 and, less frequently, spectrophotometric analysis
combined with multivariate regression,15-17 derivative
spectrophotometry18 and voltammetric methods.19-21
Because isoniazid does not show an absorption band in the visible region, the procedure is based on a simple chemical derivatization involving copper(II), isoniazid and neocuproine (NC). In the presence of neocuproine, copper(II) is reduced by isoniazid to a Cu(I)-neocuproine
complex, which shows an absorption maximum at 455 nm.22
The proposed procedure allows the determination of both analytes in the visible region using partial least squares regression (PLSR), multivariate calibration tool that allows the simultaneous determination of chemical species, even in the presence of strong spectral overlap.
Experimental
Instruments
The visible absorption spectra were recorded on a Shimadzu UV-2401PC spectrophotometer (Kyoto, Japan) using a glass cuvette with a path length of 1 cm.
Analysis by high-performance liquid chromatography was performed according to United States Pharmacopeia
(USP) recommendations23 using a Varian 920-LC
chromatograph (Mulgrave, Australia) equipped with an autosampler, a quaternary gradient pump and a diode
arraydetector (DAD, 238 nm). Routine chromatographic
separations were performed by gradient elution on a C18
column (Microsorb, 25 mm × 4.6 mm × 5 µm), using
injection volume of 20 µL.
The mobile phase consisted of acetonitrile (A) and sodium acetate buffer solution at pH 6.8 (B), using a gradient elution of 96-55% A in 0-6 min and 55% B in 10-15 min. Finally, the gradient was reverted to original conditions within next 5 min.
Chemicals and standard solutions
Rifampicin and isoniazid were kindly supplied by the Farmanguinhos Laboratory (Fiocruz of Brazil, Rio de Janeiro, RJ, Brazil); the purity of RIF was 99.7% and that of INH was 100.8%. Chromatographic determinations involve the use of HPLC-grade solvents (JT Baker or similar) and ultra-pure water (Milli-Q, Millipore, Bedford, MA, USA). All other chemicals were of analytical grade.
Isoniazid stock solutions (137 mg L-1) were prepared
daily by dissolving 13.7 mg of isoniazid in 100 mL of
deionized water. Rifampicin stock solutions (411 mg L-1)
were prepared daily by dissolving 20.5 mg of rifampicin in 10 mL of methanol and diluting to 50 mL with deionized
water. A Cu(II) solution (242 mg L-1) was prepared
by dissolving 121 mg of Cu(NO3)2·3H2O in 50 mL of
deionized water. The neocuproine solution (218 mg L-1)
was prepared by dissolving 109 mg of neocuproine in 10 mL of methanol and diluting to 50 mL with deionized water. The acetate buffer solution (pH 5) was prepared by dissolving 4.115 g of sodium acetate in 1.6 mL of acetic acid and diluting to 500 mL with deionized water. Further dilutions were made with this acetate buffer solution.
Factorial design and response surface
The colorimetric reaction for the indirect determination of isoniazid was optimized using a factorial design. A two-level factorial design was selected, and the quantitative factors evaluated were pH (4 and 6), concentration of the
Cu(II) solution (12 and 24.2 mg L-1) and concentration
of the neocuproine solution (43.4 and 217.3 mg L-1). The
two significant factors to increase the sensitivity of the spectrophotometric method were further studied by a central composite design (Table 1), in which fixed concentrations
of INH (5.3 mg L-1) and neocuproine (54.3 mg L-1) were
maintained. In both designs, the response that was monitored was the absorbance signal at 455 nm.
Analytical procedure
Forty six synthetic mixtures were prepared by mixing known amounts of RIF and INH standard solutions, 1.0 mL of NC and 1.0 mL of Cu(II) stock solutions in a 10 mL volumetric flask and diluting with acetate buffer solution (pH 5). The final concentration of these solutions ranged between
8 and 60 mg L-1 of RIF and between 1.5 and 7 mg L-1 of INH.
The absorption spectra were recorded between 350 and 800 nm using a spectral resolution of 1 nm. The precision (reported as the relative standard deviation, RSD (%)), linearity (evaluated by regression analysis) and accuracy of the method for the determination of the drugs in pharmaceutical formulations were validated by considering the results obtained by the application of the
chromatographic standard procedure.23
Multivariate calibration
PLSR models were developed from twenty five
synthetic mixtures containing 8 to 57 mg L-1 of RIF and
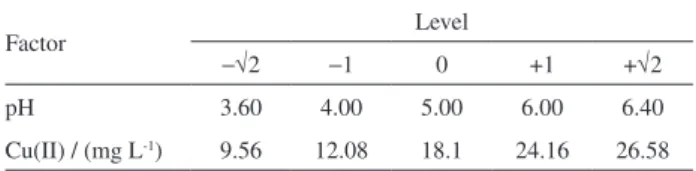
Table 1. Factors and levels used in the central composite design to optimize the colorimetric reaction of isoniazid
Factor Level
−√2 −1 0 +1 +√2
pH 3.60 4.00 5.00 6.00 6.40
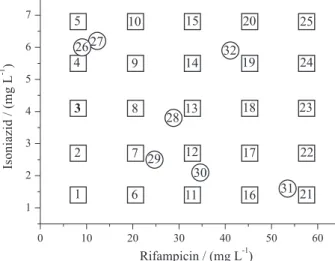
1.5 to 7 mg L-1 of INH (Figure 1). In addition, seven
synthetic mixtures were prepared in triplicate and reserved as an external validation set. Two of these samples (26 and 27) show similar concentrations to that shown by the analyzed drugs, while the remaining samples were randomly selected.
The mixtures were treated according to the previously described general procedure. The absorbance data were processed using PLS-Toolbox 3.0 (Eigenvector Research, Inc., Wenatchee, USA) software operated in MATLAB version 6.5 (Mathworks, Natick, USA) software.
Analysis of the pharmaceutical formulations
Four pharmaceutical formulations (capsules and tablets) were kindly supplied by the Health Secretary of the Paraná State (Brazil); the samples contained
300 mg per 200 mg and 150 mg per 100 mg of RIF and INH,
respectively, per capsule or tablet. These pharmaceutical
formulations contain a large number of excipients, including aerosol, explocel, talc and magnesium stearate (tablet form), magnesium stearate, sodium starch glycolate and microcrystalline cellulose (capsules form).
Ten tablets were individually weighed to obtain their representative average weights and were then finely powdered and mixed. In the case of capsules, the contents of ten capsules were completely removed from their shells.
Each of the pharmaceutical formulations was accurately weighed (40 mg) and transferred to a 100 mL volumetric flask. Approximately 10 mL of methanol were added to dissolve the drugs, and deionized water was used for
dilution. An aliquot of 440 µL of this solution was prepared
according to the previously described procedure in order
to obtain a final concentration within of the calibration concentration range.
General procedure for the analysis of urine samples
Urine samples were obtained from eight volunteers (male and female healthy donors) of two different age ranges. An aliquot of 2.0 mL of urine in a 10 mL volumetric flask was spiked to achieve a final concentration of
approximately 20.5 mg L-1 for RIF and 1.5 mg L-1 for INH.
Afterwards, the samples were submitted to the previously described general procedure. This concentration range was selected on the basis of previous literature, which suggests
typical concentrations between 0.2-3.0 mg L-1 for INH24 and
0.3-100 mg L-1 for RIF25 in urine samples of patient with
active pulmonary tuberculosis.
Results and Discussion
Derivatization reaction of isoniazid
The proposed spectrophotometric method is based on the reducing capacity of INH toward the Cu(II)-neocuproine complex, with formation of a colored Cu(I)-neocuproine
complex that absorbs at 455 nm.22,25-27
A full factorial design (23) was initially performed
to study the influence of relevant variables (i.e., pH, concentration of the Cu(II) solution and concentration of neocuproine solution) on the colorimetric reaction (results not shown). The most significant effect that improved the reaction sensitivity (evaluated by the evolution of the spectral signal at 455 nm) was caused by pH (+0.1589). The effect of the concentration of the Cu(II) solution (+0.1187) and its interaction factor with the pH (+0.0715) was also significant. These results show that the concentration of neocuproine (studied in the concentration range) does not interfere with the reaction sensitivity, most likely because the reactant is present in excess.
A central composite design with two levels and two factors (pH and concentration of the Cu(II) solution, Table 2) was used to optimize and model the reaction. A quadratic model was determined and evaluated by analysis of variance (ANOVA) (Table 3).
The quadratic model showed good agreement between the percentage of explained variance (99.10%) and the maximum percentage of explainable variance (99.80%).
The value of the mean square ratio MSreg/MSres was
statistically significant (F-value >>> F-crit95%). Moreover,
the value of the mean square ratio MSlof/MSpe was not
statistically significant (F-value <<<< F-crit95%), which
indicated no evidence of lack-of-fit for the quadratic model.
Figure 2 shows the response surface of the quadratic model that describes the reaction sensitivity as a function of the coded factors. The experimental conditions for maximum sensitivity are a pH of 6.0 and Cu(II)
concentration of 26.6 mg L-1. However, in view of the
high sensitivity also observed at the pH of the central point (pH 5.0), this condition was selected for further assays, mainly to avoid the hydrolysis of Cu(II).
The influence of pH on the reduction of Cu(II) by INH
has been described previously.22,28 At pH 5.0, INH has only
a single positive charge (pKa values: 1.8 for the nitrogen of
pyridine, 3.5 for the hydrazine group –NH and 10.8 for the
hydrazine group –NH2),
29 which is a favorable condition for
the oxidation of the hydrazine group30 by formation of an
acyl radical, resulting in the formation of the corresponding carboxylic acid.28,31
The spectral profiles shown in Figure 3 confirm that INH and the Cu(II)-neocuproine complex do not absorb in the monitored spectral region, whereas RIF shows an intense signal centered at 470 nm (Figure 3). Under the selected experimental conditions, the characteristic band of RIF is changed significantly, which produces an absorption
profile that is compatible with RIF quinine.32 In the presence
of INH, the characteristic signal of the Cu(I)-neocuproine complex becames visible as a broad band centered at 450 nm (Figure 3).
After derivatization (Figure 3, curves d and e), the spectra of both analytes are similar, and a strong spectral overlap can be observed (Figure 3, curve f). For this reason, PLSR model was used for the simultaneous determination of INH and RIF.
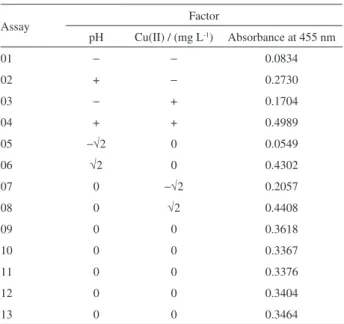
Table 2. Central composite design to improve the sensitivity of colorimetric reaction in the determination of isoniazid
Assay Factor
pH Cu(II) / (mg L-1) Absorbance at 455 nm
01 − − 0.0834
02 + − 0.2730
03 − + 0.1704
04 + + 0.4989
05 −√2 0 0.0549
06 √2 0 0.4302
07 0 −√2 0.2057
08 0 √2 0.4408
09 0 0 0.3618
10 0 0 0.3367
11 0 0 0.3376
12 0 0 0.3404
13 0 0 0.3464
Table 3. Analysis of variance (quadratic model) for optimization of the colorimetric reaction
Source Sum of
squares DF Mean square F-value F-crit95%
Regression 0.2182 5 4.36 × 10⁻² 160.983 3.97
Residual 0.0019 7 2.71 × 10⁻⁴
Lack-of-fit 0.0017 3 5.67 × 10⁻⁴ 4.576 6.59
Pure error 0.0004 4 1.00 × 10⁻⁴
Total 0.1101 12
Percentage of explained variance = 99.10
Maximum percentage of explainable variance = 99.80
Figure 3. Absorption spectra of Cu(II)-neocuproine (a), 1.4 mg L-1 INH
(b), 8.2 mg L-1 RIF (c) and those of Cu(I)-neocuproine in the presence of
1.4 mg L-1 INH (d), 8.2 mg L-1 RIF (e) and the mixture of INH and RIF (f).
Figure 2. Quadratic response surface (A(455 nm) = 0.3446 + 0.1311 pH + 0.0807 CCu(II)− 0.0576 pH2− 0.0173 C
PLSR models: calibration and validation
The multivariate models were elaborated from 25 synthetic mixtures containing RIF and INH (Figure 1) submitted to the derivatization system. Several models were developed by PLSR using different pre-processing systems and several latent variables (LVs).
Seven synthetic mixtures in triplicate were used as an external validation set.
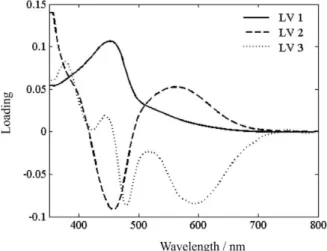
The performance of the regression models was evaluated by analysis of the calibration model root-mean square error of calibration (RMSEC) and of validation (RMSEP) as well by the observed correlation (R) between the predicted and experimental values. In our case, smoothed spectral data and 3 factors were found to be optimum for the PLS-1 method. The loading data (Figure 4) indicate that these three latent variables enclose relevant analytical information without adding noise to the model. LV1 explains much of the spectral information of the derivatization product of RIF (Figure 3, curve c), and LV2 is responsible for capturing much of the spectral information from the derivatized product of INH (Figure 3, curve b). The lowest prediction error and RMSEP (Table 4) were obtained using three latent variables and smoothed spectral
data. For this model, all prediction errors for the external validation set were lower than 5% (most prediction errors were lower than 2%).
Considering the limiting values of ± 2.5 for studentized
residues (95% confidence) and 3(LV)/n for leverage (0.36), anomalies were not observed in the calibration set (Figure 5). The high leverage value of sample 25 implies an important influence on the developed model, not because it represents an anomaly, but due to the higher relative concentration of both study drugs (see Figure 1).
A one-way ANOVA test was conducted to compare the estimated concentration of INH and RIF in aqueous solutions and the reference concentrations on both calibration and validation sets (Table 5). In this procedure,
Snedecor’s F-values were computed and compared with
the tabulated F-value (p = 0.05). The same computation
process was repeated for both drugs. The value of the mean
square ratio MSreg/MSres was much greater than the critical
F-value, which implies a statistically significance of the
regression at a 95% confidence level. Likewise, the value
of the mean square ratio MSlof/MSpe proved to be below the
critical F-value, revealing no evidence of lack-of-fit for the
model. Thus, the numerical values of all statistic parameters indicated that our methods are suitable for the simultaneous determination of both drugs in aqueous solutions.
Limits of detection (LOD) of 0.06 and 0.04 mg L-1 and
limits of quantification (LOQ) of 0.19 and 0.13 mg L-1 were
established for RIF and INH, respectively, according to
procedures described by Valderrama et al..33
Analysis of real samples
Different oral pharmaceutical formulations were analyzed using the proposed method, and the results are
Table 4. Relative mean errors (n = 21) and RMSEP for the best model developed for the determination of RIF and INH in synthetic mixtures from the validation set by the multivariate calibration system
LV number
Pre-processing
Mean centered Smoothed
RIF INH RIF INH
2 100 100 30.0 64.4
3 71.2 43.1 1.2 1.1
4 68.0 41.7 1.7 5.9
5 63.2 38.9 1.9 6.8
RMSEP3 LVs / (mg L-1) 1.64 0.15 0.2 0.1
Figure 4. Loading data on 3 LVs to the PLS-1 optimized model.
shown in Table 6, together with the results obtained using the official HPLC method. The statistical significance of the difference between the methods for the determination of
RIF and INH was obtained using paired t-tests (νRIF = 4 and
νINH = 4). No significant differences were observed at the
95% confidence level (tRIF = 1.37 and tINH = 2.76, both
of which are less than the critical value of 3.182). These results indicated a good agreement between the proposed multivariate and the official chromatographic method. The simplicity of the multivariate spectrophotometric method allows a high analytical throughput, allowing
approximately one assay per min.
Determination of rifampicin and isoniazid in urine
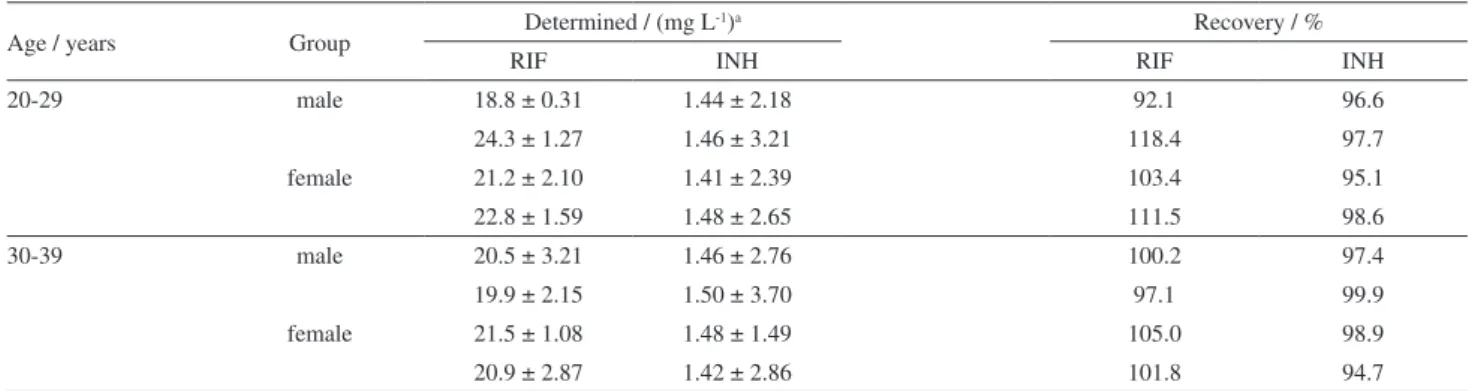
Because of the good performance of the proposed method for simultaneous determination of RIF and INH in pharmaceutical preparations, the method was evaluated for the analysis of a more complex matrix (urine). Figure 6 shows that the spectral profile of spiked urine samples was very similar to that observed for the synthetic RIF/INH mixtures, which demonstrates the practical absence of spectral interferences caused by urine matrix. Moreover, the slight difference observed between samples from people under medical treatment with other drugs and samples of people who do not make use of any drug is an argument that suggests robustness of the proposed method.
The results obtained in the analysis of eight spiked urine samples are shown in Table 7. Taking into account the excellent observed recoveries, the efficiency of the proposed method for the analysis of complex matrices was demonstrated.
Conclusions
The proposed method avoids matrix interferences with a simple derivatization reaction, while spectral interferences can be overcome by using PLSR. The derivatization reaction was optimized by a response surface to provide a best sensitivity for the determination of INH (minor component in pharmaceutical formulations), and the best conditions were pH 5.0 and higher concentrations of Cu(II) solutions.
PLSR models of high predictive capability were obtained using smoothed spectral data and 3 LVs. Under
Table 5. Analysis of variance for the multivariate determination of RIF and INH from the calibration (n = 25) and validation (n = 7 × 3) sets
Source Sum of squares DF
Mean
square F-value F-crit95%
Rifampicin
Regression 12070 1 12070 77177 4.08
Residual 6.901 44 0.157
Lack-of-fit 0.800 1 0.800 0.542 161.4
Pure error 1.476 1 1.476
Total 12079 45
rcalibration 0.999 Isoniazid
Regression 165.9 1 165.1 1821 4.08
Residual 3.988 44 0,091
Lack-of-fit 2.546 1 2.546 0.333 161.4
Pure error 7.654 1 7.654
Total 162.7 45
rcalibration 0.999
Table 6. Determination of RIF and INH in an oral pharmaceutical formulation using the proposed method and the official pharmacopoeia method
Pharmaceutical preparation
Predicted concentration / mg
Proposed methoda
USP XVII methodb
MED A (capsule) RIF 300 mg 304.9 299.0
INH 150 mg 212.4 205.0
MED B (capsule) RIF 200 mg 153.4 153.2
INH 100 mg 106.2 101.2
MED C (tablet) RIF 300 mg 318.3 325.0
INH 150 mg 208.7 199.1
MED D (tablet) RIF 200 mg 165.5 169.7
INH 100 mg 109.2 108.7
aVisible spectrophotometry with multivariate calibration (n = 5); bHPLC
(n = 3).
these conditions, relative mean errors of approximately 1% were observed in the external validation process.
In the analysis of commercial drugs (capsules and tablets), prediction errors lower than 3% for RIF and 5% for INH were observed for results obtained by applying the standard chromatographic method. This method is
simple, inexpensive and fast (less than 50 s per assay).
The method can be applied to the analysis of urine samples without pretreatment (only a dilution is necessary). Interference of the urine matrix is not observed in the simultaneous determination of RIF and INH with adequate recoveries.
Finally, it is important to emphasize that, in view of the fact that the determination is based on spectral signals located in the visible region, interferences from the drug excipients and from the several other components of the urine matrix do not significantly interfere.
Acknowledgments
The authors are grateful to CAPES (Coordenação de Aperfeiçoamento de Pessoal de Nível Superior) for the scholarship granted and to CNPq (Conselho Nacional de Desenvolvimento Científico e Tecnológico) for financial support.
References
1. Morel, M. C.; Cadernos de Saúde Pública 2006, 22, 1522. 2. World Health Organization (WHO), Tuberculosis (TB), 2013,
http://www.who.int/tb/en/, accessed in April 2013.
3. Wo r l d H e a l t h O r g a n i z a t i o n ( W H O ) , G l o b a l Tuberculosis Report 2012, http://apps.who.int/iris/ bitstream/10665/75938/1/9789241564502_eng.pdf accessed in April 2013.
4. Agrawal, S. K.; Kaur, J.; Singh, I.; Bhade, S. R.; Kaul, C. L.; Panchangula, R.; Int. J. Pharm. 2002, 233, 169.
5. Bhutani, H.; Singh, S.; Jindal, K. C.; Chakraborti, A. K.; J. Pharm. Biomed. Anal. 2005, 39, 892.
6. Argekar, A. P.; Kunjir, S. S.; Purandare K. S.; J. Pharm. Biomed. Anal. 1996, 14, 1645.
7. Gaitonde, C. D.; Pathak, P. V.; Drug Dev. Ind. Pharm. 1991, 17, 1201.
8. Panchagnula, R.; Sood, A.; Sharda, N.; Kaur, K.; Kaul, C. L.; J. Pharm. Biomed. Anal. 1999, 18, 1013.
9. Calleri, E.; Lorenzi, E.; Furlanetto, S.; Massolini, B. G., Caccialanza, G.; J. Pharm. Biomed. Anal. 2002, 29, 1089. 10. Espinosa-Mansilla, A.; Acedo-Valenzuela, M. I.; Peña, A. M.;
Cañada, F. C.; Madan, J.; Dwivedi, A. K.; Singh, S.; Talanta 2002, 58, 273.
11. Khuhawar, M. Y.; Rind, F. M. A.; J. Chromatogr., B: Analyt. Technol. Biomed. Life Sci. 2002, 766, 357.
12. Fang, P.; Deli, H.; Huazhu, R.; Youtan, Q.; Xu, W. P.; Pingliu, Y.; Yuanzhang, W.; Changchen, Y.; Zhang, F.; J. Chromatogr., B: Analyt. Technol. Biomed. Life Sci. 2010, 878, 2286.
13. Gikas, E.; Bazoti, F. N.; Nourgiakis, P.; Perivolioti, E.; Roussidis, A.; Skoutelis, A.; Tsarbopoulos, A.; J. Pharm. Biomed. Anal. 2010, 51, 901.
14. Acedo-Valenzuela, M. I.; Espinosa-Mansilla, A.; La-Pena, A. M.; Canada-Canada, F.; Anal. Bioanal. Chem. 2002, 374, 432. 15. Mahalanabis, K. K.; Basu, D.; Royt, B.; Analyst 1989, 114,
1311.
16. Espinosa-Mansilla, A.; Valenzuela, M. I. A.; La-Pena, A. M.; Salinas, F.; Canada, F. C.; Anal. Chim. Acta. 2001, 427, 129. 17. Li, B.; He, Y.; Lv, J.; Zhang, Z.; Anal. Bioanal. Chem. 2005,
383, 817.
18. Benetton, S. A.; Kedor-Hackmann, E. R. M.; Santoro, M. I. R. M.; Borges, V; Talanta 1998, 47, 639.
19. Lomillo, M. A. A.; Renedo, O. D.; Martinez, M. J. A.; Anal. Chim. Acta 2001, 449, 167.
20. Hammam, E.; Beltagi, A. M.; Ghoneim, M. M.; Microchem. J. 2004, 77, 53.
21. Leandro, K. C.; Carvalho, J. M.; Giovanelli, L. F.; Moreira, J. C.; Braz. J. Pharm. Sci. 2009, 45, 332.
Table 7. Determination of rifampicin and isoniazid using visible spectrophotometry and multivariate calibration in spiked human urine
Age / years Group Determined / (mg L
-1)a Recovery / %
RIF INH RIF INH
20-29 male 18.8 ± 0.31 1.44 ± 2.18 92.1 96.6
24.3 ± 1.27 1.46 ± 3.21 118.4 97.7
female 21.2 ± 2.10 1.41 ± 2.39 103.4 95.1
22.8 ± 1.59 1.48 ± 2.65 111.5 98.6
30-39 male 20.5 ± 3.21 1.46 ± 2.76 100.2 97.4
19.9 ± 2.15 1.50 ± 3.70 97.1 99.9
female 21.5 ± 1.08 1.48 ± 1.49 105.0 98.9
20.9 ± 2.87 1.42 ± 2.86 101.8 94.7
22. Safavi, A.; Karimi, M. A.; Nezhad, M. R. H.; Kamali, R.; Saghir, N.; Spectrochim. Acta, Part A 2004, 60, 765.
23. US Pharmacopeial Convention, US Pharmacopeia National Formulary, 30th ed., Rockville, MD, USA, 2007.
24. Venkataramann, P.; Menon K.; Nair, G. K.; Radhakrishnac, S.; Andrar, H.; Tripathy, S. P; Tubercle 1972, 53, 84.
25. Mitchison, D. A.; Allen, W.; Miller, A. B.; Tubercle 1970, 51, 300.
26. Guçlu, K.; Sozgen, K.; Tutem, E.; Ozyurek, M.; Apak, R.; Talanta 2005, 65, 1226.
27. Gouda, A. A.; Amin, A. S.; Arab. Chem. J. 2010, 3, 159. 28. Lee, G.; Rossi, M. V.; Coichev, N.; Moya, H. D.; Food Chem.
2011, 126, 679.
28. Zhang, H.; Zhang, Y.; Xianjun, W.; Xinzhen, D.; Quanmin, L.; Chin. J. Chem. 2009, 27, 518.
29. Wheate, N. J.; Vora, V.; Anthony, N. G.; McInnes, F. J.; J. Inclusion Phenom. Macrocyclic Chem. 2010, 68, 359. 30. Greenwood, N. N.; Earnshaw, A.; Chemistry of the Elements,
2nd ed; Butterworth-Heinemann: Oxford, UK, 1997.
31. Amos, R. I. J.; Yates, B. F.; Gourlay, B. S.; Schiesser, C. H.; Smith, J. A.; Chem. Commun. 2008,1695.
32. Reisbig, R. R.; Woody, A.; Young, M.; Woody, R. W.; Biochemistry 1982, 21, 196.
33. Valderrama, P.; Braga, J. W. B.; Poppi, R. J.; Quim. Nova 2009, 32, 1278.
Submitted: January 29, 2013