Printed in Brazil - ©2007 Sociedade Brasileira de Química 0103 - 5053 $6.00+0.00
Short RShort RShort RShort RShort R
eporteporteporteporteport
*e-mail: [email protected]
Cross-Validation for the Selection of Spectral Variables Using the
Successive Projections Algorithm
Roberto Kawakami Harrop Galvão,a Mário César Ugulino Araújo,*,b Edvan Cirino Silva,b Gledson Emidio José,bSófacles Figueredo Carreiro Soaresb and Henrique Mohallem Paivac
a
Instituto Tecnológico de Aeronáutica, Divisão de Engenharia Eletrônica, 12228-900 São José dos Campos-SP, Brazil
b
Departamento de Química, Universidade Federal da Paraíba, CP 5093, 58051-970 João Pessoa-PB, Brazil
c
Empresa Brasileira de Aeronáutica (EMBRAER), Flight Control Systems, 12227-901 São José dos Campos-SP, Brazil
Este trabalho compara o uso de um conjunto de validação separado e de validação cruzada amostra-a-amostra para guiar a seleção de variáveis no Algoritmo das Projeções Sucessivas (APS) para calibração multivariada. Análises de diesel e milho por espectrometria NIR são apresentadas. Uma interface gráfica do APS encontra-se disponível em www.ele.ita.br/ ~kawakami/spa/
This work compares the use of a separate validation set and leave-one-out cross-validation to guide the selection of variables in the Successive Projections Algorithm (SPA) for multivariate calibration. Two case studies involving diesel and corn analysis by NIR spectrometry are presented. A graphical interface for SPA is available at www.ele.ita.br/~kawakami/spa/
Keywords: multiple linear regression, variable selection, successive projections algorithm, cross-validation, near-infrared spectrometry
Introduction
The Successive Projections Algorithm (SPA) is a variable selection technique specifically designed to improve the conditioning of Multiple Linear Regression (MLR) by minimizing collinearity effects in the calibration
data set. In several applications involving UV-Vis,1,2
ICP-OES,3 FT-IR4 and NIR spectrometry,4-6 MLR-SPA resulted
in models with good prediction ability when compared to conventional full-spectrum models obtained with Partial-Least-Squares (PLS).
In SPA, candidate subsets of variables are constructed according to a sequence of projection operations involving the columns of the instrumental response matrix. These candidate subsets are then evaluated according to the prediction performance of the resulting MLR model. In SPA such prediction performance has been so far assessed by using an independent validation set.
It is worth noting that the definition of a repre-sentative validation set may not be a trivial task and is
actually a matter of ongoing research.7,8 This problem
is more apparent in analytical applications involving complex matrices, such as fuel and food products, in which the variability of composition cannot be easily reproduced by optimized experimental designs. In this case, the validation set must somehow be extracted from the pool of real samples available for model-building purposes.
In this context, the use of cross-validation techniques may be a valuable alternative, which has never been
investigated in previous works concerning SPA.1-6 To
involved. For this purpose, two case studies involving the analysis of diesel and corn samples by near-infrared (NIR) spectroscopy are presented. The results obtained with MLR-SPA are also compared with those obtained by full-spectrum PLS.
A graphical user interface (GUI) for SPA, incorporating the cross-validation option, was developed for the convenience of prospective users. The GUI files can be downloaded at www.ele.ita.br/~kawakami/spa/
Background and theory
Suppose that the instrumental response data are
disposed in a matrix X of dimensions (N × K) such that
the kth variable x
k is associated to the k
th column vector x
k
∈ ℜΝ. Let M = min (N - 1, K) be the maximum number
of variables that can be included in an MLR model with intercept term.
SPA comprises three phases. The first phase consists
of projections carried out on the X matrix, which
generate K chains of M variables each. Each element
in a chain is selected in order to display the least collinearity with the previous ones. These operations can be implemented in a computationally efficient manner in the Matlab environment by using the
built-in function qr. By default, the qr function adopts the
column with largest norm as the starting vector. However, a scaling procedure can be employed to force the algorithm to start from any given column. Such a procedure is implemented in the Matlab routine
projections—qr.m presented in Table 1.
The second phase of SPA consists of evaluating candidate subsets of variables extracted from the chains generated in the first phase. The third and final phase is an elimination procedure aimed at discarding variables that do not significantly contribute towards the prediction ability of the MLR model. More details concerning the operations involved in SPA can be found
elsewhere.1,9
In all previous applications of SPA, the performance metric employed in Phases 2 and 3 was the RMSEV value
obtained in an independent validation set of Nval samples,
defined as
(1)
where yval,n and y^val,n are the reference and predicted values
of the parameter under consideration for the nth validation
sample. In the present work, an extension of this criterion to the cross-validation case is adopted by considering the root mean square error of cross-validation (RMSECV) defined as
(2)
where ycal,n is the reference value of the parameter under
consideration for the nth sample of the calibration set itself,
which contains Ncal samples. The predicted value y^cal,n is
obtained by a leave-one-out procedure, which consists of
removing the nth sample from the calibration set, building a
model with the remaining ones, and applying this model to the removed sample. This procedure is employed in Phases 2 and 3 of SPA described above. Phase 1 (projection operations) is not repeated in the cross-validation procedure to alleviate the computational workload involved in the process.
Experimental
Diesel data set
A total of 170 diesel samples were collected from gas stations in the city of Recife (Pernambuco State, Brazil). NIR spectra in the range 880-1675 nm were obtained using an FT-NIR/MIR spectrometer Perkin Elmer GX fitted with a Hellma® 130-QS quartz flow-through cell with an optical path length of 1.0 cm. A spectral resolution of 2
cm-1 and 16 scans were used.
Table 1. Matlab Script employed in Phase 1 of SPA
function chain = projections_qr(X,k,M)
% X —> Matrix of predictor variables (# objects N x # variables K) % k —> Index of the initial column for the projection operations % M —> Number of variables to include in the chain
% chain —> Index set of the variables resulting from the projection operations X_projected = X;
norms = sum(X_projected.^2); % Square norm of each column vector norm_max = max(norms); % Norm of the “largest” column vector % Scales the kth column so that it becomes the “largest” column X_projected(:,k) = X_projected(:,k)*2*norm_max/norms(k); [dummy1,dummy2,order] = qr(X_projected,0);
Reference values for sulphur content were determined by using energy-dispersive X-ray fluorescence according to the ASTM (American Society for Testing and Materials) 4294-90 standard. For this purpose, a Spectro
Titan spectrophotometer (current of 400 µA, tube voltage
of 5.5 kV and irradiation time of 300s) was employed. In addition, reference values for three distillation temperatures (Initial Point IP, T10% and T90%) were obtained according to the ASTM D86 standard by using a Herzog HDA 628 automatic distiller.
Corn data set
This data set comprises 80 corn samples with NIR spectra in the range 1100-2498 nm acquired by 3 spectrometers and is publicly available at www.eigenvector.com/Data/Corn/. In this study, only the data from spectrometer “m5” were employed. The data set also includes reference values of moisture, oil, protein and starch content for each sample.
Sample set partitioning
The SPXY algorithm7 was used to divide the available
samples into calibration, validation, and prediction sets. The diesel data were divided into 70 (calibration), 50 (validation), and 50 (prediction) samples. The corn data were divided into 40 (calibration), 20 (validation), and 20 (prediction) samples. For the cross-validation study, the calibration and validation samples were merged into a single calibration set. The prediction set was employed to compare the performance of the resulting models according to the root mean square error of prediction (RMSEP) metric, which is defined by using an equation similar to equation 1. It is worth noting that the prediction samples are not used in any phase of the variable selection or calibration procedures.
Software
Savitzky-Golay differentiation and PLS regression were
performed by using The Unscrambler® 9.6 (CAMO AS,
Oslo, Norway). The number of latent variables for PLS was determined on the basis of the validation or cross-validation error by using the default settings of the software. SPA variable selection, MLR modelling and SPXY sample
selection were implemented in MATLAB® 6.5.
Results and Discussion
Diesel analysis
Figure 1a shows the raw spectra of the 170 diesel samples. The spectra display undesirable baseline features, which were suppressed by using the first derivative with a
Savitzky–Golay filter10 employing a 2nd-order polynomial
and a 13-point window. The resulting derivative spectra shown in Figure 1b comprised 1579 variables and were employed for all calculations.
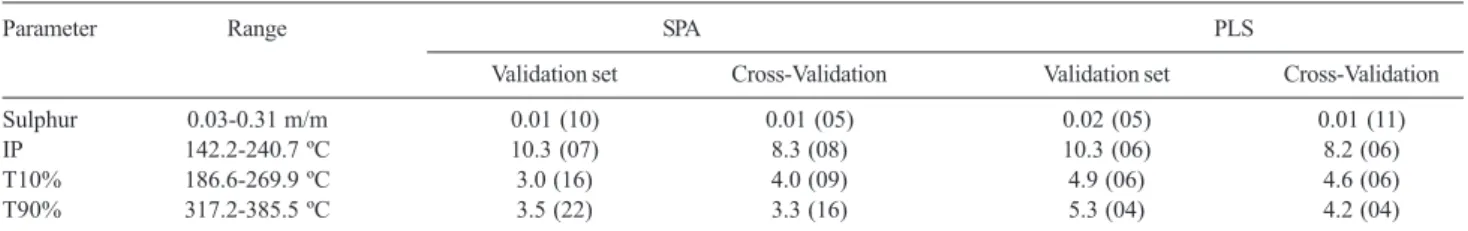
Table 2 presents the RMSEP values obtained when the resulting MLR-SPA and PLS models were applied to the independent prediction set. As can be seen, MLR-SPA and PLS were comparable in terms of prediction performance for sulphur and IP. In T10% and T90%, MLR-SPA noticeably outperformed PLS. The results also show that cross-validation does not provide a systematic advantage over the use of a separate validation set in terms of the RMSEP value for the
Table 2. RMSEP results for (a) sulphur content, (b) IP, (c) T10%, and (d) T90%. The values in parentheses correspond to the number of latent variables in PLS and wavelengths in MLR-SPA
Parameter Range SPA PLS
Validation set Cross-Validation Validation set Cross-Validation
Sulphur 0.03-0.31 m/m 0.01 (10) 0.01 (05) 0.02 (05) 0.01 (11)
IP 142.2-240.7 ºC 10.3 (07) 8.3 (08) 10.3 (06) 8.2 (06)
T10% 186.6-269.9 ºC 3.0 (16) 4.0 (09) 4.9 (06) 4.6 (06)
T90% 317.2-385.5 ºC 3.5 (22) 3.3 (16) 5.3 (04) 4.2 (04)
resulting MLR-SPA models. However, in general, cross-validation resulted in models with a smaller number of selected variables.
Corn analysis
Figure 2a presents the raw spectra of the 80 corn samples. As in the diesel case study, the spectral baseline shifts were removed by using a first derivative procedure, as shown in Figure 2b. In this case, a Savitzky–Golay filter
with a 2nd-order polynomial and a 21-point window was
employed. The resulting derivative spectra shown in Figure 2b comprised 680 variables and were employed for all calculations.
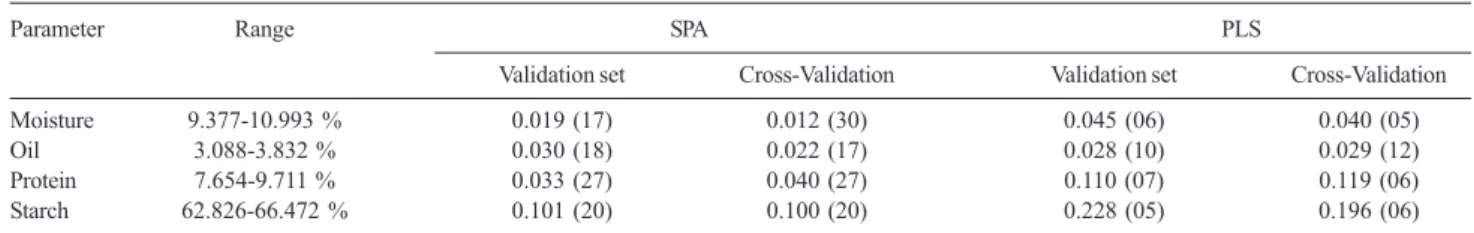
Table 3 presents the RMSEP values obtained when the resulting MLR-SPA and PLS models were applied to the independent prediction set. As can be seen, MLR-SPA noticeably outperformed PLS for moisture, protein, and starch. The oil results were similar for both techniques. Again, there is no systematic difference between the MLR-SPA models obtained by validation or cross-validation from the point of view of final prediction performance. In this case, with the exception of moisture, the number of selected variables is similar in both approaches.
Figure 2. (a) Raw and (b) derivative NIR spectra of the 80 corn samples.
Table 3. RMSEP results for (a) moisture, (b) oil, (c) protein and (d) starch contents. The values in parentheses corresponds to the number of latent variables in PLS and wavelengths in MLR-SPA
Parameter Range SPA PLS
Validation set Cross-Validation Validation set Cross-Validation
Moisture 9.377-10.993 % 0.019 (17) 0.012 (30) 0.045 (06) 0.040 (05)
Oil 3.088-3.832 % 0.030 (18) 0.022 (17) 0.028 (10) 0.029 (12)
Protein 7.654-9.711 % 0.033 (27) 0.040 (27) 0.110 (07) 0.119 (06)
Starch 62.826-66.472 % 0.101 (20) 0.100 (20) 0.228 (05) 0.196 (06)
Conclusions
The results obtained in this work revealed that using a separate validation set or resorting to cross-validation are equally valid approaches to guide the selection of variables in SPA. This finding is of value because it supports the validation procedure employed in all previous papers concerning SPA. On the other hand, despite the computational overhead involved, the proposed cross-validation approach for SPA may be of value when the definition of a representative validation set is not trivial, as is the case with complex matrices such as those considered in this work. In these situations, the use of cross-validation circumvents the need for the delicate task of partitioning the available samples into calibration and validation subsets.
Acknowledgments
The authors thank PROCAD/CAPES (Grant 0081/05-1) and CNPq (Grant 475204/2004-2) for partial financial support. The research fellowships and scholarships granted by CNPq are also gratefully acknowledged. The authors are also indebted to Mr. Cláudio Vicente Ferreira (Laboratório de Combustíveis, Universidade Federal de Pernambuco) for providing the diesel samples and the reference values of the quality parameters employed in this study.
References
1. Araújo, M. C. U.; Saldanha, T. C. B.; Galvão, R. K. H.; Yoneyama, T.; Chame, H. C.; Visani, V.; Chemom. Intell. Lab. Syst.2001, 57, 65.
2. Dantas Filho, H. A.; Souza, E. S. O. N.; Visani, V.; Barros, S. R. R. C.; Saldanha, T. C. B.; Araújo, M. C. U.; Galvão, R. K. H.; J. Braz. Chem. Soc.2005, 16, 58.
3. Galvão, R. K. H.; Pimentel, M. F.; Araujo, M. C. U.; Yoneyama, T.; Visani, V.; Anal. Chim. Acta2001, 443, 107.
4. Honorato, F. A.; Galvão, R. K. H.; Pimentel, M. F.; Neto, B. B.; Araújo, M. C. U.; Carvalho, F. R.; Chemom. Intell. Lab. Syst.
5. Breitkreitz, M. C.; Raimundo Jr., I. M.; Rohwedder, J. J. R.; Pasquini, C.; Dantas Filho, H. A.; José, G. E.; Araújo, M. C. U.; Analyst2003, 128, 1204.
6. Dantas Filho, H. A. D.; Galvão, R. K. H.; Araújo, M. C. U.; Silva, E. C.; Saldanha, T. C. B.; José, G. E.; Pasquini, C.; Raimundo Jr., I. M.; Rohwedder, J. J. R.; Chemom. Intell. Lab. Syst.2004, 72, 83.
7. Galvão, R. K. H.; Araújo, M. C. U.; José, G. E.; Pontes, M. J. C.; Silva, E. C.; Saldanha, T. C. B.; Talanta2005, 67, 736. 8. Kanduc, K. R.; Zupan, J.; Majcen, N.; Chemom. Intell. Lab.
Syst.2003, 65, 221.
9. Galvão, R. K. H.; Araújo, M. C. U.; Fragoso, W. D.; Silva, E. C.; José, G. E.; Soares, S. F. C.; Paiva, H. M.; Chemom. Intell. Lab. Syst., submitted.
10. Beebe, K. R.; Pell, R. J.; Seasholtz, B.; Chemometrics-A Practical Guide, Wiley: New York, 1998.
Received: May 4, 2007 Web Release Date: December 6, 2007