OSD
9, 1009–1043, 2012Arctic surface temperatures from
Metop AVHRR
G. Dybkjær et al.
Title Page
Abstract Introduction
Conclusions References
Tables Figures
◭ ◮
◭ ◮
Back Close
Full Screen / Esc
Printer-friendly Version Interactive Discussion
Discussion
P
a
per
|
Dis
cussion
P
a
per
|
Discussion
P
a
per
|
Discussio
n
P
a
per
|
Ocean Sci. Discuss., 9, 1009–1043, 2012 www.ocean-sci-discuss.net/9/1009/2012/ doi:10.5194/osd-9-1009-2012
© Author(s) 2012. CC Attribution 3.0 License.
Ocean Science Discussions
This discussion paper is/has been under review for the journal Ocean Science (OS). Please refer to the corresponding final paper in OS if available.
Arctic surface temperatures from Metop
AVHRR compared to in situ ocean and
land data
G. Dybkjær, R. Tonboe, and J. Høyer
Danish Meteorological Institute, Lyngbyvej 100, 2100 København, Denmark
Received: 29 February 2012 – Accepted: 4 March 2012 – Published: 14 March 2012
Correspondence to: G. Dybkjær ([email protected])
OSD
9, 1009–1043, 2012Arctic surface temperatures from
Metop AVHRR
G. Dybkjær et al.
Title Page
Abstract Introduction
Conclusions References
Tables Figures
◭ ◮
◭ ◮
Back Close
Full Screen / Esc
Printer-friendly Version Interactive Discussion
Discussion
P
a
per
|
Dis
cussion
P
a
per
|
Discussion
P
a
per
|
Discussio
n
P
a
per
|
Abstract
The ice surface temperature (IST) is an important boundary condition for both atmo-spheric and ocean and sea ice models and for coupled systems. An operational ice surface temperature product using satellite Metop AVHRR infra-red data was devel-oped for MyOcean. The IST can be mapped in clear sky regions using a split window
5
algorithm specially tuned for sea ice. Clear sky conditions are prevailing during spring in the Arctic while persistent cloud cover limits data coverage during summer. The cloud covered regions are detected using the EUMETSAT cloud mask. The Metop IST compares to 2 m temperature at the Greenland ice cap Summit within STD error of 3.14◦C and to Arctic drifting buoy temperature data within STD error of 3.69◦C. A case
10
study reveal that the in situ radiometer data versus satellite IST STD error can be much lower (0.73◦C) and that the different in situ measures complicates the validation. Diff er-ences and variability between Metop IST and in situ data are analysed and discussed. An inter-comparison of Metop IST, numerical weather prediction temperatures and in situ observation indicates large biases between the different quantities. Because of the
15
scarcity of conventional surface temperature or surface air temperature data in the Arc-tic the satellite IST data with its relatively good coverage can potentially add valuable information to model analysis for the Arctic atmosphere.
1 Introduction
The Ice Surface Temperature (IST) is one of the most important components in the
20
Arctic surface-atmosphere energy balance. The surface temperature strongly affects the atmospheric boundary layer structure, the turbulent heat exchange and the ice growth rate (Maykut, 1986). In addition, advanced thermodynamic ice models treat the temperature of the snow surface as a vital parameter for the development of sea ice in models (e.g. Fichefet and Maqueda, 1997; Bitz and Lipscomb, 1999). The surface
tem-25
OSD
9, 1009–1043, 2012Arctic surface temperatures from
Metop AVHRR
G. Dybkjær et al.
Title Page
Abstract Introduction
Conclusions References
Tables Figures
◭ ◮
◭ ◮
Back Close
Full Screen / Esc
Printer-friendly Version Interactive Discussion
Discussion
P
a
per
|
Dis
cussion
P
a
per
|
Discussion
P
a
per
|
Discussio
n
P
a
per
|
and distributed observations of the surface temperature is therefore of great value for building the initial temperature boundary conditions. The IST observations presented here are measured by satellite infra-red radiometers under clear sky conditions. Stef-fen et al. (1993) estimated that a systematic surface temperature change of 1◦C corre-sponds to an outgoing long wave radiation change of approximately 5 W m−2
. From a
5
modelling point of view a systematic year round 5 W energy flux anomaly can be suf-ficient to change the sea ice regime from seasonal to perennial sea ice, or vice versa (Bj ¨ork and S ¨oderkvist, 2002). Hence, the determination of the IST quality with respect to both error and bias is crucial for the applicability of satellite based IST fields in mod-els. The extreme conditions in the Arctic complicate the deployment of instruments and
10
limit their lifetime. Because of these difficulties the data coverage in the Arctic Ocean is very sparse. We identified 30 valid drifters with real time data transmission during 2011, resulting in a density of in situ buoys in the Arctic ocean of approximately 1 per 500 000 km2. Further, the temperature measured by the drifters is uncertain because the drifters nesting on the ice may be buried in snow. In situ observations are
there-15
fore inadequate to resolve spatial and temporal scales of the temperature variations throughout the Arctic. Satellite observations of the snow and ice surface temperatures can complement the in situ observations in order to increase the coverage of the obser-vational network. The IST data analysed here are estimated using Thermal Infra-Red sensors (TIR) from polar orbiting satellite under clear sky conditions. The 6 GHz
mi-20
crowave radiometer data have elsewhere been used for IST estimation during all sky conditions, but these data provide an integrated snow pack temperature rather than the surface temperature, because of the microwave’s penetration in to the snow and ice (Tonboe et al., 2011; Hwang and Barber, 2008). There exist other satellite infra-red IST products like those based on the MODIS sensor (Hall, 2004b) and the AVHRR
25
OSD
9, 1009–1043, 2012Arctic surface temperatures from
Metop AVHRR
G. Dybkjær et al.
Title Page
Abstract Introduction
Conclusions References
Tables Figures
◭ ◮
◭ ◮
Back Close
Full Screen / Esc
Printer-friendly Version Interactive Discussion
Discussion
P
a
per
|
Dis
cussion
P
a
per
|
Discussion
P
a
per
|
Discussio
n
P
a
per
|
into sea ice models despite a potential for improving the model predictions. We think that this may be due to the lack of fully validated operational IST production, in near real time. The objectives of this study is to present and validate a new high resolution (1 km) IST product for the Arctic, based on the Metop-A TIR observations. The paper describes the composite Arctic Surface Temperature algorithm, operated in the
My-5
Ocean Sea Ice and Wind TAC, in near real time. The product is fully operational and intended for use by operational meteorological and oceanographic agencies. Twelve months of validation and comparison is performed versus 3 types of in situ observa-tions: (1) a TIR radiometer mounted on the sea ice, (2) a 2 m temperature record from the Greenland ice cap Summit, and (3) drifting buoy and ship temperature records from
10
the Arctic Ocean and surrounding seas. In addition, the IST data are also compared to model surface temperature fields from the global ECMWF weather prediction model. The paper is organized with Sect. 2 describing the study areas, followed by a presen-tation of the IST algorithm in Sect. 3. In Sect. 4 the in situ and NWP model data are presented along with the data match-up procedures. Results are shown in Sect. 5.
15
Finally, the results are discussed in Sect. 6.
2 Study areas
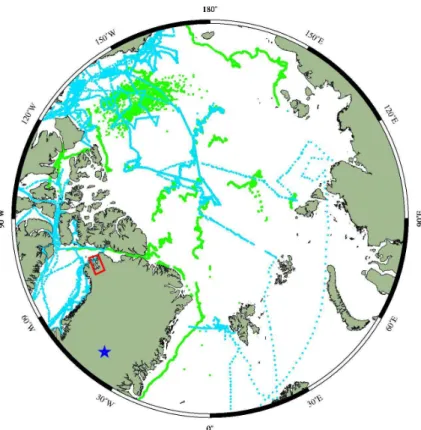
The work presented here show IST validation and comparison results from 3 different Arctic environments and in situ instruments: (1) Drifter temperatures from sea ice in the Arctic Ocean and the seas around Greenland and the Canadian Archipelago, (2)
20
Radiometer temperatures from a study site in the Inglefield Bredning next to Qaanaaq in North East Greenland, and (3) air temperatures from the synoptic station on the Greenland ice cap Summit. The positions of sites and areas are illustrated in Fig. 1. The field site near Qaanaaq is indicated by a red rectangle and the location of Summit on the Greenland ice cap is indicated by the blue star. Photos from Summit and Inglefield
25
OSD
9, 1009–1043, 2012Arctic surface temperatures from
Metop AVHRR
G. Dybkjær et al.
Title Page
Abstract Introduction
Conclusions References
Tables Figures
◭ ◮
◭ ◮
Back Close
Full Screen / Esc
Printer-friendly Version Interactive Discussion
Discussion
P
a
per
|
Dis
cussion
P
a
per
|
Discussion
P
a
per
|
Discussio
n
P
a
per
|
The Arctic Ocean and the adjacent seas are partly covered with perennial ice and partly with seasonal ice. The sea ice surface is often associated with packed ice and open leads, occasionally allowing extensive flux of heat from the ocean to the atmo-sphere. Especially during cloud free periods in the Arctic winter the ice surface is colder than the air, due to long wave radiative cooling, but also the annual mean surface
tem-5
perature is lower than the air temperature (Tonboe et al., 2011; Radionov et al., 1997). The surface temperature of the ice covered Arctic Ocean ranges between approxi-mately 0 and−50◦C.
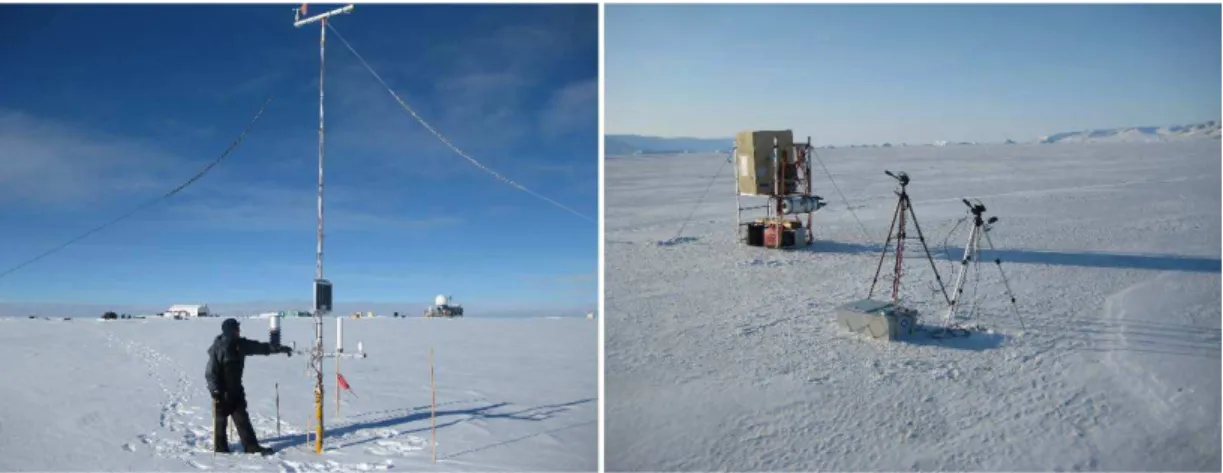
The field work site in the fjord of Inglefield Bredning, where an in situ TIR radiometer was deployed during a 4 days field work, was located 4 km offthe coast near the town
10
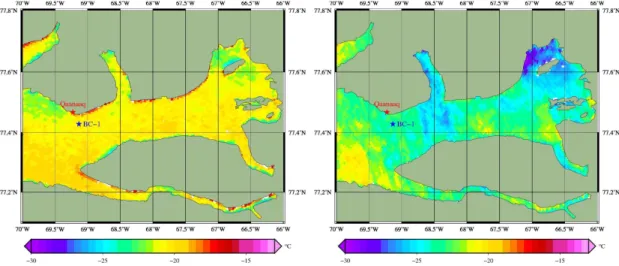
of Qaanaaq. The sea ice on the fjord was level seasonal ice with complete ice cover (see Fig. 2). The temperature range during field work was −17 to−24◦C. The study site is indicated with the blue star in Fig. 3, where the surface temperature is shown at two occasions in the Inglefield Bredning fjord system.
The third in situ temperature record included in this study is collected from the
Sum-15
mit synoptic meteorological station on the Greenland ice cap. This site is located at 3200m altitude with small and relative homogeneous surface roughness (see Fig. 2) and with temperatures ranging from approximately 0◦C to−70◦C. Summit is indicated with a blue star in Fig. 1.
3 Metop Arctic Surface Temperature product
20
The Metop AVHRR Arctic Surface Temperature product (MAST) is an integrated IST, marginal ice zone temperature and high-latitude/Sea Surface Temperature product (SST), developed in the MyOcean project in collaboration with other projects and made available through the Sea Ice and Wind Thematic Assembly Centre (SIWTAC) since January 2011 (MyOcean data, 2011). Two algorithms are deployed in MAST, the Metop
25
OSD
9, 1009–1043, 2012Arctic surface temperatures from
Metop AVHRR
G. Dybkjær et al.
Title Page
Abstract Introduction
Conclusions References
Tables Figures
◭ ◮
◭ ◮
Back Close
Full Screen / Esc
Printer-friendly Version Interactive Discussion
Discussion
P
a
per
|
Dis
cussion
P
a
per
|
Discussion
P
a
per
|
Discussio
n
P
a
per
|
The MAST product is intended for data assimilation schemes in ocean, ice and at-mosphere models as a supplement to traditional drifter and air temperature measure-ments. Timeliness, resolution and accuracy is therefore considered important for the product development, which has led to a product timeliness of 2-3h, spatial resolu-tion of 1.1km at nadir and temporal sampling frequency of up to 10 passes per day at
5
±80◦ latitude and 14 daily passes at the poles. MAST data from the past month can be downloaded through ftp and thredds as level 2 data in 3-minute segments from the MyOcean data repository (MyOcean data, 2011). Further documentation can be found at the MyOcean web page (MyOcean doc, 2011).
The concept of MAST is taken from Vincent et al. (2008), where SST and IST
al-10
gorithms are alternately deployed, depending on the AVHRR channel 4 brightness temperatures (T11). For T11 temperatures warmer than−2.2◦C the SST algorithm is
deployed and for temperatures colder than −4.2◦C the MIST algorithm is deployed. Surfaces with intermediateT11temperatures are considered marginal ice zone and the marginal ice zone temperature is calculated from a linear combination of the MIST and
15
the SST algorithms, scaled by theT11temperature. The MIST algorithm and calibration
is adopted from Key et al. (1997):
MIST=a+b·T11+c·(T11−T12)+d·[(T11−T12)·S(scan)]
Wherea–d are calibration constants based on a NOAA12 AVHRR calibration,T11 and T12 are AVHRR IR channels 4 and 5 (with centre wavelength at approximately 11 and
20
12 microns, respectively),S(scan)=sec(scan)-1 and scanis the satellite scan angle.
The calibration coefficients a-d for Metop-AVHRR data are not available at the present and the coefficients from the AVHRR instrument on board NOAA12 were applied for this version of the algorithm. Different sets of coefficients are used for 3 brightness tem-perature intervals; see Key (1997) and Vincent (2008). TheT11 temperature intervals
25
are:−2.2◦C> T11>=−13.15◦C;−13.15◦C> T11 >=−33.15◦C and−33.15◦C> T11.
OSD
9, 1009–1043, 2012Arctic surface temperatures from
Metop AVHRR
G. Dybkjær et al.
Title Page
Abstract Introduction
Conclusions References
Tables Figures
◭ ◮
◭ ◮
Back Close
Full Screen / Esc
Printer-friendly Version Interactive Discussion
Discussion
P
a
per
|
Dis
cussion
P
a
per
|
Discussion
P
a
per
|
Discussio
n
P
a
per
|
by Le Borgne (2010) and a comprehensive validation and inter-comparison analysis with other SST products is done by Høyer et al. (2012).
A sample of the MAST product covering the Arctic, is shown in Fig. 4 (left), as a six days mean temperature field from 3 to 9 March 2010. The corresponding 2 m temper-ature field from the operational NWP model at ECMWF is plotted in the right panel for
5
comparison, despite the circumstance that the two temperature fields are not neces-sary comparable. The NWP field is the mean of all bi-daily analysis fields from all 6 days and the MAST field is mean files from the cloud free regions and periods only. The two temperature fields reveal that the general temperature patterns from the MAST data are also present in the NWP data and one can observe a cold bias in the MAST data in
10
the central Arctic. Whether this case illustrates a physical difference between surface and air temperatures due to a negative long-wave radiation balance is not clear, but this issue is revisited in Sect. 6. In the MAST-NWP plot it is also noteworthy that large open water areas in the NWP data (from the marginal ice zone and Southward), seem unrealistically cold (approximately−10◦C to−5◦C). In contrast to this, the MAST data
15
represents the transition between close ice and open water with a sharp temperature gradient.
3.1 Input TIR and Cloud-flag data
The input TIR satellite data used by MAST and the cloud detection algorithms are AVHRR swath data, received through the EUMETCast global Metop data stream as
20
3 minute segments. The 3 minute segments are processed using the NWC SAF PPS software (Thoss, 2009). Cloud-flags, sun-satellite geometry information and AVHRR TIR data are subsequently used as input to the MAST processing chain and as supple-mentary information in the match-up data sets, described below. The spatial resolution of the cloud-flag data, the AVHRR TIR data and the MAST product is 1.1 km at nadir
25
and approximately 2.5 km near the edges of the swath.
OSD
9, 1009–1043, 2012Arctic surface temperatures from
Metop AVHRR
G. Dybkjær et al.
Title Page
Abstract Introduction
Conclusions References
Tables Figures
◭ ◮
◭ ◮
Back Close
Full Screen / Esc
Printer-friendly Version Interactive Discussion
Discussion
P
a
per
|
Dis
cussion
P
a
per
|
Discussion
P
a
per
|
Discussio
n
P
a
per
|
possibly contaminated by surface ice or snow”, the cloud-flags 11 and 14, respectively. The reason for including the second best “clear sky” cloud category (cloud-flag 14) is to increase data volume for the monthly error statistics shown in Fig. 5. Annual statistics will be calculated for both cloud flag values and for cloud-flag 11 data only, to demonstrate the best performance of MIST.
5
4 Data description, post processing and match up
Three types of in situ observations have been used in this study to provide more de-tailed error characteristics of MIST. In addition to in situ observations, also model analy-sis temperature fields are included for comparison. Finally, algorithm re-calibration and automated quality filters have been tested to check MIST sensitivity to calibration and
10
to data outliers. A Match-Up (MU) data set for each of the three in situ data sets is generated and is the basis for the validation and comparison exercise.
4.1 In situ observations
In situ temperature observations from drifters and ships (hereafter denoted OBSARCTIC) from the GTS data stream (GTS, 2011), are used to validate MIST on sea ice in the
15
Arctic Ocean and adjacent seas. The OBSARCTIC were initially collected without
qual-ity check and data filtering was performed subsequently. Data appearing on blacklists from the UK Met Office are rejected (C. Parrett, personal communication, 2011) and observations colder than−70◦C and warmer than−1◦C are removed. In addition, all drifter and buoy data with non-physical variability are removed. This three-step
proce-20
dure reduces the number of automatically registered drifter and ship platforms in the GTS data stream, north of 70◦N throughout 2011, from 56 to 30.
In situ observations from the synoptic station on Greenland Summit (WMO-04416) have also been used. The Summit station is a standard WMO synoptic station with 2 m air temperature measurements, at a fixed position in 3200 meters altitude. These
OSD
9, 1009–1043, 2012Arctic surface temperatures from
Metop AVHRR
G. Dybkjær et al.
Title Page
Abstract Introduction
Conclusions References
Tables Figures
◭ ◮
◭ ◮
Back Close
Full Screen / Esc
Printer-friendly Version Interactive Discussion
Discussion
P
a
per
|
Dis
cussion
P
a
per
|
Discussion
P
a
per
|
Discussio
n
P
a
per
|
observations have also been obtained from the GTS and were checked visually. No data were removed. These observations are denoted OBSSUMMIT.
Finally, four days of in situ TIR radiometer measurements from cloud free and nearly cloud free conditions have been collected. The in situ radiometer data, subsequently denoted OBSISAR, are obtained from an ISAR radiometer mounted on levelled first-year
5
ice in the Inglefield Bredning, next to the town of Qaanaaq in North-East Greenland (Dybkjær et al., 2011). The ISAR instrument is a narrow-band self calibrating single channel sensor, developed at National Oceanography Centre, Southampton (NOCS). It is comparable to the channel 4 of the AVHRR sensors and provides an accurate observation of the surface skin temperature, accounting for the contribution from the
10
sky (Donlon et al., 2008). The emissivity used to convert brightness temperature to ice surface temperatures including atmospheric reflection is 0.99. This corresponds to sea water emissivity for a target angle of 25 degrees, and it is in agreement with values of sea ice emissivity used by Dozier and Warren (1982) and Key and Haefliger (1992).
4.2 NWP data
15
Model fields of sea ice surface temperature (NWPSURFACE) and 2 m air temperature
(NWP2MT) have been retrieved from the European Centre of Medium-Range Weather Forecasts (ECMWF) as auxiliary data in the error analysis. The NWPSURFACE and NWP2MT data are model analysis fields from the current global model (ECMWFdoc,
2012). The data are re-sampled to a regular 0.5◦ grid. All 00:00 UTC and 12:00 UTC
20
analysis fields are used.
4.3 Ice concentration
OSD
9, 1009–1043, 2012Arctic surface temperatures from
Metop AVHRR
G. Dybkjær et al.
Title Page
Abstract Introduction
Conclusions References
Tables Figures
◭ ◮
◭ ◮
Back Close
Full Screen / Esc
Printer-friendly Version Interactive Discussion
Discussion
P
a
per
|
Dis
cussion
P
a
per
|
Discussion
P
a
per
|
Discussio
n
P
a
per
|
4.4 Quality filtering
Erroneous outliers, often caused by non detected clouds, are inevitable in present and similar data sets, due to the opacity of the atmosphere to TIR data. We test a simple quality filter based on the residual between NWP and MIST data. The NWP based qual-ity filter removes all records with MIST-NWP errors larger (smaller) than±3 standard
5
deviation of the mean MIST-NWP error. NWPSURFACEdata were used to filter the MIST-OBSARCTIC data, removing 121 records of the 7930 cloud flag 11 records (see Fig. 8).
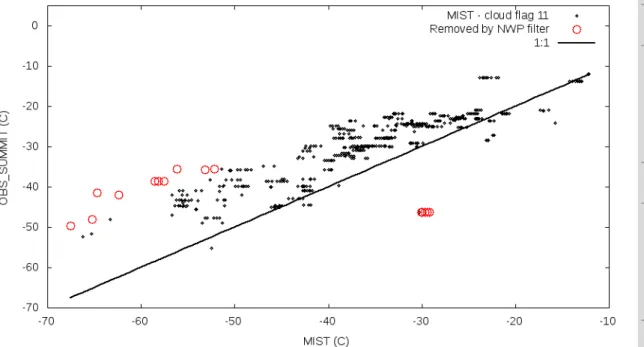
NWP2MT data were used to filter the MIST-OBSSUMMIT data, removing 17 records of
the 607 cloud flag 11 records (see Fig. 9).
4.5 Re-calibration tests
10
To assess errors associated with the use of NOAA 12 calibration coefficients in the MIST algorithm, re-calibration tests of the MIST algorithm were performed against OBSARCTIC and OBSISAR data. The re-calibrations are determined from least square fit to in situ data sets and the biases of these data are consequently zero. Improve-ments of the MIST quality are therefore solely assessed by the standard deviation of
15
errors (STDE). Re-calibrated MIST data are indicated MISTRE CAL.
4.6 Match-up criteria
The MIST satellite data are matched with OBS data and auxiliary information like time lag, distance to observation, ice concentration, NWP temperatures, AVHRR brightness temperatures, and scan and sun angles. The match-up procedure varied between the
20
different types of observations. Therefore, the match-up data sets were treated sepa-rately for the different types of in situ observations. The match-up data set with drifter and ship observations covering the Arctic Ocean and adjacent seas is abbreviated MUARCTIC. The data set containing MIST match-up with in situ radiometer data from the field work in Inglefield Bredning is called the MUISARdata set and the MIST
OSD
9, 1009–1043, 2012Arctic surface temperatures from
Metop AVHRR
G. Dybkjær et al.
Title Page
Abstract Introduction
Conclusions References
Tables Figures
◭ ◮
◭ ◮
Back Close
Full Screen / Esc
Printer-friendly Version Interactive Discussion
Discussion
P
a
per
|
Dis
cussion
P
a
per
|
Discussion
P
a
per
|
Discussio
n
P
a
per
|
up with Summit air temperatures is subsequently denoted MUSUMMIT. The match-up criteria are:
MUARCTIC:
– Period: 11 month – February to December 2011. – Maximum time lag: 1 h
5
– Maximum distance to OBS: 2 km – Maximum scan-angle: 45 degrees
– Maximum MIST value:−4.2◦C (see MIST definition above) – Minimum ice concentration: 90 %
– Cloud flag 11 and 14 allowed
10
MUISAR:
– Period: 4 days in April 2011. – Maximum time lag: 2 min
– Maximum distance to OBS: 2 km
– Cloud conditions were clear or almost clear and ice cover 100 % during data
15
recording.
MUSUMMIT:
– Period: All 2011. – Maximum time lag: 1 h
– Maximum distance to OBS: 2 km
OSD
9, 1009–1043, 2012Arctic surface temperatures from
Metop AVHRR
G. Dybkjær et al.
Title Page
Abstract Introduction
Conclusions References
Tables Figures
◭ ◮
◭ ◮
Back Close
Full Screen / Esc
Printer-friendly Version Interactive Discussion
Discussion
P
a
per
|
Dis
cussion
P
a
per
|
Discussion
P
a
per
|
Discussio
n
P
a
per
|
– Maximum scan-angle: 45 degrees
– Maximum MIST value:−4.2◦C (see MIST definition above)
– Cloud flag 11 and 14 allowed
Abbreviation and acronyms for data and data sets are listed and briefly explained in Table 1.
5
5 Results
The MUARCTIC data set contains more than 20 000 records complying with the
match-up criteria described above. Of these data pairs there are match-up to 16 MIST records for each OBS record, because of the 2 km square search radius match-up criteria. The validation and inter-comparison results are divided into annual and monthly data and
10
differences are described by their standard deviation of error (STDE), bias and corre-lation coefficient (R).
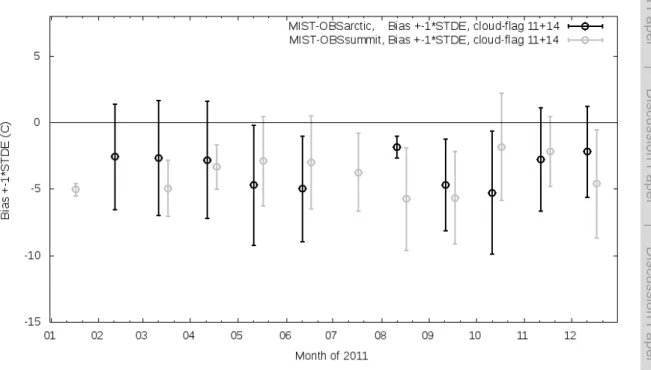
The initial MIST performance is based on the entire match-up data sets. Mean monthly error statistics from the MUARCTICand MUSUMMITdata sets are plotted in Fig. 5 and the corresponding initial quality of the full match-up data sets is written in Table 2.
15
The annual STDE of MIST-OBSARCTIC is 4.29◦C with a cold bias of−3.43◦C. From the
monthly error statistics in Fig. 5 we find the smallest errors during the Arctic summer where cloud detection algorithms in general seem to perform best. The quality of the re-calibrated MUARCTICdata set showed practically no STDE reduction. A change from
4.29◦C to 4.27◦C (not shown), indicating that other sources of errors are much larger
20
than the errors derived from the applied calibration of the MIST algorithm. By applying the NWP quality filter to remove major outliers in cloud-flag 11 data of the MUARCTIC
data set (see Fig. 8), the overall STDE improves to 3.69◦C (Table 3).
In contrast to the errors of the MUARCTIC data set, we find highly accurate MIST match-up data with the in situ radiometer data in the MUISAR data set. Here we also
OSD
9, 1009–1043, 2012Arctic surface temperatures from
Metop AVHRR
G. Dybkjær et al.
Title Page
Abstract Introduction
Conclusions References
Tables Figures
◭ ◮
◭ ◮
Back Close
Full Screen / Esc
Printer-friendly Version Interactive Discussion
Discussion
P
a
per
|
Dis
cussion
P
a
per
|
Discussion
P
a
per
|
Discussio
n
P
a
per
|
find further improvements in the re-calibrated data, thus reducing STDE from 1.02◦C to 0.73◦C, for the MIST and MISTRE CAL data match-up with OBSISAR data, respectively
(Tables 2 and 3).
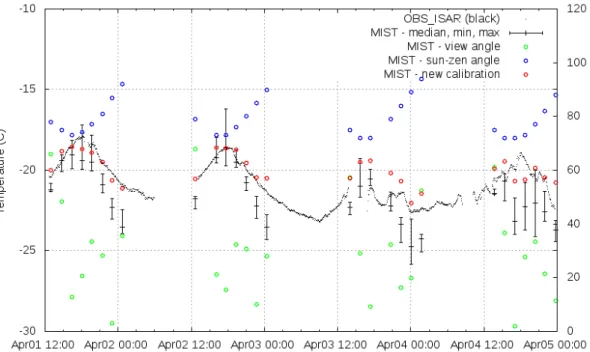
The OBSISAR, MIST and MISTRE CAL data are plotted in Fig. 6, where data from all scan angles are shown to illustrate the diurnal temperature variation. The error bars on
5
the MIST data represent the minimum and maximum values of all MIST values within the 2 km range of the ISAR observations. During the first two days of the match-up period the coherency between MIST and OBSISAR data is particularly high, whereas
data from the last two days are slightly less correlated. This may coincide with optically thin atmospheric disturbances, as assessed from the less smooth ISAR data during
10
that period. STDE for the MISTRE CALdata for the period 1 to 2 April is 0.42◦C and bias
is 0.32◦C.
A day and a night MIST snapshot from Inglefield Bredning are shown in Fig. 3, where also the location of the ISAR instrument during field work is markedBC-1. The two MIST plots are separated by approximately 10 h on 3 April, showing the mid-day
situa-15
tion in the left panel and the evening situation in the right panel. A close look at the day situation reveal heating of the South oriented steep and rocky coastline and relatively homogeneous surface temperatures elsewhere in the fjord. The evening plot shows general cooling of the sea ice surface with strong cooling in certain areas. These in-homogeneous cooling effects are most likely caused by advection of cold air from the
20
glaciers.
The MUSUMMIT match-up data set is different from the 2 previously described data sets, in the sense that MIST data are matched with air temperatures from a high ele-vation site, at approximately 3200 m altitude.
In Fig. 5 STDE and bias values for the MUSUMMIT data set are plotted as monthly
25
mean values, showing a year round negative bias between approximately−2◦C and −5◦C, similar to bias values found for the MUARCTICdata, but with generally lower STDE
OSD
9, 1009–1043, 2012Arctic surface temperatures from
Metop AVHRR
G. Dybkjær et al.
Title Page
Abstract Introduction
Conclusions References
Tables Figures
◭ ◮
◭ ◮
Back Close
Full Screen / Esc
Printer-friendly Version Interactive Discussion
Discussion
P
a
per
|
Dis
cussion
P
a
per
|
Discussion
P
a
per
|
Discussio
n
P
a
per
|
a markedly improvement of MIST performance was found for quality filtered cloud-flag 11 data from the MUSUMMIT data set (Fig. 9), namely to STDE of 3.14◦C and a bias of
−3.22◦C (Table 3).
A comparison of the Summit air temperatures (OBSSUMMIT) with the correspond-ing NWP2MT values, reveals very large annual error of 5.71◦C (Table 4),
emphasiz-5
ing a need for additional ground truth to generate realistic model analysis fields. The NWP2MT-OBSSUMMITbias is small as expected, because the OBSSUMMITare one of the few 2 m temperature observations on the Greenland ice cap that is available for model data assimilation.
From the MUARCTIC data set we have also calculate the annual error statistics
10
between MIST and NWP data. The results are shown in table 4 showing MIST-NWPSURFACE/NWP2MT bias values, around -3.5◦C and STDE values of 3.92◦C and
3.49◦C, respectively. Also in table 4, we see that the biases between NWPSURFACE/2MT
-OBS are small, as the -OBSARCTIC data are the in situ surface temperature data used to build the NWP analysis fields.
15
6 Discussion
When comparing remotely sensed data with ground measurements it is assumed that the spatial and temporal characteristics of a given parameter are comparable, regard-less of the parameter is measured from space or on the ground. In this case, where a temperature estimate representing more than 1 km2 is compared to a point
measure-20
ment, it is assumed that the autocorrelation length of the surface temperature is larger than the satellite footprint, and similarly that the temporal autocorrelation of the surface temperature is longer than the MIST sampling frequency. Veihelmann et al. (2001) es-timated the standard deviation of the surface temperature inside a 4.5 km2area in the Weddell Sea to be approximately 0.5◦C. The corresponding value inside the double
25
OSD
9, 1009–1043, 2012Arctic surface temperatures from
Metop AVHRR
G. Dybkjær et al.
Title Page
Abstract Introduction
Conclusions References
Tables Figures
◭ ◮
◭ ◮
Back Close
Full Screen / Esc
Printer-friendly Version Interactive Discussion
Discussion
P
a
per
|
Dis
cussion
P
a
per
|
Discussion
P
a
per
|
Discussio
n
P
a
per
|
the maximum temporal temperature gradient to be approximately 0.9◦C h−1, during sun rise. The temporal and spatial sampling issues contribute to the overall MIST error, but they are assumed not to contribute to bias. Due to the relatively rigid match-up crite-ria used to generate the match-up data sets, the sampling errors are estimated to be around 1◦C for the MUARCTIC and MUSUMMIT data sets, and less for the MUISAR data
5
set, because of practically no time lag between MIST and OBSISARdata.
Spatial variance of snow and ice surface emissivity is another issue that contribute to IST estimation errors. In earlier works by Warren (1982) and Dozier and Warren (1982) emissivity variations caused by snow grain size and liquid water content were considered negligible, and only a slightly decreasing impact from increasing snow pack
10
density was identified. Emissivity may decrease approximately by 0.005 when the snow density increases from about 200 kg m−3 to 300 kg m−3 (Dozier and Warren, 1982). Dozier and Warren (1982) considered the view angle to be the most important vari-able for emissivity variations. In more recent works by Cheng (2010) and Salisbury et al. (1994) it is acknowledge that also increasing snow grain size have markedly
lower-15
ing effects on the snow emissivity for the TIR wavelength used here. At nadir a grain size increase from 300 to 550 microns can decrease the emissivity by approximately 0.005, thus adding another∼1◦C to uncertainty on an IST estimate. Distributed infor-mation of snow density and grain size on Arctic scale does not exist and empirical IST algorithms adapt to average snow properties. Associated errors are therefore
antici-20
pated; no biases from these errors are expected.
The MIST algorithm seems to account successfully for scan angle dependent emis-sivity. Figure 7 shows the contribution of the scan-angle term of the MIST algorithm as a function of scan-angle. The slightly quantified angular correction is caused by the dif-ferent calibration constants used for each of theT11regimes in which MIST is working.
25
The spread around the main lines is induced by the T11–T12 factor of the MIST
OSD
9, 1009–1043, 2012Arctic surface temperatures from
Metop AVHRR
G. Dybkjær et al.
Title Page
Abstract Introduction
Conclusions References
Tables Figures
◭ ◮
◭ ◮
Back Close
Full Screen / Esc
Printer-friendly Version Interactive Discussion
Discussion
P
a
per
|
Dis
cussion
P
a
per
|
Discussion
P
a
per
|
Discussio
n
P
a
per
|
for the 11 micron channel on ATSR (Stroeve et al., 1996). It is essential to mention that MIST errors are uncorrelated to scan-angle (not shown).
The two largest error contributors to satellite based IST estimates, emerge from er-roneous cloud detection and the in situ data errors. With respect to the latter, the radio-metric surface temperature can be significantly different from the thermodynamic
tem-5
perature measurements from drifters and ships. This difference is largest in cloud free conditions caused by long-wave radiative cooling, and maximum differences are mea-sured to range between 4 and 7◦C by Radinov (1997) and Veihelmann et al. (2001) and confirmed by model estimates by Tonboe et al. (2011). On average the surface is colder than the air (Maykut, 1986; Radinov, 1997). Hence, we expect a physically
10
induced negative MIST-OBSARCTIC/OBSSUMMITbias, but we do not have sufficient doc-umentation to quantify this. A quantification of the surface-air temperature difference is further complicated because the buoys do not necessarily measure the air temper-ature. A buoy thermometer can be buried in snow and thus measure internal snow temperature or a thermometer inside a buoy can be warmed up by radiative heating
15
from the sun on the buoy housing (Key and Haefliger, 1992).
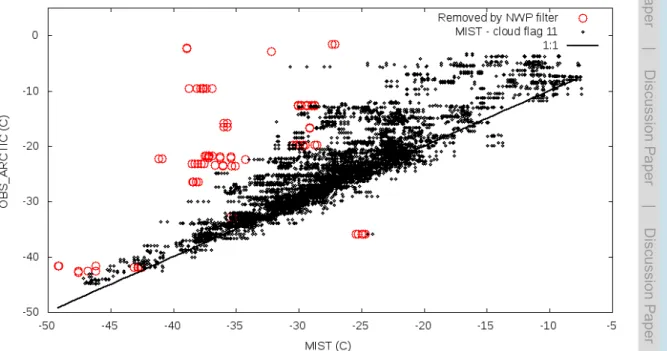
The presence of non detected clouds will contribute to increased STDE and will in general result in a cold MIST bias, because cloud tops and other atmospheric con-stituents in general are colder that surface and air temperatures. Figure 8 is a scatter plot of OBSARCTICdata versus MIST for cloud flag 11 data from the MUARCTIC data set.
20
The scatter of the data show a clear cold bias of MIST and a number of extreme out-liers probably from erroneously cold cloud contaminated MIST estimates. For very cold surface temperatures the scatter is small as these temperatures most likely are asso-ciated with clear skies where MIST is working well. The cold MIST bias for the extreme low temperatures is unambiguous and most likely reflecting real physical properties
25
and thus confirming the discussion of the negative long-wave surface energy balance. By imposing the NWP based quality filter to cloud-flag 11 data, from the MUARCTIC
OSD
9, 1009–1043, 2012Arctic surface temperatures from
Metop AVHRR
G. Dybkjær et al.
Title Page
Abstract Introduction
Conclusions References
Tables Figures
◭ ◮
◭ ◮
Back Close
Full Screen / Esc
Printer-friendly Version Interactive Discussion
Discussion
P
a
per
|
Dis
cussion
P
a
per
|
Discussion
P
a
per
|
Discussio
n
P
a
per
|
by red circles. The quality filter alone lowered the STDE value by 0.3◦C, and the rest of the error improvement is derived from the exclusion of cloud flag 14 data. The re-calibration of the cloud flag 11 data against OBSARCTIC data showed only negligible
improvements of STDE, indicating that the errors caused by calibration inaccuracy are small compared to other errors. A product similar to MIST, the MODIS 1 km IST
5
product, performs similarly with STDE of 3.7◦C and an associated bias of 2◦C (Hall et al., 2004b). This comparable performance indicates the level of quality that can be expected from fully automated satellite IST products.
Error statistics from the MUISAR data set is relevant in context of the error
discus-sion above. Despite the limited amount of data available for this analysis it reveals the
10
potential and limitations of surface temperature estimation from space-borne TIR ra-diometers. The MUISARdata are collected along with manual cloud screening, with no
time lag between satellite and in situ observation, snow and ice surface conditions are relatively homogeneous (see photo in Fig. 2) and both MIST and in situ observations are skin temperatures. Main errors are therefore assumed to originate from the spatial
15
sampling of MIST, to some extent also from varying snow properties and from a non optimal calibration. The STDE and bias of the MUISARdata-set is 1.02◦C and−1.81◦C,
respectively. The re-calibrated data, MISTRE CAL, clearly shows improved performance
with STDE of 0.73◦C (Table 3) and even as low as 0.42◦C for the 2 first days of the MUISAR data-set (see Fig. 6). This significant quality improvement obtained from the
20
re-calibration, suggests that the current MIST calibration is not optimal. However, sub-stantially more data points are needed in order to conclude on this point and thus, to carry out a new calibration. Similar improvement from the re-calibration of the MUARCTIC
data set was not found, implying that a proper re-calibration of the MIST algorithm must be based on visually cloud screened in situ surface temperature data.
25
OSD
9, 1009–1043, 2012Arctic surface temperatures from
Metop AVHRR
G. Dybkjær et al.
Title Page
Abstract Introduction
Conclusions References
Tables Figures
◭ ◮
◭ ◮
Back Close
Full Screen / Esc
Printer-friendly Version Interactive Discussion
Discussion
P
a
per
|
Dis
cussion
P
a
per
|
Discussion
P
a
per
|
Discussio
n
P
a
per
|
basically comes down to proper match-up routines and to high quality cloud masking procedures.
NWP models have problems reproducing realistic temperature variability in the anal-ysis fields for the Greenland ice cap as evident from the comparison to the Summit 2 m temperature measurements in Table 4. The reason is that vast areas of the ice cap
5
are represented by a poorly distributed observation network. Most operational synoptic stations on Greenland are located along the coastline several hundred kilometres from Summit. The objective of comparing MIST data to air temperature on the Greenland ice cap is therefore to examine the feasibility of using MIST data in model assimilation schemes for snow and ice covered Arctic land areas.
10
Unlike the conditions at sea level one can expect relative constant snow grain size distribution on the Greenland ice cap because of the persistent cold conditions and constant wind stress (Stroeve and Steffen, 1998). Furthermore, we also expect less interference with the atmosphere and clouds at Summit. These factors are assumed to contribute to smaller MIST errors on the ice cap than on the sea ice, and the less
15
pronounced cloud cover will also reduce bias. The errors of the MIST-OBSSUMMIT
com-parison confirmed this, with an annual STDE of 3.14◦C, but the bias of −3.22◦C is slightly higher than the of the MUARCTICdata (Table 3). A similar study of surface and air
temperatures at Summit, using a visual cloud screening procedure, showed an annual surface-air temperature bias of−1◦C (Hall et al., 2004a). The discrepancy between the
20
bias of−1◦C, observed by Hall et al. and the annual bias of this study, underline the significant impact of cloud screening.
Stammer et al. (2007) considered 4◦C to be the error threshold for model assimilation schemes to benefit from satellite based IST, as complementary temperatures to the traditional observation network. MIST is well below that threshold and clearly below
25
OSD
9, 1009–1043, 2012Arctic surface temperatures from
Metop AVHRR
G. Dybkjær et al.
Title Page
Abstract Introduction
Conclusions References
Tables Figures
◭ ◮
◭ ◮
Back Close
Full Screen / Esc
Printer-friendly Version Interactive Discussion
Discussion
P
a
per
|
Dis
cussion
P
a
per
|
Discussion
P
a
per
|
Discussio
n
P
a
per
|
7 Future works
Future development and operations of this product will be a split between MyOcean2 and the EUMETSAT’s Ocean and Sea Ice–SAF (OSISAF). MyOcean2 will operate the integrated MAST algorithm to a level 3 product for the Baltic Sea and the MAST set up for the Arctic will migrated to the OSISAF as an operational level 2 production. Further
5
development of MAST, including a future re-calibration, will be done in the OSISAF.
Acknowledgements. This work was co-funded by 2 EU frame programmes, the Damocles and
the MyOcean Projects (FP6 and FP7) and by the Danish Agency for Science, Technology and Innovation through the Greenland Climate and Research Centre. NWP data were provided by ECMWF and Ice concentration data from the OSISAF, EUMETSAT. We are grateful to all
10
contributors to this work and special thanks to Werenfried Wimmer (National Oceanography Centre, Southampton), who operated the ISAR instrument during the Qaanaaq field experiment and shared the data with us.
References
Bitz, C., and Lipscomb, W. An energy-conserving thermodynamic model of sea ice, J. Geophys.
15
Res.-Oceans, 104, 15669–15677, 1999.
Bj ¨ork, G., and S ¨oderkvist, J. Dependence of the Arctic Ocean ice thickness distribu-tion on poleward energy flux in the atmosphere, J. Geophys. Res.-Oceans, 107, 3173, doi:10.1029/2000JC000723, 2002.
Cheng, J., Liang, S., Weng, F., Wang, J., and Li, X. Comparison of Radiative Transfer Models for
20
Simulating Snow Surface Thermal Infrared Emissivity. IEEE J. Sel. Top. Appl., 3, 323–335, 2010.
Donlon, C., Robinson, I. S., Reynolds, M., Wimmer, W., Fisher, G., Edwards, R., and Nightin-gale, T. J.: An infrared sea surface temperature autonomous radiometer (ISAR) for deploy-ment aboard volunteer observing ships (vos),: An infrared sea surface temperature
au-25
OSD
9, 1009–1043, 2012Arctic surface temperatures from
Metop AVHRR
G. Dybkjær et al.
Title Page
Abstract Introduction
Conclusions References
Tables Figures
◭ ◮
◭ ◮
Back Close
Full Screen / Esc
Printer-friendly Version Interactive Discussion
Discussion
P
a
per
|
Dis
cussion
P
a
per
|
Discussion
P
a
per
|
Discussio
n
P
a
per
|
Dozier, J. and Warren, S. G. Effect of Viewing Angle on the Infrared Brightness Temperature of Snow. Water Resour. Res., 18, 5, 1424–1434, 1982.
Dybkjær, G., Høyer, J., Tonboe, R., Olsen, S., Rodwell, S., Wimmer, W., and Søbjærg, S.: QASITEEX 2011 – The Qaanaaq sea ice thermal emission experiment Field report. Danish Meteorological Institute, Technical Report, tr11-18, http://www.dmi.dk/dmi/tr11-18.pdf, 2011.
5
ECMWFdoc: http://www.ecmwf.int/products/data/technical/model id/index.html, last access: 12 March 2012, 2012.
Fichefet, T. and Maqueda, M. A. M.: Sensitivity of a global sea ice model to the treatment of ice thermodynamics and dynamics, J. Geophys. Res.-Oceans, 102, 12609–12646, 1997. Fowler C., Maslanik, J., Emery, W., Haran, T., Scambos, T., and Key, J.: Polar Pathfinder
EASE-10
grid Composites, http://nsidc.org/data/docs/daac/nsidc0066 avhrr 5km.gd.html, last access: 12 March 2012, 2012.
GTS: http://www.wmo.int/pages/prog/www/TEM/GTS/index en.html, 1 January 2012.
Hall, D. K., Williams, R. S., Steffen, K., and Chien, J. Y. L.: Analysis of Summer 2002 Melt Extent on the Greenland Ice Sheet using MODIS and SSM/I Data, IEEE, 0-7803-8742-2/04,
15
2004a.
Hall, D. K., Key, J. R., Casey, K. A., Riggs, G. A., and Cavalieri, D. J.: Sea Ice Surface Temper-ature Product from MODIS. IEEE T. Geosci. Remote, 42, 1076–1087, 2004b.
Høyer, J. L., Karagali, I., Dybkjær, G., and Tonboe, R.: Multi sensor validation and error char-acteristics of Arctic satellite sea surface temperature observations. Remote Sens. Environ.,
20
doi:10.1016/j.rse.2012.01.013, 2012.
Hwang, J. H. and Barber, D. G.: On the Impact of Ice Emissivity on Sea Ice Temperature Retrieval Using Passive Microwave Radiance Data, IEEE T. Geosci. Remote Lett., 5, 448– 452, 2008.
Key, J., and Haefliger, M.: Arctic Ice Surface Temperature Retrieval from AVHRR Thermal
Chan-25
nels, J. Geophys. Res.-Atmos., 97, 5885–5893, 1992.
Key, J. R., Collins, J. B., Fowler, C., and Stone, R. S.: High-Latitude Surface Temperature Esti-mates from Thermal Satellite Data, Remote Sens. Environ., 61, 302–309, 1997.
Le Borgne, P.: Determination/validation of Metop/AVHRR algorithms for the Arctic, Working paper, Meteo France, Lannion, 2010.
30
OSD
9, 1009–1043, 2012Arctic surface temperatures from
Metop AVHRR
G. Dybkjær et al.
Title Page
Abstract Introduction
Conclusions References
Tables Figures
◭ ◮
◭ ◮
Back Close
Full Screen / Esc
Printer-friendly Version Interactive Discussion
Discussion
P
a
per
|
Dis
cussion
P
a
per
|
Discussion
P
a
per
|
Discussio
n
P
a
per
|
MyOcean doc. MyOcean interactive data catalog, http://www.myocean.eu/web/24-catalogue. php, 2011.
MyOcean data. MyOcean SIWTAC data repository, http://thredds.met.no/thredds/catalog/ myocean/siw-tac/siw-dmi-temp-arc/catalog.html, 2011.
OSISAF: Ocean and Sea Ice, Satellite Application Facility. http://www.osi-saf.org and http://
5
osisaf.met.no, 2011.
Radionov, V. F., Bryazgin, N. N., and Alexandrov, E. I.: The Arctic Snow Cover of the Arctic Basin. Arctic and Antarctic Research Institure, Russia. Translation from Department of Sci-ence, University of Washington, Technical Report APL-UW TR 9701, 1997.
Salisbury, J. W., D’Aria, D. M., and Wald, A.: Measurements of thermal infrared spectral
re-10
flectance of frost, snow, and ice, J. Geophys. Res., 99, 24235-24240, 1994.
Scambos, T. A., Haran, T. M., and Massom, R.: Validation of AVHRR and MODIS ice surface temperature products using in situ radiometers. ANN GLACIOL, 44, 345-351, 2006.
Stammer, D., Johanessen, J., LeTraon, P.-Y., Minnett, P., Roquet, H., and Srokosz, M.: Require-ments for Ocean Observations Relevant to post-EPS . EUMETSAT Position Paper: AEG
15
Ocean Topography and Ocean Imaging, 10 January 2007, Version 3, 2007.
Steffen, K., Abdalati, W., and Stroeve, J.: Climate sensitivity studies of the Greenland ice sheet using satellite AVHRR, SSMR, SSM/I, and in situ data, Meteorol. Atmos. Phys., 51, 239–258, 1993.
Stroeve, J., Haefliger, M., and Steffen, K.: Surface Temperature from ERS-1 ATSR Infrared
20
Thermal Satellite Data in Polar Regions, J. Appl. Meteorol., 35, 1231–1239, 1996.
Stroeve, J. and Steffen, K.: Variability of AVHRR-Derived Clear-Sky Surface Temperature over the Greenland Ice Sheet, J. Appl. Meteorol., 37, 23–31, 1998.
Stroeve, J. C., Box, J. E., Fowler, C., Haran, T., and Key, J.: Intercomparison Between in Situ and AVHRR Polar Pathfinder-derived Surface Albedo Over Greenland. Remote Sens. Environ.,
25
75, 360–374, 1998.
Thoss, A.: Algorithm Theoretical Basis Document for SAFNWC/PPS Cloud Mask. Nowcasting and very short range forecasting, Satellite Application Facility, EUMETCAST, SAF-NWC-CDOP-SMHI-PPS-SCI-ATBD-1 v2 2 1.doc, 2009.
Tonboe, R. T., Dybkjær, G., and Høyer, J. L.: Simulations of the snow covered sea ice surface
30
and microwave effective temperature, Tellus, 63A, 1028–1037, 2011.
OSD
9, 1009–1043, 2012Arctic surface temperatures from
Metop AVHRR
G. Dybkjær et al.
Title Page
Abstract Introduction
Conclusions References
Tables Figures
◭ ◮
◭ ◮
Back Close
Full Screen / Esc
Printer-friendly Version Interactive Discussion
Discussion
P
a
per
|
Dis
cussion
P
a
per
|
Discussion
P
a
per
|
Discussio
n
P
a
per
|
27, 2001.
Vincent, R. F., Marsden, R. F., Minnett, P. J., Creber, K. A. M., and Buckley, J. R.: Arctic waters and marginal ice zones: A composite Arctic sea surface temperature algorithm using satellite thermal data, J. Geophys. Res.-Oceans., 113, C04021, doi:10.1029/2007JC004353, 2008. Warren, S. G.: Optical properties of Snow. Rev Geophys. Space. Ge., 20, 67–89, 1982.
OSD
9, 1009–1043, 2012Arctic surface temperatures from
Metop AVHRR
G. Dybkjær et al.
Title Page
Abstract Introduction
Conclusions References
Tables Figures
◭ ◮
◭ ◮
Back Close
Full Screen / Esc
Printer-friendly Version Interactive Discussion
Discussion
P
a
per
|
Dis
cussion
P
a
per
|
Discussion
P
a
per
|
Discussio
n
P
a
per
|
Table 1.Description of acronyms and abbreviations for data and data sets.
Data acronym’s and abbreviations
MIST The Meteosat AVHRR Ice-Surface Temperature data.
MISTRE CAL Re-calibration of MIST the OBSISARin situ data
MUARCTIC Arctic ocean match up data set for MIST and OBSARCTICdata
MUISAR Field work match up data set for MIST and OBSISARdata
MUSUMMIT Summit match up data set for MIST and OBSSUMMITdata
OBS Either or all of the 3 applied observation data sets
OBSARCTIC In situ temperature data from ships and buoys collected via GTS data
transmission system
OBSSUMMIT In situ temperature data from synop station 04416 (Greenland
Sum-mit) collected via GTS data transmission system
OBSISAR In situ temperature data from portable thermal-infrared radiometer NWP Numerical Weather Prediction – general term
NWPSURFACE NWP Ice surface temperature from current global deterministic
model at ECMWF
OSD
9, 1009–1043, 2012Arctic surface temperatures from
Metop AVHRR
G. Dybkjær et al.
Title Page
Abstract Introduction
Conclusions References
Tables Figures
◭ ◮
◭ ◮
Back Close
Full Screen / Esc
Printer-friendly Version Interactive Discussion
Discussion
P
a
per
|
Dis
cussion
P
a
per
|
Discussion
P
a
per
|
Discussio
n
P
a
per
|
Table 2.Preliminary MIST error statistics for the complete MUARCTIC, MUISAR and MUSUMMIT data sets.
Initial quality STDE (C) Bias (C) R Counts
MIST-OBSARCTIC 4.29 −3.43 0.91 21 251
MIST-OBSISAR 1.02 −1.81 0.77 28
OSD
9, 1009–1043, 2012Arctic surface temperatures from
Metop AVHRR
G. Dybkjær et al.
Title Page
Abstract Introduction
Conclusions References
Tables Figures
◭ ◮
◭ ◮
Back Close
Full Screen / Esc
Printer-friendly Version Interactive Discussion
Discussion
P
a
per
|
Dis
cussion
P
a
per
|
Discussion
P
a
per
|
Discussio
n
P
a
per
|
Table 3.Best quality MIST error statistics. The NWP based quality filter is applied to cloud flag 11 data of the MUARCTICand MUSUMMIT data sets (see Figs. 8 and 9), and the MUISARdata set is re-calibrated.
Best quality STDE (C) Bias (C) R Counts
MIST-OBSARCTIC 3.69 −2.76 0.89 7809
MISTRE CAL-OBSISAR 0.73 0 0.78 28
OSD
9, 1009–1043, 2012Arctic surface temperatures from
Metop AVHRR
G. Dybkjær et al.
Title Page
Abstract Introduction
Conclusions References
Tables Figures
◭ ◮
◭ ◮
Back Close
Full Screen / Esc
Printer-friendly Version Interactive Discussion
Discussion
P
a
per
|
Dis
cussion
P
a
per
|
Discussion
P
a
per
|
Discussio
n
P
a
per
|
Table 4.Error statistics for MIST and OBS comparison with NWP data. The MIST statistics is based on cloud mask flag 11 data from the MUARCTICdata set.
STDE (C) Bias (C) R
MIST-NWPSURFACE 3.92 −3.50 0.81
MIST-NWP2MT 3.49 −3.43 0.85
NWPSURFACE-OBSARCTIC 4.58 0.60 0.86
NWP2MT-OBSARCTIC 3.55 0.53 0.92
OSD
9, 1009–1043, 2012Arctic surface temperatures from
Metop AVHRR
G. Dybkjær et al.
Title Page
Abstract Introduction
Conclusions References
Tables Figures
◭ ◮
◭ ◮
Back Close
Full Screen / Esc
Printer-friendly Version Interactive Discussion
Discussion
P
a
per
|
Dis
cussion
P
a
per
|
Discussion
P
a
per
|
Discussio
n
P
a
per
|
OSD
9, 1009–1043, 2012Arctic surface temperatures from
Metop AVHRR
G. Dybkjær et al.
Title Page Abstract Introduction Conclusions References Tables Figures ◭ ◮ ◭ ◮ Back Close
Full Screen / Esc
Printer-friendly Version Interactive Discussion Discussion P a per | Dis cussion P a per | Discussion P a per | Discussio n P a per | 160˚W 140˚W 120˚W 100˚W 80˚W 60˚W 40˚W 20˚W 0˚ 20˚E 40˚E 60˚E 80˚E 100˚E 120˚E 140˚E 160˚E 160˚W 140˚W 120˚W 100˚W 80˚W 60˚W 40˚W 20˚W 0˚ 20˚E 40˚E 60˚E 80˚E 100˚E 120˚E 140˚E 160˚E 180˚ 160˚W 140˚W 120˚W 100˚W 80˚W 60˚W 40˚W 20˚W 0˚ 20˚E 40˚E 60˚E 80˚E 100˚E 120˚E 140˚E 160˚E 180˚ 160˚W 140˚W 120˚W 100˚W 80˚W 60˚W 40˚W 20˚W 0˚ 20˚E 40˚E 60˚E 80˚E 100˚E 120˚E 140˚E 160˚E
−50 −45 −40 −35 −30 −25 −20 −15 −10 −5 0 5 10
oC
−50 −45 −40 −35 −30 −25 −20 −15 −10 −5 0 5 10
oC
OSD
9, 1009–1043, 2012Arctic surface temperatures from
Metop AVHRR
G. Dybkjær et al.
Title Page
Abstract Introduction
Conclusions References
Tables Figures
◭ ◮
◭ ◮
Back Close
Full Screen / Esc
Printer-friendly Version Interactive Discussion
Discussion
P
a
per
|
Dis
cussion
P
a
per
|
Discussion
P
a
per
|
Discussio
n
P
a
per
|
OSD
9, 1009–1043, 2012Arctic surface temperatures from
Metop AVHRR
G. Dybkjær et al.
Title Page
Abstract Introduction
Conclusions References
Tables Figures
◭ ◮
◭ ◮
Back Close
Full Screen / Esc
Printer-friendly Version Interactive Discussion
Discussion
P
a
per
|
Dis
cussion
P
a
per
|
Discussion
P
a
per
|
Discussio
n
P
a
per
|