Submitted26 August 2015 Accepted 16 February 2016 Published15 March 2016 Corresponding author
Brian Piper, [email protected], [email protected]
Academic editor Nicholas Badcock
Additional Information and Declarations can be found on page 17
DOI10.7717/peerj.1772 Copyright
2016 Piper et al.
Distributed under
Creative Commons CC-BY 4.0
OPEN ACCESS
Evaluation of the validity of the
Psychology Experiment Building
Language tests of vigilance, auditory
memory, and decision making
Brian Piper1,2,3, Shane T. Mueller4, Sara Talebzadeh5and Min Jung Ki3
1Neuroscience Program, Bowdoin College, Brunswick, ME, United States 2Department of Psychology, Willamette University, Salem, OR, United States 3School of Pharmacy, Husson University, Bangor, ME, United States
4Cognitive and Learning Sciences, Michigan Technological University, Houghton, MI, United States 5Department of Biology, Husson University, Bangor, ME, United States
ABSTRACT
Background. The Psychology Experimental Building Language (PEBL) test battery (http://pebl.sourceforge.net/) is a popular application for neurobehavioral investiga-tions. This study evaluated the correspondence between the PEBL and the non-PEBL versions of four executive function tests.
Methods. In one cohort, young-adults (N =44) completed both the Conner’s
Continuous Performance Test (CCPT) and the PEBL CPT (PCPT) with the order counter-balanced. In a second cohort, participants (N =47) completed a non-computerized (Wechsler) and a non-computerized (PEBL) Digit Span (WDS orPDS) both Forward and Backward. Participants also completed the Psychological Assessment Resources or the PEBL versions of the Iowa Gambling Task (PARIGT orPEBLIGT).
Results. The between-test correlations were moderately high (reaction timer=0.78, omission errorsr=0.65, commission errorsr=0.66) on the CPT. DS Forward was significantly greater than DS Backward on theWDS (p< .0005) and thePDS (p< .0005). The totalWDS score was moderately correlated with thePDS (r=0.56). ThePARIGT and the PEBLIGTs showed a very similar pattern for response times across blocks, development of preference for Advantageous over Disadvantageous Decks, and Deck selections. However, the amount of money earned (score–loan) was significantly higher in thePEBLIGT during the last Block.
Conclusions. These findings are broadly supportive of the criterion validity of the PEBL measures of sustained attention, short-term memory, and decision making. Select differences between workalike versions of the same test highlight how detailed aspects of implementation may have more important consequences for computerized testing than has been previously acknowledged.
SubjectsPsychiatry and Psychology, Human-Computer Interaction
Keywords Attention, Decision making, Iowa Gambling Task, Short-term memory
INTRODUCTION
Language (PEBL) test battery (Mueller, 2015;Mueller & Piper, 2014;Piper et al., 2015a) was downloaded more than 21,000 times in 2015 and use continues to increase (Fox et al., 2013;Lipnicki et al., 2009a;Lipnicki et al., 2009b;Piper, 2010). The PEBL tests have been employed in studies of traumatic brain injury (Danckert et al., 2012), behavioral pharmacology (Aggarwal et al., 2011;Lyvers & Tobias-Webb, 2010), aging (Clark & Kar, 2011;Piper et al., 2012), Parkinson’s disease (Peterson et al., 2015) and behavioral genetics (Wardle et al., 2013;González-Giraldo et al., 2014) by investigators in developed and developing countries, and the tests have been administered in many languages. A key step in PEBL battery development is to evaluate criterion validity (i.e., the extent to which its dependent measures predict other existing measures) by determining whether performance on PEBL tests is similar to the established versions of the tests. Although the PEBL tests were developed based on the methods sections of the peer reviewed literature, this direct comparison is important because some potentially important procedural details may have been omitted, described ambiguously, or misinterpreted.
Four tests were selected for the present report for comparison between the PEBL and non-PEBL (i.e., established) versions: the Continuous Performance Test (CPT), Digit Span Forward (DS-F), DS Backward (DS-B), and the Iowa Gambling Task (IGT). These tests were chosen because they assess theoretically important constructs (vigilance, attentional capacity, short-term memory, and decision making), have an extensive history, and their neural substrates have been examined in lesion and neuroimaging studies. Each of these measures is described in more detail below.
Continuous Performance Test (CPT)
CPTs have an extensive history and exist in multiple forms (Mackworth, 1948;Rosvold et al., 1956;Anderson et al., 1969;Earle-Boyer et al., 1991;Greenberg & Waldman, 1993;
addition, the neural substrates of vigilance have been characterized and involve a network that includes the prefrontal, frontal, and parietal cortex and the striatum (Ogg et al., 2008;
Riccio et al., 2002).
Digit Span Forward and Backward (DS-F and DS-B)
DS type tests are found in the Wechsler assessments as well as in other neuropsychological batteries. A string of numbers is presented (e.g., 7, 1, 6 at a rate of one digit per second) and the participant either repeats them in the same (DS-F) or the reverse (DS-B) sequence. Although DS-F and DS-B are procedurally similar, and they are sometimes both viewed as simple short-term memory tasks (St Clair-Thompson & Allen, 2013), the former is sometimes treated as a measure of ‘‘pure storage’’ whereas the latter is viewed as involving more executive control and thus considered a ‘‘working memory’’ task (Lezak et al., 2012). DS-B induces greater activity in the prefrontal cortex than DS-F (Keneko et al., 2011).
Previously, a direct comparison of DS by mode of administration revealed lower DS Forward and Backward when completed over the telephone with voice recognition as compared to in-person administration (Miller et al., 2013). However, a moderate correla-tion (r=.53) in DS total was identified with traditional and computerized administration (Paul et al., 2005).
Iowa Gambling Test (IGT)
Bechara and colleagues at the University of Iowa College of Medicine developed a novel task to quantify abnormalities in decision making abilities. Originally, what became known as the Iowa Gambling Task (IGT) involved selecting cards from four physical decks of cards. Each deck had a different probability of wins versus losses. Two decks are Disadvantageous and two are Advantageous, because some deck selections will lead to losses over the long run, and others will lead to gains. Neurologically intact participants were reported to make the majority (70%) of one-hundred selections from the Advantageous (C & D) decks. In contrast, patients with lesions of the prefrontal cortex showed the reverse pattern with a strong preference for the Disadvantageous (A & B) decks (Bechara et al., 1994, although see Buelow & Suhr, 2009;Steingroever et al., 2013). However, another research team, employing a gambling task that they programmed, determined that college-aged adults showed a response pattern that is very similar to patients with frontal lesions (Caroselli et al., 2006). Similarly, the median response among a moderate-sized sample (N =39) of college students from the southwestern United States was to make more selections from Disadvantageous than Advantageous Decks on the Psychological Assessment Resources (PAR) version of the IGT (Piper et al., 2015b). IGT type tasks have become increasingly popular for research purposes to examine individual differences in decision making including in pathological gamblers, substance abusers, ADHD, and in other neurobehavioral disorders (Buelow & Suhr, 2009;Verdejo-Garcia et al., 2007). One key characteristic of the IGT is that there is substantial carryover of learning with repeated administrations in normal participants (Bechara, Damasio & Damasio, 2000;Bull, Tippett & Addis, 2015; Fernie & Tumney, 2006;Piper et al., 2015a; Verdejo-Garcia et al., 2007).
The IGT is also one of the more widely employed tests in the PEBL battery (Bull, Tippett & Addis, 2015;Hawthorne, Weatherford & Tochkov, 2011;Lipnicki et al., 2009a;Lipnicki et al., 2009b;Mueller & Piper, 2014) and so itself has been used in many different contexts. Many variations on IGT procedures have been developed over the past two decades. ThePEBLIGT employs consistent rewards and punishment (e.g.,−$1,250 for each selection from Deck B) as described by Bechara et al., (1994). ThePARIGT utilizes the ascending schedule of rewards and punishments (e.g.,−$1,250 for early deck selections and decreasing by $250
increments) (Bechara, Tranel & Damasio, 2000).
The primary objective of this report was to determine the similarity between the PEBL and non-PEBL versions of these executive function measures. A common strategy to test development would be to administer both the PEBL and non-PEBL versions to tests to participants with the order counter-balanced. Interestingly, a prior study administered the PEBL digit span forward, a continuous performance test with some procedural similarities to the CPT, and the IGT to young-adults twice with a two-week inter-test interval and identified moderate to high test-retest correlations on measures of attention (Spearman rho=.69–.72) and digit-span (rho=.62) while the total money earned on the IGT was
less consistent (rho=.22) (Piper et al., 2015a). These findings suggest that the approach of administering both PEBL and non-PEBL versions and examining correlations across platforms might be viable for DS and the CPT but not the IGT. The IGT dataset was also used to critically examine the sensitivity of the IGT to identify clinically meaningful individual differences in decision making abilities. The commercial distributors of an IGT purport that neurologically intact and those that have suffered a brain insult should score quite differently. If ‘‘normal’’ college students completing the IGT showed a pattern of responding that would be labeled impaired (as has been shown earlier; cf. Caroselli et al., 2006;Piper et al., 2015b), these findings would challenge the construct validity of this measure. Consequently, participants in this study completed PEBL and/or non-PEBL versions of the same tests. Correlations across platforms were determined for the CPT and DS and the pattern of responses were evaluated for each IGT. Where applicable, intra-test correlations were also examined as this is one criteria used to evaluate test equivalence (Bartram, 1994).
MATERIALS & METHODS
Participants
The participants (N =44; Age = 18–24, Mean=18.7 ±0.2; 68.2% female; 23.9% non-white; 7.3% ADHD) were college students receiving course credit in the CPT study. A separate cohort (N=47; Age=18–34, Mean=18.8±0.3; 59.6% female; 14.9% non-white; 10.6% ADHD) of college students completed the DS/IGT study and also received course credit.
Procedures
informed consent and a short demographic form which included items about sex, age, and whether they had been diagnosed by a medical professional with ADHD. Next, the first cohort completed either thePCPT or Version II of theCCPT, including the two-minute practice trial, with the order counter-balanced on desktop computers running Windows XP and not connected to the internet. As data collection for each CPT takes 14 min and is intentionally monotonous, the PEBL Tower of London (Piper et al., 2012) was completed between each CPT as a brief (≈5 min) distractor task. ThePCPT was modified from the default in PEBL version 0.11 such that a mid-test break was removed and the instructions were analogous to theCCPT. The instructions of thePCPT were:
You are about to take part in an experiment that involves paying attention to letters on a screen. It will take about 14 min. You will see letters presented on a screen quickly. Your goal is to press the spacebar as fast as possible after each letter, except if the letter is an ‘X’. DO NOT RESPOND to X stimuli.
A total of 324 target letters (A, B, C, D, E, F, G, H, I, J, K, L, M, O, P, Q, R, S, U) and 36 foils (X) were presented with an inter-stimulus interval of 1, 2, or 4 s. The primary dependent measures were the RT on correct trials in ms, the standard deviation (SD) of RT, omission and commission errors. ThePCPT source code is also at:
https://github.com/stmueller/pebl-custom.
The second cohort completed a short demographic form (described above) followed by the PEBL and non-PEBL tasks (DS-F, DS-B, and IGT) with the order counterbalanced across testing sessions. PEBL, version 0.14, was installed on Dell laptops (Latitude E6410 and 6420) running Windows 7. Both laptops were connected to Dell touchscreen monitors (20’’ model number 0MFT4K) which were used for selecting responses on the IGT.
The Wechsler DS (WDS) consists of two trials for each number of items each read aloud by the experimenter at a rate of one per second beginning with two items. Discontinuation occurred when both trials for a single number of items were answered incorrectly. The maximum total score for DS Forward and Backward is sixteen and fourteen, respectively. The PEBL Digit Span (PDS) source code was modified slightly from the default version so that stimuli were presented via headphones (one per 1,000 ms) but not visually (PEBL script available at:https://github.com/stmueller/pebl-custom) in order to be more similar to theWDS. Two trials were completed for each number of items starting with three items. Digit stimuli were generated randomly such that each sequence contained no more than one of each digit. Discontinuation occurred when both trials for a single number of items were answered incorrectly. An important methodological difference between theWDS and thePDS involves how responses are collected. The traditionalWDS involves oral responses coded by the experimenter. The PDS involves typed input with the response sequence visible on-screen as it is made. Furthermore, blank entries are permitted and participants have the ability to delete erroneous responses (seeSupplemental Informationfor the source code and task instructions).
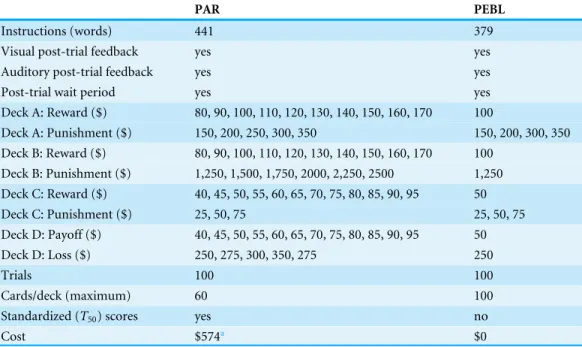
Table 1 A comparison of the Bechara IGT distributed by Psychological Assessment Resources (PAR) and the Mueller and Bull IGT distributed with version 0.14 of the Psychology Experiment Building Language (PEBL).
PAR PEBL
Instructions (words) 441 379
Visual post-trial feedback yes yes
Auditory post-trial feedback yes yes
Post-trial wait period yes yes
Deck A: Reward ($) 80, 90, 100, 110, 120, 130, 140, 150, 160, 170 100
Deck A: Punishment ($) 150, 200, 250, 300, 350 150, 200, 300, 350
Deck B: Reward ($) 80, 90, 100, 110, 120, 130, 140, 150, 160, 170 100
Deck B: Punishment ($) 1,250, 1,500, 1,750, 2000, 2,250, 2500 1,250
Deck C: Reward ($) 40, 45, 50, 55, 60, 65, 70, 75, 80, 85, 90, 95 50
Deck C: Punishment ($) 25, 50, 75 25, 50, 75
Deck D: Payoff ($) 40, 45, 50, 55, 60, 65, 70, 75, 80, 85, 90, 95 50
Deck D: Loss ($) 250, 275, 300, 350, 275 250
Trials 100 100
Cards/deck (maximum) 60 100
Standardized (T50) scores yes no
Cost $574a $0
Notes.
aPrice in U.S.D. on 3/5/2016.
were used. ThePEBLIGT was also administered with the order counterbalanced. Because others have identified pronounced practice effects with the IGT (Bechara, Damasio & Damasio, 2000;Bull, Tippett & Addis, 2015;Birkett et al., 2015; Fontaine et al., 2015;
Verdejo-Garcia et al., 2007) and we found that the amount earned increase by 106.3% on the second administration (Piper et al., 2015a), only data from the IGT administered first was examined. ThePEBLIGT has modifications contributed by P. N. Bull (Supplemental Information at:https://github.com/stmueller/pebl-custom) and is a more refined version of the task than has been used previously (Hawthorne, Weatherford & Tochkov, 2011;
Lipnicki et al., 2009a;Lipnicki et al., 2009b;Piper et al., 2015b). If scores go below zero, participants will receive a second $2,000 loan. Importantly, thePEBLIGT is based on the procedures described inBechara et al. (1994)while thePARIGT is based on those described in great detail inBechara, Tranel & Damasio (2000). The instructions are 14% shorter on thePEBLIGT but perhaps the largest procedural difference is the negative consequences of Disadvantageous Decks are amplified in thePARIGT (Table 1).
Statistical analyses
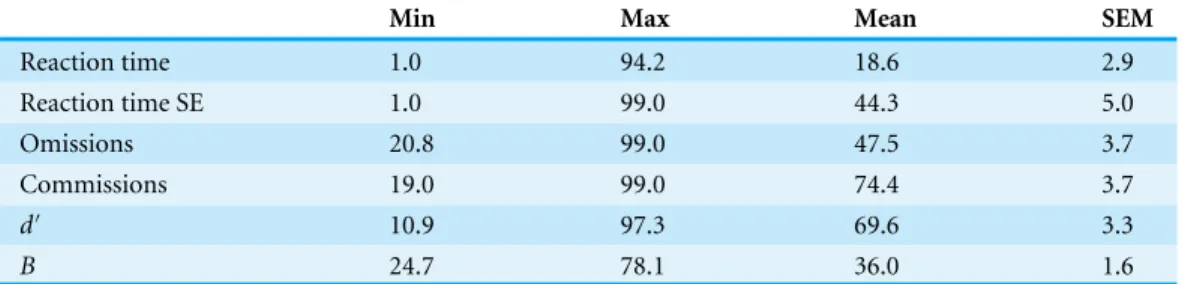
Table 2 Age and sex corrected percentiles of the participants (N=44) on the Conner’s Continuous
Performance Test.
Min Max Mean SEM
Reaction time 1.0 94.2 18.6 2.9
Reaction time SE 1.0 99.0 44.3 5.0
Omissions 20.8 99.0 47.5 3.7
Commissions 19.0 99.0 74.4 3.7
d′ 10.9 97.3 69.6 3.3
B 24.7 78.1 36.0 1.6
Notes.
SE, standard error.
participant time limitations, data from the second IGT was not examined and analyses instead focused on determining the response patterns within the first test and whether they were similar across platforms. The standardized (age and sex corrected) scores (percentiles) of the sample were reported for theCCPT andPARIGT. ThePCPT output text files were imported into Excel and all analyses were subsequently conducted using Systat, version 13.0. The distribution on some measures (e.g., RT), were, as anticipated, non-normal, therefore both Pearson (rP) and Spearman rho (rS) correlation coefficients
were completed as was done previously (Piper et al., 2015a). As thePCPT default settings express the variability in RT slightly differently (SD) than the cCPT (SE), the PEBL output was converted to the SE according to the formula SD/(N−1)0.5
where N is the total number of correct trials across the three inter-trial intervals. Differences in intra-test correlations (e.g., omission by commission errors) between thePCPT andCCPT were evaluated with a Fisher r to Z transformation (http://vassarstats.net/rdiff.html). The 95% Confidence Interval (CI) of select Pearson correlations was determined (http://vassarstats.net/rho.html) and the effect size of group differences was expressed in terms of Cohen’sd(http://www.cognitiveflexibility.org/effectsize/) with 0.2, 0.5, and 0.8 interpreted as small, medium, and large. As theWDS starts at an easier level (2 digits) than thePDS (3 digits), two additional points were added to each (Forward and Backward)PDS for comparison purposes. The primary dependent measure on the IGT was Deck selections but Response Times on each Block of twenty-trials and the compensation (score minus loan) for each trial was also documented. The NET was calculated as Advantageous minus Disadvantageous Deck selections. Mean data are presented with the standard error of the mean (SEM) and p< .05 considered statistically significant although statistics that met more conservative alpha levels (e.g., .0005) are noted.
RESULTS
Continuous Performance Test (CPT)
Substantial individual differences in sustained attention were observed in this sample. The percentiles (±SEM) for eachCCPT measure are shown inTable 2.
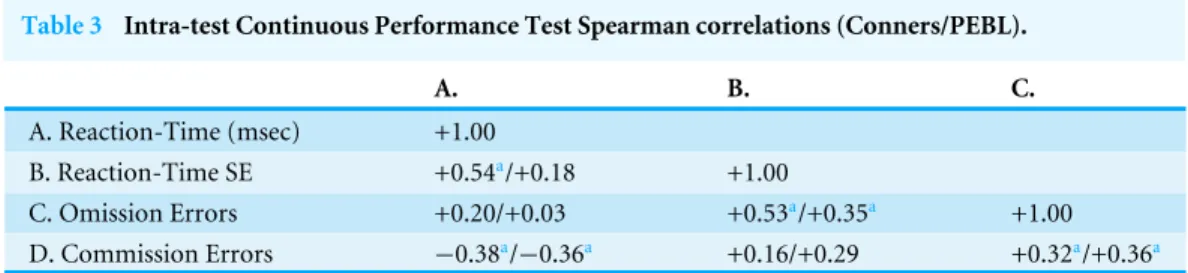
Table 3 Intra-test Continuous Performance Test Spearman correlations (Conners/PEBL).
A. B. C.
A. Reaction-Time (msec) +1.00
B. Reaction-Time SE +0.54a/+0.18 +1.00
C. Omission Errors +0.20/+0.03 +0.53a/+0.35a +1.00
D. Commission Errors −0.38a/−0.36a +0.16/+0.29 +0.32a/+0.36a
Notes.
ap< .05.
Kurtosis = 0.30, t(43)=2.91,p< .01,d=.48). The difference in the SE of RT was clearly different (CCPT=5.3 ± 0.4, Kurtosis=6.22,PCPT=3.3 ± 0.5, Kurtosis= 37.86, t(43)=5.60,p< .0005,d=.87) but there was no difference for omission errors (CCPT=2.6 ± 0.6, Kurtosis=6.41,PCPT=2.3 ± 0.7, Kurtosis=26.00,t(43)=0.51,
p=.61) or commission errors (CCPT=18.1 ± 1.1,PCPT=17.3 ± 1.0,t(43)=0.96,
p=.34).
The inter-test correlations were generally satisfactory. The correlation was excellent for reaction time (rP(42)= +.78, 95% CI [.63–.87];rS(42)= +.80,p< .0005,Fig. 1A). The cross-platform association for reaction time variability was also moderate (rP(42)=
+.66,p< .01, 95% CI [.46–.80];rS(42)= +.27,p=.076) but this association should be viewed with caution as removal of one extreme score (15.9, Grub’s test=4.18,p< .01; 23.3, Grubs test =6.26, p< .01) reduced this correlation considerably (rP(41)= +.20, 95% CI [−.11–+.47], p=.19;Figure S1). Omission errors (rP(42)= +.65, 95% CI [.44–.79], p< .0005, rS(42)= +.31,p< .05) and commission errors (rP(42)= +.66, 95% CI [.45–.80], rS(42)= +.66,p< .0005) showed good correlations across tests (Figs. 1Band1C).
An analysis of the intra-test Spearman correlations among the variables of each test was also conducted (Table 3). Several significant correlations were identified. However, with the exception of a trend for the RT SE (p=.055), the correlations did not differ across tests.
Digit Span (DS)
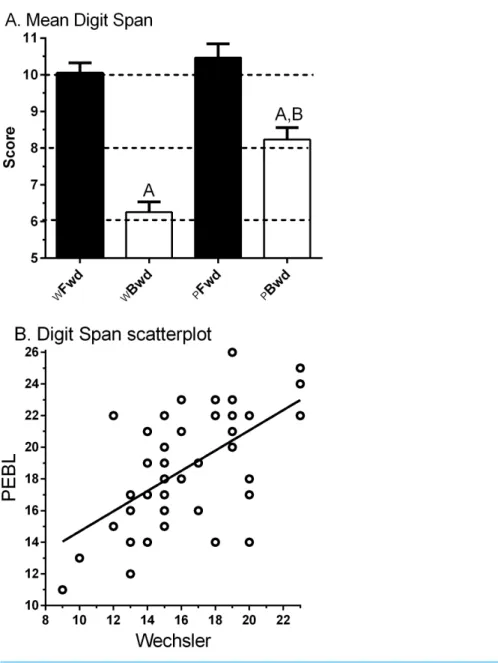
Figure 2Ashows the anticipated higher score for Forward (10.0±0.3, Min=6, Max=
13) relative to Backward (6.3 ±0.3, Min=3, Max=11) on theWDS. The correlation between Forward and Backward was moderate (rP(45)=.43, 95% CI [.16–.64],p< .005;
rS(45)=.41,p< .005).
Figure 2Aalso depicts an elevated score for Forward (10.5±0.4, Min=3, Max=15) compared to Backward (8.2±0.3, Min=4, Max=12,t(46)=5.10,p< .0005) for the PDS. The correlation between Forward and Backward was not significant (rP(45)=.22, 95% CI [−.07–.48],p> .10;rS(45)=.28,p=.054). ThePDS−B was significantly higher thanWDS−B (t(46)=6.43,p< .0005), which is likely to stem from using a visual/manual response entry rather than the verbal mode used in theWDS−B.
Figure 1 Scatterplots depicting the association between measures on the Psychology Experiment Build-ing Language and the Conner’s Continuous Performance Test includBuild-ing reaction time (top:r(42)= +.78,
95% CI [.63–.87],p< .0005), omission errors (middle:rP(42)= +.65, 95% CI [.44–.79],p< .0005) and
Figure 2 (A) Wechsler (W) and Psychology Experiment Building Language (PEBL) Digit Span Forward (Fwd) and Backward (Bwd).Ap< .0005 versus Digit Span Forward,Bp< .0005 versus PEBL Digit Span
Forward. (B) Scatterplot of Wechsler by PEBL Digit Span total (rP(45)= .56, 95% CI [.31–.74],p< .0005).
(rP(45)=.49, 95% CI [.24–.68],p< .001;rS(45)=.467,p< .001).Figure. 2Bshows the association between the DS total (Forward + Backward) across test modalities was moderate (rS(47)=.51,p< .0005).
Iowa Gambling Task (IGT)
Data-analysis was completed by examining each test separately and then comparing across platforms. The NET 1–5 percentile score was 38.0 ±4.4 (Min=5, Max=90)
on the PARIGT. The standardized (T50) score was 47.2 ± 1.5 (Min =34.0, Max =
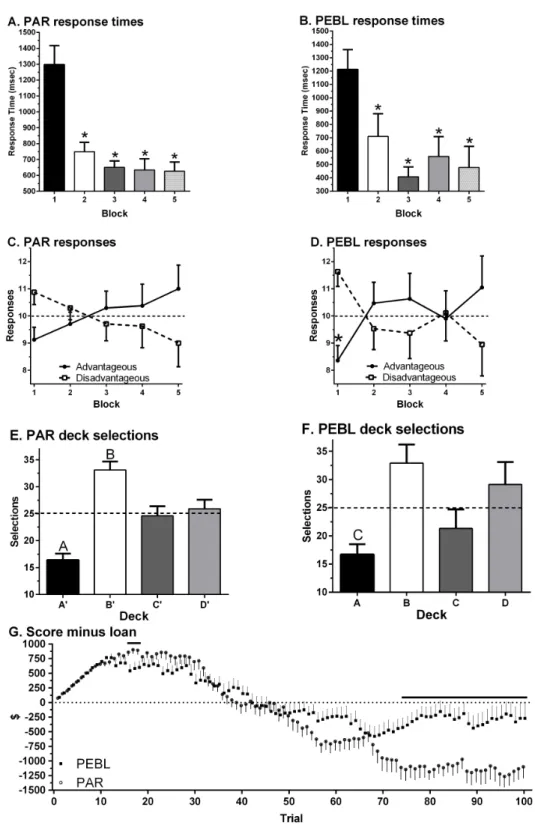
t(23)=1.91,p=.069). A repeated measures ANOVA on Response Times revealed a main effect of Block (F(1.81,41.69)=21.10,p< .0005). Response Times showed a clear decrease over the course of the session with shorter times on Block 2 (t(23)=4.49,p< .0005), Block 3 (t(23)=5.93,p< .0005), Block 4 (t(23)=5.42,p< .0005) and Block 5 (t(23)=5.07,p< .0005) relative to Block 1 (Fig. 3A). Responses on the first Block showed a trend favoring Disadvantageous over Advantageous Decks (t(23)=1.90,p=.07) with the reverse pattern on the last Block (Fig. 3C). Similarly, there was a trend toward greater Advantageous selections on Block 5 (11.0±0.9) compared to Block 1
(t(23)=1.83,p=.081). Across all Blocks, participants made fewer selections from Deck A’ compared to Deck B’ (t(23)=8.98,p< .0005), Deck C’ (t(23)=3.48,p≤.002) or Deck D’ (t(23)=3.65,p≤.001). Participants made more selections from Deck B’ compared to Deck C’ (t(23)=2.79,p≤.01) or Deck D’ (t(23)=2.72,p< .02,Fig. 3E). Almost half (45.8%) of participants made more selections from Disadvantageous (C’+D’) than
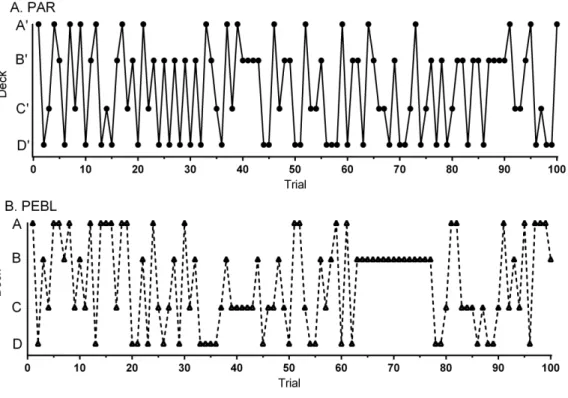
Advantageous (C’+D’) Decks.Figure 4Ashows the Deck selections on each trial for a participant with the median NET 1–5. Half (50.0%) of participants received the second $2,000 loan. The amount earned (score minus loan) increased during the Block 1, dropped below zero during Block 3, and was negative by test completion (−$1,099.58±191.20, Min= −3,015, Max=1,475,Fig. 3G).
A repeated measures ANOVA on Response Times revealed a main effect of Block (F(2.07,37.17)=12.27,p< .0005) on thePEBLIGT. Relative to the first Block, RTs were significantly shorter on Block 2 (t(18)=2.85,p< .02), Block 3 (t(18)=7.45,p< .0005), Block 4 (t(18)=4.26,p≤.0005), and Block 5 (t(16)=4.59,p< .0005, Fig. 3B). Across all five Blocks, RTs were equivalent on the PEBLIGT (668.4+118.0) and PARIGT (786.4 ± 49.1,t(24.2)=.92,p=.37). There were more selections from the Disadvantageous than the Advantageous Decks on Block 1 (t(18)=2.98,p< .01,Fig. 3D). When collapsing across the five Blocks, over-two thirds (68.4%) of respondents made more selections from Disadvantageous than Advantageous Decks. Fewer selections were made from Deck A compared to Deck B (t(18)=4.27,p< .0005) or Deck D (t(18)=2.45,p< .03). There was a trend towards more selections on Deck B compared to Deck C (t(18)=2.05,p=.055,Fig. 3F).Figure 4Bdepicts the Deck selections over the course of the test for a participant with the median NET 1–5. Very few (10.5%) participants received the second $2,000 loan. Compensation, defined as the score minus the loan, grew during the Block 1, dropped towards zero in Block 2, and stayed negative for the remainder of the test. A comparison of compensation across platforms (t-test) revealed that the PEBLIGT money was significantly lower thanPARIGT during trials 16 to 18 and 23 but higher from trial 74 until test completion (−$269.74±255.93, Min=2,425, Max=1,950,
Fig. 3G).
DISCUSSION
Figure 3 Response times on the Psychological Assessment Resources (PAR, A) and Psychology Experi-ment Building Language (PEBL, B) Iowa Gambling Task by block of 20 trials (∗
p< .0005). Selection of
ad-vantageous and disadad-vantageous decks (C, D) (∗p
< .05 versus disadvantageous on block 1). Selection of
each deck (E, F) (Ap< .005 versus Deck B, C, or D;Bp< .05 versus Deck C and D;Cp< .05 versus Deck
Figure 4 Deck selections over one-hundred trials for the participant (a 34 year-old, Native American female) with the median NET1–5 (0) on the Psychological Assessment Resources (PAR) Iowa Gambling Task (A). Deck selections for the participant (a 18 year-old Native American male) with the median NET1–5 (−2) on the Psychology Experiment Building Language (PEBL) Iowa Gambling Task (B).
systematic validation studies comparing their results to existing tests will help establish their suitability for use in basic research and clinical neuroscience applications, including assessment. This report identifies some procedural similarities, and also differences, between the PEBL and commercial versions of ostensibly equivalent tests.
CPT Tests
for ommission errors: .09; commission errors: .72; RT: .76; and RTSE of .63. In a similar study with 39 children aged 6–18 over a 3–8 month interval, Zabel et al. (2009)found ICC of .39 and .57 for omission and commission errors, .65 for hit RTs, and .48 for RT variability, concluding that there was substantial variability in these measures even for their large age range. Using a similar go/no-go CPT,Kuntsi et al. (2005), showed for a group of 47 children, inter-class r scores ranged from .7–.88 on RT scores; 0.26–.83 on SD of RT, and .54–.7 on commission errors. Thus, the between-test correlations in our homogeneous sample of college students compared favorably to previously-reported test-retest correspondence scores on CPT tests. Although the experience of the participants was similar when completing theCCPT and thePCPT, some of the algorithms employed in theCCPT are unpublished or could not be verified by the authors. This is particularly a concern for the signal detection measures (Stanislaw & Todorov, 1999) and therefored′ andBetawere not compared across platforms. Notably, similarity of intra-test correlations is one criterion for the equivalence of measures (Bartram, 1994). The pattern of results with this sample identified inTable 2generally supports this criterion for thePCPT.
DS-F and DS-B Tests
DS type tasks have an extensive history and have been implemented in an analogous format to theWDS for over a century (Richardson, 2007). Importantly, the test-retest reliability of WDS is moderate (r=.68) (Dikmen et al., 1999). DS-F did not differ between WDS andPDS. Although DS-B was less than DS-F for the WDS and thePDS, the magnitude of reduction was attenuated on the PDS. A subset of participants (≈15%) either were rehearsing the digits aloud or on the keyboard while they were being presented on the PDS. Use of these strategies could change the fundamental nature of the constructs being measured. It is important to emphasize that although stimuli are present aurally for both theWDS and the PDS, response execution is oral for theWDS but typed for the PDS. The format of how stimuli is presented and executed is known to produce detectable differences (Karakas et al., 2002). The correlation between thePDS and theWDS was only moderate. This could be due to modality effects or the use of a college-aged sample may have resulted in a restriction of range which attenuated the associations. In principle, voice recognition algorithms would makeWDS and PDS more similar, and an alternative to self-administration is to have a researcher or clinician enter the responses for the study participant, so that he or she must respond vocally. Other investigators that are refining this technology have identified moderate correlations across modalities (Forward = .48, Backward = .50) but difficulties recognizing the responses of participants with accents is not trivial (Miller et al., 2013). More generally, perhaps the notion of theWDS as the ‘‘gold standard’’ is questionable. Computerized administration offers the potential of delivering stimuli at a more consistent rate, intensity, and clarity than traditional methods (Woods et al., 2011). The use of more trials per number of digits and alternative procedures for advancement to the difficulty threshold may improve the precision of DS measurement.
IGT tests
& Damasio, 2000; Bull, Tippett & Addis, 2015; Fernie & Tumney, 2006; Fontaine et al., 2015;Piper et al., 2015a; Verdejo-Garcia et al., 2007). As such, the primary goal of this investigation was not to attempt to evaluate correlations between thePEBLIGT and the PARIGT and instead examined response patterns within each test. ThePEBLIGT and the PARIGT have many procedural similarities but also some differences (Table 1) which may not be widely appreciated. Although there were pronounced individual differences, the PARCPT percentiles were well different than fifty for this collegiate sample. On the primary dependent measure (deck selections), there was a high degree of similarity between the PARIGT andPEBLIGT. For example, the development across trials for a preference of Advantageous over Disadvantageous Decks was evident with both tests (Figs. 2Cand2D). The choice of individual decks (e.g., Deck B was twice as commonly selected as Deck A) was identified with the PARIGT and the PEBLIGT (Figs. 2Eand2F). Response times across blocks were virtually identical in both computerized platforms (Figs. 2Aand2B). However, the compensation awarded at the end of the test, a secondary measure (Bechara, 2007), was examined to identify any impact of the procedural differences inTable 1. Overall, compensation was significantly greater on thePEBLIGT. The losses associated with Disadvantageous Decks in the PEBLIGT (Deck B= −$1,250) are much less pronounced than those in the PARIGT punishments (Deck B starts at−$1,250 but increases up to
−$2,500). Although this procedural difference did not produce other pronounced effects
in this sample, future versions of PEBL will allow the experimenter to select among the original (A B C D) IGT (Bechara et al., 1994) or the variant (A’ B’ C’ D’) task (Bechara, Damasio & Damasio, 2000). Due to this key methodological difference, results from the PEBLIGT (Hawthorne, Weatherford & Tochkov, 2011;Lipnicki et al., 2009a;Lipnicki et al., 2009b) are unlikely to be identical to what would be obtained if thePARIGT was employed.
The benefit of open-source neurobehavioral tests like the PEBLIGT is that the source code is readily available (seeSupplemental Information) and anyone, independent of their financial resources, can use PEBL. This contributes to the democratization of science. It must also be emphasized that there is substantial room for improved construct validity and test-retest reliability for the IGT (Buelow & Suhr, 2009). Anyone, even with limited computer programming expertise, who is interested in modifying task parameters and generating future generations of decision making paradigms may do so, which, hopefully, will result in tests that have even better psychometric properties (e.g., the new PEBLIGT byBull, Tippett & Addis, 2015). The transparency and flexibility of PEBL are advantages over proprietary computerized neurobehavioral applications. Full disclosure of all methodological information including the underlying programming of computerized neurobehavioral tests is consistent with the dissemination policy of theNational Science Foundation (2015)and others. However, the modifiability of PEBL is a bit of a double-edged sword in that tasks like the IGT have undergone substantial refinement over the past decade. At a minimum, investigators that make use of PEBL, PAR, or other applications must include in their methods sections the version of the software they utilized.
CONCLUSIONS
This report identified a high degree of consistency between theCCPT andPCPT, theWDS and thePDS Forward, and thePARIGT andPEBLIGT. Further procedural refinements in this open-source software battery will continue to enhance the utility of the PEBL to investigate individual differences in neurocognition.
ACKNOWLEDGEMENTS
Thanks to Shawn Ell, PhD and members of the Ell lab for use of their laboratory space. Frank Barton provided technical assistance. Shelbie Wolfe and Samantha Munson assisted in data collection. Melissa A. Birkett, PhD and Peter N. Bull, MSc provided feedback on earlier versions of this manuscript.
ADDITIONAL INFORMATION AND DECLARATIONS
Funding
Commercial software for this project was provided by the Husson University School of Pharmacy, the National Institute of Environmental Health Sciences (T32 ES007060-31A1), and National Institute of Drug Abuse (L30 DA027582). The funders had no role in study design, data collection and analysis, decision to publish, or preparation of the manuscript.
Grant Disclosures
The following grant information was disclosed by the authors: Husson University School of Pharmacy.
National Institute of Environmental Health Sciences: T32 ES007060-31A1. National Institute of Drug Abuse: L30 DA027582.
Competing Interests
Shane T. Mueller is an Academic Editor for PeerJ.
Author Contributions
• Brian Piper conceived and designed the experiments, performed the experiments,
analyzed the data, prepared figures and/or tables, reviewed drafts of the paper.
• Shane T. Mueller contributed reagents/materials/analysis tools, wrote the paper, reviewed drafts of the paper.
• Sara Talebzadeh and Min Jung Ki performed the experiments, wrote the paper, reviewed drafts of the paper.
Human Ethics
The following information was supplied relating to ethical approvals (i.e., approving body and any reference numbers):
Willamette University and Husson University approved all procedures.
Data Availability
The following information was supplied regarding data availability:
Supplemental Information
Supplemental information for this article can be found online athttp://dx.doi.org/10.7717/ peerj.1772#supplemental-information.
REFERENCES
Aggarwal R, Mishra A, Crochet P, Sirimanna P, Darzi A. 2011.Effect of caffeine and taurine on simulated laparoscopy performed following sleep deprivation.British
Journal of Surgery98:1666–1672DOI 10.1002/bjs.7600.
Anderson VE, Siegel FS, Fisch RO, Wirt RD. 1969.Responses of a Phyenylketonuric children on a continuous performance test.Journal of Abnormal Psychology
74:358–362DOI 10.1037/h0027611.
Bartram D. 1994. Computer-based assessment. In: Cooper CL, Robertson IT,eds.
International review of industrial and organizational psychology, vol. 9. Chichester: Wiley, 31–69.
Bechara A. 2007. Iowa gambling task professional manual. In:Psychology assessment resources. FL: Lutz.
Bechara A, Damasio AR, Damasio H, Anderson SW. 1994.Insensitivity to future consequences following damage to human prefrontal cortex.Cognition50:7–15
DOI 10.1016/0010-0277(94)90018-3.
Bechara A, Damasio H. 2002.Decision-making and addiction (part I): impaired activation of somatic states in substance dependent individuals when pondering decisions with negative future consequences.Neuropsychologia40:1675–1689
DOI 10.1016/S0028-3932(02)00015-5.
Bechara A, Damasio H, Damasio AR. 2000.Emotion, decision making and orbitofrontal cortex.Cerebral Cortex10:295–307DOI 10.1093/cercor/10.3.295.
Bechara A, Tranel D, Damasio H. 2000.Characterization of the decision-making deficit of patients with ventromedial prefrontal cortex lesions.Brain123:2189–2202
DOI 10.1093/brain/123.11.2189.
Birkett MB, Averett A, Soni J, Piper BJ. 2015.The influence of visual and auditory cue
salience on Iowa Gambling Task performance. Poster presented at the American
Psychological Association, Washington, D.C.: APA.
Buelow MT, Suhr JA. 2009.Construct validity of the Iowa Gambling Task.
Neuropsychol-ogy Review19:102–114DOI 10.1007/s11065-009-9083-4.
Bull PN, Tippett LJ, Addis DR. 2015.Decision making in healthy participants on the Iowa Gambling Task: new insights from an operant approach.Frontiers in Psychology
6:Article 391DOI 10.3389/fpsyg.2015.00391.
Burton L, Plaff D, Bolt N, Hadjkyriacou D, Silton N, Killgallen C, Coffer J, Allimant J. 2010.Effect of gender and personality on the Conners continuous performance test.
Journal of Clinical and Experimental Neuropsychology32:66–70
Caroselli JS, Hiscock M, Scheibel RS, Ingram F. 2006.The simulated gambling paradigm applied to young adults: an examination of university students’ performance.Applied
Neuropsychology13:203–212DOI 10.1207/s15324826an1304_1.
Clark DG, Kar J. 2011.Bias of quantifier scope interpretation is attenuated in normal aging and semantic dementia.Journal of Neurolinguistics24:411–419.
Cohen AL, Shapiro SK. 2007.Exploring the performance differences on the flicker task and the Conners’ continuous performance test in adults with ADHD.Journal of
Attention Disorders11:49–63DOI 10.1177/1087054706292162.
Conners CK. 2004.Conners’ continuous performance test II: technical guide for software
manual. New York: Multi-Health Systems.
Conners K, Jeff JL. 1999.ADHD in adults and children: the latest assessment and treatment strategies. Kansas City: Compact Clinicals.
Danckert J, Stöttinger E, Quehl N, Anderson B. 2012.Right hemisphere brain damage impairs strategy updating.Cerebral Cortex22:2745–2260DOI 10.1093/cercor/bhr351.
Dikmen SS, Heaton RK, Grant I, Temkin NR. 1999.Test-retest reliability and practice effects of the expanded Halstead-Reitan neuropsychological test battery.Journal of the International Neuropsychological Society5:346–336.
Dougherty DM, Marsh DM, Mathias CW. 2002.Immediate and delayed memory tasks: a computerized behavioral measure of memory, attention, and impulsivity.Behavior
Research Methods34:391–398DOI 10.3758/BF03195467.
Earle-Boyer EA, Serper MR, Davidson M, Harvey PD. 1991.Continuous performance tests in schizophrenic patients: stimulus and medication effects on performance.
Psychiatry Research37:47–56DOI 10.1016/0165-1781(91)90105-X.
Fernie G, Tumney RJ. 2006.Some decks are better than others: the effect of reinforcer type and task instructions on learning in the Iowa Gambling Task.Brain & Cognition
60:94–102 DOI 10.1016/j.bandc.2005.09.011.
Fontaine A, Piper BJ, Mueller ST, Coane J. 2015. Test-retest reliability of PEBL
executive control tasks in younger and older adults. In:Abstracts of the Psychonomic
Society, vol. 5162. Madison: Psychonomic Society.
Fox CJ, Mueller ST, Grey HM, Raber J, Piper BJ. 2013.Evaluation of a short-form of the Berg card sorting test.PLoS ONE8(5):e63885DOI 10.1371/journal.pone.0063885.
González-Giraldo Y, Rojas J, Novoa P, Mueller ST, Piper BJ, Adan A, Forero DA. 2014.Functional polymorphisms in BDNF and COMT genes are associated with objective differences in arithmetical functioning in a sample of young adults.
Neuropsychobiology 70:152–157DOI 10.1159/000366483.
Greenberg LM, Waldman ID. 1993.Developmental normative data on the Test of variables of attention (T.O.V.A.TM).Journal of Child Psychology & Psychiatry
34:1019–1030DOI 10.1111/j.1469-7610.1993.tb01105.x.
Hawthorne MJ, Weatherford DR, Tochkov K. 2011.Effects of explicit and implicit cognitive factors on the learning patterns in the Iowa Gambling Task.American Journal of Psychological Research7:64–78.
Karakas S, Yalm A, Irak M, Erzengin OU. 2002.Digit span changes from puberty to old age under different levels of education.Developmental Neuropsychology22:423–453
DOI 10.1207/S15326942DN2202_1.
Keneko H, Yoshikawa T, Nomura K, Ito H, Yamauchi H, Ogura M, Honjo S. 2011.
Hemodynamic changes in the prefrontal cortex during digit span task: a near-infrared spectroscopy study.Neuropsychobiology63:59–65DOI 10.1159/000323446.
Kuntsi J, Andreou P, Ma J, Börger NA, Van der Meere JJ. 2005.Testing assumptions for endophenotype studies in ADHD: reliability and validity of tasks in a general population sample.BMC Psychiatry 5:40DOI 10.1186/1471-244X-5-40.
Lezak MD, Howieson DB, Bigler ED, Tranel D. 2012.Neuropsychological assessment. 5th edition. New York: Oxford.
Lipnicki DM, Gunga HC, Belavy DL, Felsenberg D. 2009a.Decision making after 50 days of simulated weightlessness.Brain Research1280:84–89
DOI 10.1016/j.brainres.2009.05.022.
Lipnicki DM, Gunga HC, Belavý DL, Felsenberg D. 2009b.Bed rest and cognition: effects on executive functioning and reaction time.Aviation Space & Environmental
Medicine80:1018–1024DOI 10.3357/ASEM.2581.2009.
Lyvers M, Tobias-Webb J. 2010.Effects of acute alcohol consumption on executive cognitive functioning in naturalistic settings.Addictive Behavior35:1021–1028
DOI 10.1016/j.addbeh.2010.06.022.
Mackworth NH. 1948.The breakdown of vigilance during prolonged visual search.
Quarterly Journal of Experimental Psychology 1:6–21
DOI 10.1080/17470214808416738.
McGee RA, Clark SE, Symons DK. 2000.Does the Conners’ continuous performance test aid in ADHD diagnosis?Journal of Abnormal Child Psychology28:415–424
DOI 10.1023/A:1005127504982.
Miller DI, Talbot V, Gagnon M, Messier C. 2013.Administration of neuropsychological tests using interactive voice response technology in the elderly: validation and limitations.Frontiers in Neurology 4: Article 107DOI 10.3389/fneur.2013.00107.
Mueller ST. 2015.The psychology experiment building language, version 0.14. Available at
http:// pebl.sourceforge.net.
Mueller ST, Piper BJ. 2014.The psychology experiment building language (PEBL) and PEBL test battery.Journal of Neuroscience Methods222:250–259
DOI 10.1016/j.jneumeth.2013.10.024.
National Science Foundation. 2015.Dissemination and sharing of research results.
Available athttp:// www.nsf.gov/ bfa/ dias/ policy/ dmp.jsp(accessed 22 July 2015).
Ogg RJ, Zou P, Allen DN, Hutchins SB, Dutkiewicz RM, Mulhern RK. 2008.Neural correlates of a clinical continuous performance test.Magnetic Resonance Imaging
26:504–512DOI 10.1016/j.mri.2007.09.004.
Paul RH, Lawrence J, Williams LM, Richard CC. 2005.Preliminary validity of IntegneuroTM: a new computerized battery of neurocognitive tests.International
Peterson DS, Fling BW, Mancini M, Cohen RG, Nutt JG, Horak FB. 2015.Dual-task interference and brain structural connectivity in people with Parkinson’s disease who freeze.Journal of Neurology, Neurosurgery & Psychiatry86:786–792
DOI 10.1136/jnnp-2014-308840.
Piper BJ. 2010.Age, handedness, and sex contribute to fine motor behavior in children.
Journal of Neuroscience Methods195:88–91DOI 10.1016/j.jneumeth.2010.11.018.
Piper BJ, Acevedo SF, Craytor MJ, Murray PW, Raber J. 2010.The use and validation of the spatial navigation Memory Island test in primary school children.Behavioural
Brain Research210:257–262DOI 10.1016/j.bbr.2010.02.040.
Piper BJ, Acevedo SF, Kolchugina GK, Butler RW, Corbett SM, Honeycutt EB, Craytor MJ, Raber J. 2011.Abnormalities in parentally rated executive function in methamphetamine/polysubstance exposed children.Pharmacology, Biochemistry, &
Behavior 98:432–439DOI 10.1016/j.pbb.2011.02.013.
Piper BJ, Li V, Eowiz M, Kobel Y, Benice T, Chu A, Olsen RH, Rice DZ, Gray HM, Mueller ST, Raber J. 2012.Executive function on the Psychology Experiment Building Language test battery.Behavior Research Methods44:110–123
DOI 10.3758/s13428-011-0096-6.
Piper BJ, Mueller ST, Geerken AR, Dixon KL, Kroliczak G, Olsen RHJ, Miller JK. 2015a.Reliability and validity of neurobehavioral function on the Psychology Experimental Building Language test battery in young adults.PeerJ3:e1460
DOI 10.7717/peerj.1460.
Piper BJ, Parkhurst D, Greenhalgh J, Gelety C, Birkett MA. 2015b.A neurobehavioral comparison of the Psychological Assessment Resources and the PEBL versions of the Iowa Gambling Task in young-adults. Psychology Experiment Building Language Technical Report Series, 2015-01. Available athttp:// sites.google.com/ site/ pebltechnicalreports/ home/ 2015/ pebl-technical-report-2015-01.
Plant RR, Quinlan PT. 2013.Could millisecond timing errors in commonly used equipment be a cause of replication failure in some neuroscience studies?Cognitive Affective & Behavioral Neuroscience13:598–614 DOI 10.3758/s13415-013-0166-6.
Riccio CA, Reynolds CR, Lowe P, Moore JT. 2002.The continuous performance test: a window on the neural substrates for attention.Archives of Clinical Neuropsychology
17:235–272DOI 10.1016/S0887-6177(01)00111-1.
Richardson JT. 2007.Measures of short-term memory: a historical review.Cortex
43:635–650DOI 10.1016/S0010-9452(08)70493-3.
Rosvold HE, Mirsky AF, Sarason I, Bransome ED, Beck LH. 1956.A continuous performance test of brain damage.Journal of Consulting Psychology20:343–350
DOI 10.1037/h0043220.
Solanto M, Newcorn J, Vail L, Gilbert S, Ivanov I, Lara R. 2009.Stimulant drug response in the predominantly inattentive and combined subtypes of attention-deficit/hyperactivity disorder.Journal of Child and Adolescent Psychopharmacology
Soreni N, Crosbie J, Ickowicz A, Schachar R. 2009.Stop signal and Conners’ continuous performance tasks: test–retest reliability of two inhibition measures in ADHD chil-dren.Journal of Attention Disorders13(2):137–143DOI 10.1177/1087054708326110.
Stanislaw H, Todorov N. 1999.Calculation of signal detection theory measures.Behavior
Research Methods, Instruments, & Computers31:137–149DOI 10.3758/BF03207704.
St Clair-Thompson HL, Allen RJ. 2013.Are forward and backward recall the same? A dual-task study of digit recall.Memory & Cognition41(4):519–532
DOI 10.3758/s13421-012-0277-2.
Steingroever H, Wetzels R, Horstman A, Neumann J, Wagenmakers EJ. 2013. Perfor-mance of healthy participants on the Iowa Gambling Task.Psychological Assessment
25:180–193DOI 10.1037/a0029929.
Verdejo-Garcia A, Benbrook A, Funderburk F, David P, Cadet JL, Bolla KI. 2007.The differential relationship between cocaine use and marijuana use on decision-making performance over repeated testing with the Iowa Gambling Task.Drug & Alcohol
Dependence90:2–11DOI 10.1016/j.drugalcdep.2007.02.004.
Wardle MC, Hart AB, Palmer AA, De Wit H. 2013.Does COMT genotype influence the effects of d-amphetamine on executive functioning?Genes, Brain and Behavior
12:13–20DOI 10.1111/gbb.12012.
Woods DL, Kishiyama MM, Yund EW, Herron TJ, Edwards B, Poliva O, Hink RF, Reed B. 2011.Improving digit span assessment of short-term verbal memory.Journal of Clinical and Experimental Neuropsychology33:101–111
DOI 10.1080/13803395.2010.493149.
Zabel TA, Von Thomsen C, Cole C, Martin R, Mahone EM. 2009.Reliability concerns in the repeated computerized assessment of attention in children.The Clinical
![Figure 1 Scatterplots depicting the association between measures on the Psychology Experiment Build- Build-ing Language and the Conner’s Continuous Performance Test includBuild-ing reaction time (top: r(42) = +.78, 95% CI [.63–.87], p < .0005), omission](https://thumb-eu.123doks.com/thumbv2/123dok_br/18132578.325489/9.918.294.691.122.935/scatterplots-depicting-association-psychology-experiment-continuous-performance-includbuild.webp)