The impact of SCIAMACHY near-infrared instrument calibration
on CH
4
and CO total columns
A. M. S. Gloudemans1, H. Schrijver1, Q. Kleipool1,*, M. M. P. van den Broek1, A. G. Straume1,**, G. Lichtenberg1, R. M. van Hees1, I. Aben1, and J. F. Meirink2
1SRON National Institute for Space Research, Utrecht, The Netherlands 2Royal Netherlands Meteorological Institute (KNMI), De Bilt, The Netherlands *now at: Royal Netherlands Meteorological Institute (KNMI), De Bilt, The Netherlands
**now at: the European Space Agency, European Space Research & Technology Centre (ESA-ESTEC), Noordwijk, The
Netherlands
Received: 9 February 2005 – Published in Atmos. Chem. Phys. Discuss.: 18 March 2005 Revised: 26 July 2005 – Accepted: 25 August 2005 – Published: 14 September 2005
Abstract. The near-infrared spectra measured with the SCIAMACHY instrument on board the ENVISAT satellite suffer from several instrument calibration problems. The ef-fects of three important instrument calibration issues on the retrieved methane (CH4) and carbon monoxide (CO) total
columns have been investigated: the effects of the growing ice layer on the near-infrared detectors, the effects of the orbital variation of the instrument dark signal, and the ef-fects of the dead/bad detector pixels. Corrections for each of these instrument calibration issues have been defined. The retrieved CH4and CO total columns including these
correc-tions show good agreement with CO measurements from the MOPITT satellite instrument and with CH4model
calcula-tions by the chemistry transport model TM3. Using a sys-tematic approach, it is shown that all three instrument cali-bration issues have a significant effect on the retrieved CH4
and CO total columns. However, the impact on the CH4
total columns is more pronounced than for CO, because of its smaller variability. Results for three different wavelength ranges are compared and show good agreement. The grow-ing ice layer and the orbital variation of the dark signal show a systematic, but time-dependent effect on the retrieved CH4
and CO total columns, whereas the effect of the dead/bad pixels is rather unpredictable: some dead pixels show a ran-dom effect, some more systematic, and others no effect at all. The importance of accurate corrections for each of these instrument calibration issues is illustrated using examples where inaccurate corrections lead to a wrong interpretation of the results.
Correspondence to:A. M. S. Gloudemans
1 Introduction
The SCanning Imaging Absorption spectroMeter for At-mospheric CHartographY (SCIAMACHY)1 which was launched on board the ENVISAT satellite on 1 March 2002, has allowed the measurement of global distributions of methane (CH4) and carbon monoxide (CO) down to the
Earth’s surface. These gases play an important role in tro-pospheric chemistry and possible climate change. Therefore, a good knowledge of the global distributions of these gases is a prerequisite to fully understand their role in atmospheric chemistry.
Global measurements of CH4 and CO have also been
performed by the MOPITT instrument on board the EOS-TERRA satellite in the near- and thermal infrared (e.g. Drummond and Mand, 1996; Deeter et al., 2003). Up till now, MOPITT has been unsuccessful in retrieving accurate CH4 total columns from their data. Methane and carbon
monoxide have been measured earlier by the Interferometric Monitoring of Greenhouse Gases (IMG) instrument on board the ADEOS satellite (Clerbaux et al., 2003; Barret et al., 2005). Recently, the EOS-AURA satellite was launched, car-rying the Tropospheric Emission Spectrometer (TES) instru-ment, which is currently measuring CH4and CO (e.g. Beer
et al., 2001). However, retrieved total column products from this instrument are not yet available. Ground-based measure-ments of CO and CH4 total columns are available from a
number of ground stations, but they do not provide global coverage and a significant fraction of these are at elevated lo-cations. Thus, these stations only measure the total column directly above the station, whereas the larger spatial cover-age of a SCIAMACHY ground pixel will mostly also include
2370 A. M. S. Gloudemans et al.: SCIAMACHY’s impact on CH4and CO columns
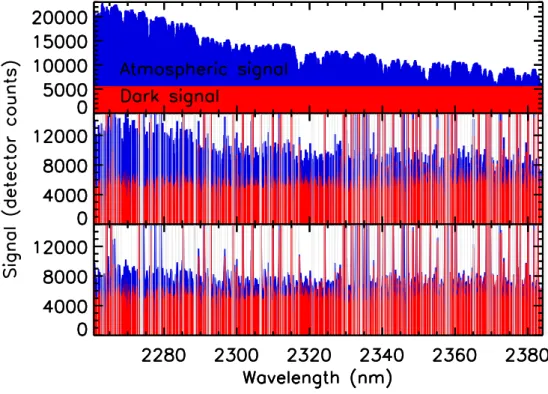
Fig. 1. The total signal, i.e. dark signal+atmospheric signal, as measured by SCIAMACHY’s channel 8 detector. The total dark signal
is shown in red, the atmospheric signal in blue. The white vertical lines denote the positions of the dead detector pixels at the end of February 2004. Top: Simulated SCIAMACHY measurement in the case of a strong atmospheric signal, assuming a noise-free dark signal. Middle: SCIAMACHY measurement over the Sahara with a high surface albedo of 0.55. The relative contribution of the dark signal of the SCIAMACHY instrument to the total measured signal varies from∼45% at 2260 nm to∼75% at 2380 nm. Bottom: SCIAMACHY
measurement over Central Africa with a lower surface albedo of 0.11. The relative contribution of the dark signal of the SCIAMACHY instrument to the total measured signal varies from∼63% at 2260 nm to∼97% at 2380 nm.
contributions from lower (polluted) altitudes, where most of the CO and CH4resides (de Mazi`ere et al., 2004; Dils et al.,
2005).
The retrievals of CO and CH4from SCIAMACHY’s
near-infrared channel 8 have proven more complex than antici-pated, due to the presence of an unexpected ice layer on the detectors, which varies in time. Its effects have been reduced by applying dedicated in-flight decontamination procedures and additional in-flight calibration measurements, as well as improvements to the calibration. However, the quantitative effects of these problems on the retrieved CH4and CO total
columns have only been investigated for very few cases. This paper focuses on a more systematic investigation of some of the major calibration problems concerning SCIA-MACHY’s near-infrared channel 8 and the effects of these problems on the retrieved CH4and CO total columns from
this channel. The problems addressed in this paper are at present not or insufficiently corrected for in the operational SCIAMACHY data provided by ESA/DLR.
Different corrections for these issues have been developed independently by a number of research groups (e.g. Buch-witz et al., 2004b; Frankenberg et al., 2005b; Gloudemans et al., 2004), but the detailed information describing the ap-plied corrections and their impact is often lacking.
Model calculations show that in order to determine e.g. CH4 sources and sinks, and estimate CO emissions from
SCIAMACHY measurements, a precision of ∼1–2% for
CH4 and ∼10–20% for CO is required (e.g. Ehret and
Kiemle, 2005, S. Houweling and M. Krol, SRON/IMAU, private communication). This paper shows that in order to retrieve total columns with those precisions from channel 8, detailed corrections for all known instrument calibration problems are required. Section 2 discusses the major instru-ment calibration problems, Sect. 3 describes the retrieval al-gorithm used, and Sect. 4 shows the retrieval results using SCIAMACHY measurements. The effects of the instrument calibration improvements on the retrieved CH4and CO total
columns are presented in Sect. 5 as well as comparisons of retrievals in different spectral windows of SCIAMACHY’s channel 8. Finally, Sect. 6 discusses all results and the con-clusions are summarized in Sect. 7.
2 Instrument calibration
A. M. S. Gloudemans et al.: SCIAMACHY’s impact on CH4and CO columns 2371
these species in this wavelength range is complicated due to the low atmospheric signal compared to the instrument dark signal itself (Fig. 1). This dark signal is the sum of the de-tector dark signal and the thermal background of the instru-ment and represents the total measured signal when no light is falling onto the instrument itself. SCIAMACHY measure-ments show that in case of a strong atmospheric signal, cor-responding to a surface albedo of 0.55, the dark signal con-tribution varies from∼45% at the short wavelength end of channel 8 to∼75% at the long wavelength end. In the case of a lower surface albedo, the corresponding lower atmospheric signal results in an even higher contribution of the dark signal as is shown in Fig. 1. Thus, an accurate instrument calibra-tion (dark signal etc.) is required in order to retrieve mean-ingful total columns from SCIAMACHY’s channel 8.
Unfortunately, the retrieval within this wavelength range is hampered by a number of instrument-calibration prob-lems. The most important complication in channel 8 is the growth of an ice layer on the detector. This ice layer is due to spurious water absorbed in the ENVISAT satellite frame. Over time, this water evaporates and most of it es-capes to space. However, a small portion is trapped by the SCIAMACHY instrument isolation blankets and freezes out onto the near-infrared detectors. The ice layer increases slowly in time up to a thickness of∼400µm and leads to losses in the total measured signal of up to∼50% (Lichten-berg et al., 2005). This loss in signal is partially alleviated by heating the detector every 3–6 months, hereby evaporat-ing the ice layer. However, the decrease of the signal be-haves differently after each of these decontamination peri-ods (see Fig. 2 and http://atmos.af.op.dlr.de/projects/scops/ or http://www.sron.nl/www/code/eos/sciamachy/calibration/ SCIACALtransmission.php). The consequences of the grow-ing ice layer are threefold:
– The signal-to-noise ratio of the spectra is reduced.
– The instrument thermal background contribution to the total dark signal decreases, as the ice layer also absorbs these photons. In order to deal with this, the total dark signal has been measured every orbit, since October 2002 (Kleipool, 2003a).
– Scattering of light in the ice layer gives rise to extended wings in the slit function.
The latter has a significant effect on the retrieved columns and is the most difficult to correct for, since it varies in time and cannot be determined independently. One possibility to determine a correction for this broadening of the slit function is by using the in-flight measurements from SCIAMACHY’s Spectral Light Source (SLS), which clearly show the pres-ence of broadened wings over time. However, this spectral lamp does not illuminate the whole slit and the overlapping line wings in the SLS spectra complicate the use of these measurements to correct for the broadening of the slit func-tion. In addition, the ice layer is not uniform over the whole
Fig. 2.The measured total signal averaged over channel 8 and
nor-malised to an (almost) ice-free measurement in August 2002. Only data right after the August 2003 decontamination (duration: 375 h) till the end of February 2004 are shown and include the decontam-ination period in December 2003/January 2004 (duration: 338 h). The loss in the total signal due to the growing ice layer in SCIA-MACHY’s channel 8 can be clearly seen.
channel, so that defining a correction method which is ap-plicable at all wavelengths within channel 8 is complicated. Therefore, a different approach has been adopted in the re-trievals presented here, which is described in Sect. 3.
Furthermore, the instrument thermal background and thus the total dark signal also varies within an orbit. This is due to the optical bench heating up on the day side of the orbit. The dark signal is measured upon entering the eclipse near the South Pole, where the contribution of the thermal back-ground signal is largest. This ultimately leads to CH4 total
columns that are too high, especially at high Northern lat-itudes where the actual dark signal deviates most from the measured dark signal (Kleipool, 2004a). The deviation from the measured dark signal varies over the months, since the dark signal is influenced by the thickness of the ice layer.
Lastly, the near-infrared wavelength range in channel 8 is sampled by 1024 detector pixels, a significant fraction of which have turned “dead” or “bad” during the life time of SCIAMACHY (Kleipool, 2004b). A pixel is labelled “dead” when there is no spectral response and “bad” when the spec-tral response is too noisy or unpredictable. Since neither “dead” nor “bad” detector pixels should be used in the re-trievals, both will be referred to as “dead” pixels through-out this paper for simplicity. The most likely causes for this failure of detector pixels are the manufacturing process itself and in-flight radiation damage (Kleipool et al., 20052). The most worrying consequence of this is that the number of dead
2Kleipool, Q., Jongma, R., Gloudemans, A. M. S., et al.:
2372 A. M. S. Gloudemans et al.: SCIAMACHY’s impact on CH4and CO columns
pixels appears to be increasing steadily in time, at a rate of ∼60 pixels per year. This calls for a time-dependent dead pixel mask to be used in the retrieval codes when retrieving total columns from channel 8. In Sect. 5.3 it will be shown that using one dead pixel in the retrieval code, can lead to erroneous results (see also Kleipool, 2004b).
3 Retrieval algorithm
The retrieval method used here is based on an Iterative Maxi-mum Likelihood Method (IMLM) and has been developed at SRON. The retrieval uses a fixed set of climatological atmo-spheric profiles based on the US standard atmosphere (1976) to compute a model spectrum in terms of optical depths. For each SCIAMACHY ground pixel these profiles are truncated at the mean surface elevation of the pixel.
Once the optical depths are calculated, the earth radi-ance can be computed in a forward model (Schrijver, 1999, Gloudemans et al., 20053), which is then transformed by an instrument model to represent the radiation detected by the instrument detectors. This modelled spectrum is then fitted – by adjusting the total columns of the different species – to the measured (detector) spectrum in an iterative way. The in-strument model also provides an estimate of the inin-strument noise, from which, by standard statistical methods, an esti-mate is computed of the instrument-noise related errors in the total columns. A more detailed description of the retrieval al-gorithm can be found in Schrijver (1999) and Gloudemans et al. (20053).
The instrument model used in the current retrievals in-cludes a dedicated time-dependent dead pixel mask, as well as dark signals for every orbit, both of which are taken from the SRON database set up by Kleipool (2003a, 2004b). A correction for the variation of the dark signal within an orbit is also included (Kleipool, 2004a), as well as a first approx-imate correction for the broadening of the slit function due to the growing ice layer. Comparing SLS spectra for differ-ent thicknesses of the ice layer shows that the effect of the slit function’s extended wings on the spectrum resembles an additional background signal. Therefore, this latter correc-tion involves adding a constant baseline per orbit (i.e. inde-pendent of wavelength) to the modelled detector spectrum, which has been calculated from a slit function measured un-der (almost) ice-free conditions. Since only a small spectral window of channel 8 is used in the retrievals presented here, this appears to be an acceptable approximation, as can also be shown by computing synthetic spectra. The size of the addi-tional background signal relative to the total measured signal has been determined by fixing the SCIAMACHY CH4values
on a daily basis to the CH4total columns over the central part 3Gloudemans, A. M. S., Schrijver, H., and Jongma, R.: The
Iterative Maximum Likelihood Method (IMLM) for near-infrared trace gas retrieval from SCIAMACHY, in preparation, 2005.
of the Sahara between 20◦W and 20◦E, as calculated by at-mospheric chemistry models. These models show little varia-tion in the CH4total columns in space and time over this part
of the Sahara and are in good agreement with in situ mea-surements at the Assekrem station in Algeria (S. Houwel-ing 2005, private communication). Therefore it appears a good region for calibrating the SCIAMACHY data. Despite the generally good agreement with in situ and flask measure-ments on a global scale (e.g. Houweling et al., 1999, 2000), these models may deviate from reality. Since averages over a relatively large geographical area are taken, the resulting bias in the retrieved CH4total columns is estimated to be not
more than 1–2%.
All above correction methods, except for the correction for the broadening of the slit function’s wings, are the same as those included in the SCIAMACHY level 1b products patched by SRON4. It is still under investigation how these correction methods can be refined, but further improvements are expected to be small compared to the effects shown in Sect. 5. In addition, a number of improvements to the re-trieval approach are foreseen. For example, only a fixed at-mospheric temperature profile, the US standard temperature profile, has been used at present, but at the time of writ-ing the inclusion of an ECMWF temperature profile in the IMLM retrieval algorithm is being implemented. The lack of a correct temperature profile can lead to errors in the retrieved CO total column of<0.35×10¹⁸molec/cm2for most ground pixels, smaller than the current instrument-noise related pre-cision of the retrievals. The CH4 total columns are mostly
off by<5% with a maximum error of∼10% for some iso-lated cases (Gloudemans et al., 20053). However, this does not affect the effect of the instrument calibration problems presented here, since these are shown as the difference be-tween retrievals with and without correction, both of which use the same temperature profile. Recently, retrievals using ECMWF temperature profiles have been performed for part of the data set presented here. These show indeed that the ef-fects shown in Sect. 5 are not affected by using the fixed US standard temperature profile. Scattering in the atmosphere is not included in the forward model, but is expected to intro-duce only small corrections of<1% for CH4and<2% for
CO (Buchwitz and Burrows, 2004). The retrieved CH4and
CO total column data presented in this paper have been cloud masked and thus contain only cloud-free measurements. For this, a cloud mask based on the SCIAMACHY Polarisation Measurement Devices (PMDs) 2, 3, and 4 has been included in the IMLM algorithm. This cloud algorithm is similar to that described by Krijger et al. (2005), except that the dis-tinction between ice/snow covered surfaces is not included. The cloud mask by Krijger et al. (2005) is being implemented at the time of writing.
4http://www.sron.nl/∼richardh/SciaDC/scia patch 1b/index.
A. M. S. Gloudemans et al.: SCIAMACHY’s impact on CH4and CO columns 2373
✁
✂☎✄
✆
✁
☞ ✁ ☞
☞ ☞
Fig. 3.Monthly averaged CH4total columns for November 2003. Left panel: Retrieval results from the IMLM algorithm. Only cloud-free
individual SCIAMACHY ground pixels, with instrument-noise related errors<0.2×1019cm−2have been averaged and re-gridded on a
1◦×1◦grid. The CH
4total columns have been normalized to surface elevation prior to averaging. Right panel: Total columns calculated
from the chemistry transport model TM3 on a 2.5◦by 2.5◦horizontal grid. The total columns have been normalized to surface pressure.
4 Retrieval results
Near-infrared CH4 and CO total columns from
SCIA-MACHY have also been reported by others (e.g. Buchwitz et al., 2004a,b, 2005; Frankenberg et al., 2005a,c). Quali-tative comparisons have shown that the IMLM results agree well with these other data products (e.g. Gloudemans et al., 2004), even though there are significant differences between the algorithms used and the applied instrument calibration.
In order to investigate the effects of the different instru-ment calibration problems instru-mentioned in Sect. 2 on the re-trieved CH4 and CO total columns, six months of
SCIA-MACHY channel 8 data have been analysed. The period September 2003 – February 2004 has been chosen, because the available data result in a good global coverage. The start of this period is right after the August 2003 tamination (duration: 375 h) and also includes the decon-tamination period in December 2003/January 2004 (duration 338 h), allowing the investigation of instrument-calibration effects after two different decontamination procedures. Re-sults are shown for retrievals in the channel 8 spectral win-dow between 2321–2334 nm. This winwin-dow is similar to that used by Frankenberg et al. (2005a). Results for two other spectral windows of channel 8 are discussed in Sect. 5.4. The data presented in this section include corrections for all instrument-calibration problems mentioned in Sect. 2. Sec-tion 5 illustrates in more detail the effects on the retrieval of not including these corrections.
4.1 CH4
Figure 3 shows the monthly-averaged CH4 results for
November 2003. Only cloud-free ground pixels with a high enough signal-to-noise ratio have been included in the SCIA-MACHY retrievals. The lack of data over the oceans is due to the fact that the surface albedo is too low, resulting in a signal-to-noise ratio which is too small to perform accurate
retrievals. At high latitudes (&70◦N) the signal-to-noise ra-tio is also too low.
Unfortunately, no independent satellite-based CH4
to-tal column measurements are available, so that the SCIA-MACHY CH4 total columns can only be compared to
to-tal columns from ground-based stations or calculations from atmospheric chemistry transport models. Comparisons of the IMLM total columns with ground-based measurements are presented by Dils et al. (2005), but these do not pro-vide global coverage. Therefore in Fig. 3, the retrieved CH4
total columns are compared with calculations by the chem-istry transport model TM3 from the Royal Netherlands Me-teorological Institute (KNMI). A detailed description of the TM3 model used here can be found in Dentener et al. (2003) and references therein. The model includes CH4emissions
closely following Houweling et al. (1999). These model calculations show a good agreement with in situ measure-ments (http://www.cmdl.noaa.gov/ccg/) and reproduce the background CH4levels well. Although most chemistry
trans-port models do not contain up-to-date emissions and the model resolution is mostly coarser than the resolution of the SCIAMACHY ground pixels (e.g. 2◦ by 3◦ as opposed to 120×30 km, i.e.∼1.1◦by 0.27◦at the equator) they do pro-vide accurate information on the large scale distribution of CH4, such as the North-South gradient and well-known
con-tinuous or seasonal sources and sinks.
Figure 3 shows that such a qualitative comparison shows good agreement between the monthly-averaged SCIA-MACHY data and the corresponding TM3 calculations. For instance, the North-South gradient is clearly visible in the SCIAMACHY data. In addition, many differences can be identified as well, such as the areas in Eastern USA, and the East coast of Australia, which are hardly visible in the TM3 model. The origin of these differences is still under investi-gation. In Central Africa between∼10◦S and∼5◦N a re-gion with low CH4columns is visible which is not in
2374 A. M. S. Gloudemans et al.: SCIAMACHY’s impact on CH4and CO columns
✁
✂☎✄
✁
✁
☞
Fig. 4. Comparison of the monthly averaged CH4 total columns
for September 2003, where all data within a five-degree latitude bin have been averaged (see text). The black diamonds denote the IMLM CH4total columns, the red diamonds the
correspond-ing TM3 data. The blue boxes show the regions where the dif-ference between the IMLM and TM3 CH4total columns is.2%.
Only cloud-free ground pixels with instrument-noise related errors <0.2×10¹⁹molec/cm2have been included. The error bars denote
the 1σ standard deviation of the data points averaged within each 5◦latitude bin. Both the SCIAMACHY and the TM3 total columns have been normalized to the surface pressure.
cloudy SCIAMACHY ground pixels that have not been fil-tered out by the cloud mask included in the IMLM retrieval algorithm. Other persistently cloudy areas such as in the Amazon basin are also clearly identified by the lack of cloud-free SCIAMACHY data. In addition, low CH4 columns
are seen in West Africa between ∼5–15◦N. This area is known for the presence of forest fires and the correspond-ing smoke may not be picked up by the cloud mask. Smoke and/or clouds shield the CH4 in the lower parts of the
at-mosphere, resulting in too low CH4total columns measured
by SCIAMACHY. Retrieval of CO2, another well-mixed gas,
from SCIAMACHY’s channel 6, also results in too low total columns of a few percent in the same area, using the same cloud mask (W. Hartmann, SRON, private communication).
Figure 4 shows a more quantitative comparison of the monthly-averaged CH4 total columns from the IMLM
re-trieval algorithm with TM3 for September 2003. Here, the globe has been divided in five-degree latitude bins. All SCIAMACHY data within each latitude bin have been av-eraged over the whole month and compared to the monthly average of the collocated TM3 CH4total columns within the
same latitude bin. Both data sets have been normalized to surface pressure prior to averaging. The results show a good agreement between latitudes 40◦S and 5◦S and on the North-ern Hemisphere (&15◦N). In both regions the difference be-tween the retrieved CH4columns and the TM3 calculations
is less than∼2%, except for the region North of 65◦N, where it is∼5%. This region may suffer from higher solar zenith angles or cloudy ground pixels, resulting in erroneous CH4
columns. The area between 5◦S and 15◦N is mostly cloudy at this time of the year, as is also seen for November 2003 in Fig. 3, and may also be affected by smoke from the forest fires, resulting in lower CH4total columns and less
colloca-tions with TM3.
Although only comparisons for two months, September and November 2003, are shown here, the other months do give similar results (see also Straume et al., 2005).
4.2 CO
Independent satellite-based CO total column measurements are available, unlike for CH4. Especially for CO, which has
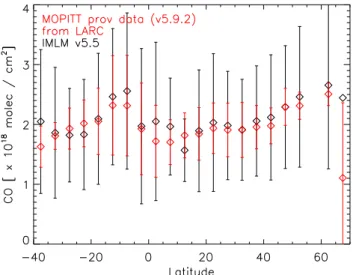
strong temporal and spatial variations, such satellite inter-comparisons provide a very valuable validation technique. The MOPITT instrument is currently the only other instru-ment from which CO total column measureinstru-ments from space are available. MOPITT uses gas-correlation spectroscopy, based on pressurized cells (Drummond and Mand, 1996), whereas SCIAMACHY uses a grating spectrometer. In addi-tion, SCIAMACHY measures CO in the near-infrared, while MOPITT observes CO in the thermal infrared, where the CO lines are much stronger than in the near-infrared. Thus, measurements from these satellites provide two independent sets of CO total column products, making them very suitable for a first qualitative comparison with the retrieved SCIA-MACHY CO total columns. In the near-infrared, the sur-face reflectance over the oceans is very low, complicating the SCIAMACHY retrievals in these areas. Measurements in the thermal infrared however have a lower sensitivity to the boundary layer, due to small temperature contrasts with respect to the surface. In those cases, a priori information is added to the MOPITT CO measurements. Since this is more likely to happen at night, only day-time MOPITT measure-ments are taken into account.
Monthly-averaged results for CO compared with measure-ments by the MOPITT instrument are shown in Figs. 5 and 6 for November and September 2003. Only cloud-free ground pixels with a high enough signal-to-noise ratio have been in-cluded in the SCIAMACHY retrievals shown here.
The SCIAMACHY CO total columns for November 2003 shown in Fig. 5 are in reasonably good agreement with the MOPITT measurements of that month. The data sets show a reasonable agreement on both the Northern and Southern Hemisphere, and enhanced CO columns in West and Central Africa and Brazil due to bio-mass burning are seen in both data sets. Similar enhanced CO columns are reported by Frankenberg et al. (2005a), using the same SCIAMACHY data, but using a different retrieval algorithm (Frankenberg et al., 2005b). This is the same region where the low CH4
A. M. S. Gloudemans et al.: SCIAMACHY’s impact on CH4and CO columns 2375
✁
✂✁
✆
✁
☞ ✁ ☞
Fig. 5.Monthly averaged CO total columns for November 2003. Left panel: Retrieval results from the IMLM algorithm. Only cloud-free
individual SCIAMACHY pixels, with instrument-noise related errors<1.5×1018cm−2have been averaged and re-gridded on a 1◦×1◦grid.
Right panel: Total columns as measured by the MOPITT instrument (from: NASA Langley Research Center Atmospheric Sciences Data Center). Only daytime measurements have been averaged.
the low CH4columns being due to smoke from forest fires
(see Sect. 4.1).
Well-known polluted areas, such as in Asia, are also clearly visible in Fig. 5 as regions with enhanced CO to-tal columns. Mountainous areas, such as the Himalayas and the Andes, show up in both the SCIAMACHY and MOPITT measurements as regions with low CO total columns. Large differences are also observed: the forest fires are more pro-nounced in the SCIAMACHY data than in the MOPITT mea-surements, and the retrieved SCIAMACHY total columns also show higher CO values over India and Eastern USA. Part of this difference may come from the fact that the MO-PITT measurements are less sensitive to the boundary layer resulting in lower CO total columns (Deeter et al., 2003). In this comparison, the difference in the averaging kernels for the MOPITT and SCIAMACHY instrument has not been taken into account. A more detailed comparison of these two sets of satellite measurements is currently planned in close collaboration with the National Center for Atmospheric Re-search (NCAR).
A somewhat more quantitative comparison of the IMLM CO total columns with MOPITT is shown in Fig. 6. This fig-ure is constructed in a similar way as Fig. 4 for CH4. It can
be seen that there is a good agreement between the two data sets for September 2003. Differences are generally within 10%, except for the region between∼0◦and∼15◦N where the differences are up to∼20%. This may be due to the rel-atively few data points in this area, due to clouds. The stan-dard deviation of the SCIAMACHY measurements is how-ever systematically larger than for the MOPITT data. Part of this may be due to retrieval errors and the rather loose con-straints on the signal-to-noise ratio, and part of this may be real: because of the larger sensitivity of SCIAMACHY to the boundary layer, a larger variability in the retrieved CO total columns from individual measurements is expected. A more detailed analysis will help to distinguish between these two.
As is the case for CH4, the other months in the
pe-riod September 2003–February 2004 show similar CO
✂✁ ✁
✁
✂✁
✁
✁
☞
Fig. 6.Comparison of the monthly averaged CO total columns for
September 2003, where all data within a five-degree latitude bin have been averaged. The black diamonds denote the IMLM CO total columns, the red diamonds the corresponding MOPITT data. Only pixels with a cloud-fraction<20% and instrument-noise re-lated errors<1.5×10¹⁸molec/cm2have been included. The error
bars denote the 1σ standard deviation of the data points averaged within each 5◦latitude bin. The MOPITT data are taken from the NASA Langley Research Center Atmospheric Sciences Data Cen-ter.
2376 A. M. S. Gloudemans et al.: SCIAMACHY’s impact on CH✂✁ ✁ 4and CO columns
☞ ☞
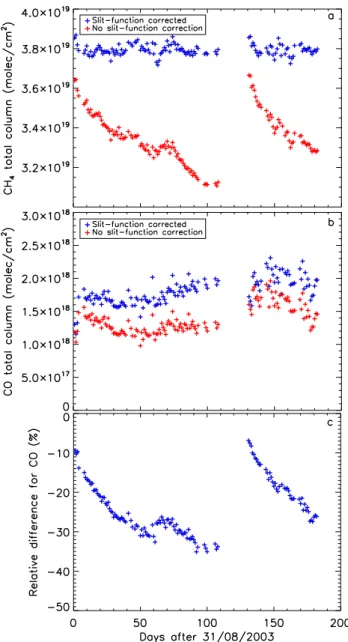
Fig. 7.Total columns averaged over the Sahara for each day in the
period September 2003–February 2004, with and without applying a correction for the broadening of the slit function due to ice growth on SCIAMACHY’s channel 8 detector (see Sect. 3). The gap be-tween day 108 and 131 corresponds to the December 2003 decon-tamination period. Note that here the whole Sahara is used, whereas the correction for the broadening of the slit function is based only on the central part of the Sahara between 20◦W and 20◦E.(a)The CH4total columns, normalized to the mean surface elevation of the
corresponding SCIAMACHY pixel and then averaged over the Sa-hara region. The trend seen in the CH4total columns without the slit-function correction resembles the loss in the total signal due to the ice growth in this period (Fig. 2). (b)The CO total columns. The columns without slit-function correction do not show a clear correlation with the decrease in the total signal for this period, but are nevertheless clearly affected by the broadening of the slit func-tion. (c)Relative difference of the CO total columns without and with applying a slit-function correction respectively, as shown in panel b. The difference in the CO total columns clearly increases as the ice layer becomes thicker.
5 Effects of instrument calibration on the retrieved total columns
5.1 Effects of the growing ice layer
The effect of the broadening of the slit function due to ice growth on SCIAMACHY’s channel 8 detector has been in-vestigated by performing retrievals with and without a cor-rection for the slit function. The applied corcor-rection varies from a few % to over 20% of the mean atmospheric signal, depending on the thickness of the ice layer. The resulting CH4 and CO total columns are shown on a daily basis in
Fig. 7, since the thickness of the ice layer varies strongly in time. In order to avoid influences of other time-dependent events, such as seasonal variation of CH4sources and sinks
or polluted areas, only the retrieved total columns over the Sahara are taken into account, since the CH4and CO
vari-ation due to atmospheric processes is expected to be low in this region (Houweling et al., 1999). Figure 7a shows the re-sults for CH4, where, for each day, the CH4total columns are
normalized to the mean surface elevation of the correspond-ing SCIAMACHY pixel and then averaged over the Sahara. Note that this is a larger area than that used to determine the correction for the slit function (see Sect. 3). The differ-ence between retrievals with and without slit-function cor-rection is clearly visible. The CH4total columns retrieved
with a correction for the slit function show an almost con-stant behaviour in time, in good agreement with calculations by the TM3 model. The trend in the CH4total columns for
retrievals without slit-function correction resembles the loss in the measured total signal for this period, corresponding to the growth of the ice layer (see Fig. 2). The differences between retrievals with and without correction for the slit function range from∼6% shortly after a decontamination to 17.5% four months later, in December 2003. Although this figure only shows results for the Sahara, the retrieved total columns for Australia show the same effect: the differences in the CH4 total columns increase from∼3% at 1
Septem-ber to 18% in DecemSeptem-ber 2003. The CH4total columns with
the correction for the slit function show good agreement with TM3 model calculations (see also Fig. 3).
Figure 7b shows the results for the retrieved CO total columns. A strong correlation with the loss in the measured total signal due to the growing ice layer, as is present for CH4, cannot be seen for CO, but Fig. 7c shows the
A. M. S. Gloudemans et al.: SCIAMACHY’s impact on CH4and CO columns 2377
☞ ☞ ☞
Fig. 8. The relative difference between the total columns retrieved without and with correction for the orbital variation of the dark signal
respectively, for each month between September 2003 and February 2004. The data shown are the monthly mean total columns averaged per 5◦latitude bin, between longitudes 30◦W and 60◦E.(a)The CH
4total columns, normalized to the mean surface elevation of the
corresponding SCIAMACHY pixel prior to averaging over a whole month of data. It is clearly seen that not correcting for the orbital variation of the dark signal leads to CH4columns that are up to∼4% higher on the Northern hemisphere compared to results including this
correction.(b)The CO total columns, showing an effect opposite to that for CH4.
the CO total columns over Australia instead of the Sahara, results in similar values. While the differences for CH4are
significantly larger than the current accuracy of the retrieved CH4 total columns of a few %, the differences for CO are
comparable to the current accuracy of the retrieved CO total columns (cf. Dils et al., 2005; Straume et al., 2005). How-ever, the clear trend in Fig. 7c strongly suggests that the pre-cision of the CO retrievals is much better than the current CO accuracy. Thus, although the correction for the slit func-tion may seem less important for CO than for CH4, Fig. 7
shows that the total columns of both species are significantly affected by the ice layer.
5.2 Effects of the dark signal orbital variation
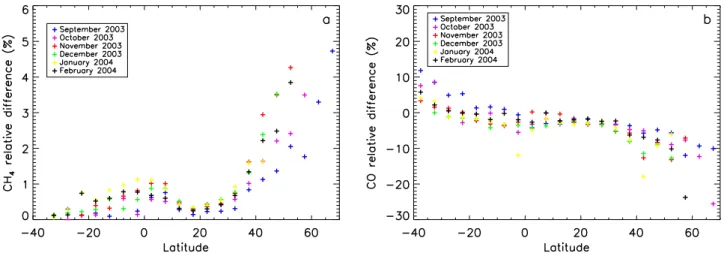
Although the orbital variation of the dark signal is much smaller than the slit-function correction, typically .2% of the measured atmospheric signal, it does have an effect on the retrieved columns, especially at Northern latitudes where the deviation of the actual dark signal from the measured dark signal reaches its largest values (Sect. 2). The effect of the variation of the dark signal over the orbit has been tested by performing retrievals with and without a correction for the orbital variation. This correction is taken from the data base set up by Kleipool (2004a). To demonstrate the effect of the orbital variation on the retrieved columns, monthly-averaged data have been investigated for the period September 2003– February 2004. Only the region between longitudes 30◦W and 60◦E has been investigated, since it has a good data cov-erage and large regions with high signal-to-noise ratio.
Since both the retrievals with and without correction for the orbital variation do include a correction for the slit
func-tion, which is much larger than the orbital variation itself, the two data sets should in principle not show a time-dependent behaviour due to the ice growth. This is true for the retrieved total columns including the correction for the orbital varia-tion, which is done on an orbital basis. However, some time dependency is expected for the retrieved total columns with-out the correction for the orbital variation. Firstly, the or-bital variation is linearly dependent on the measured signal, which decreases in time due to the ice growth. Secondly, the orbital variation is defined as a function of orbit phase, with orbit phase 0 corresponding to the start of the night side. Since phase 0 changes seasonally, this is expected to cause small time-dependent behaviour in the retrieved total columns without a correction for the orbital variation as a function of latitude. Therefore also the differences between the two data sets are expected to show some small time-dependent behaviour.
Figure 8a shows the relative differences between the monthly averaged CH4total columns without and with
cor-rection for the orbital variation respectively, in percentages of the retrievals with this correction. The results are shown as a function of latitude, where data within 5 degree latitude bins have been averaged prior to determining the differences. A clear increase in the relative difference can be seen towards Northern latitudes for all months, as expected. The differ-ence is&2% for latitudes&45◦N, and increases to
∼4–5%
at high Northern latitudes. This is a significant effect, since Fig. 4 showed typical differences between retrieved CH4and
TM3 calculations of.2% outside the region between∼5◦S and∼15◦N (see Sect. 4.1). Similar values for the accuracy of the CH4total columns are reported by Gloudemans et al.
2378 A. M. S. Gloudemans et al.: SCIAMACHY’s impact on CH4and CO columns
✁
Fig. 9. The effect of 1 dead pixel on the CH4retrievals for
or-bit 10067 on 2 February 2004. The y-axis shows the CH4total
columns when this dead pixel is not used in the retrievals. The x-axis shows the corresponding values when this pixel is included in the retrievals. The blue solid line denotes the expected 1:1 corre-lation. The deviation from the expected 1:1 correlation is different for each dead pixel (cf. Kleipool, 2004b).
The bump between ∼15◦S and ∼10◦N correlates well with the change in reflectance in this latitude range. Lower reflectances correspond to a lower signal level, resulting in a larger relative effect of the orbital variation, whereas higher signal levels result in a smaller effect. However, Fig. 8 shows that variations in the reflectance do not cause relative differ-ences of more than∼1%, which is much lower than the dif-ferences seen above∼45◦N. This strengthens the conclusion that the increase in the relative differences at high Northern latitudes are due to the increase in the dark signal over the or-bit. Some differences between the different months are vis-ible, but these are smaller than or comparable to the current accuracy of the CH4retrievals and are likely due to a
combi-nation of ice growth in time and the seasonal variation of the time of eclipse.
For CO, the effect of the orbital variation of the dark signal is not as evident as for CH4. In Fig. 8b, a decrease in the
rel-ative difference of the CO total columns without and with a correction for the orbital variation, can be seen towards higher latitudes for all months. However, the differences are generally within 15%, corresponding to the accuracy of the monthly-averaged retrieved CO total columns (Sect. 4.2 and Table 1). The apparent trend in the relative differences for CO is opposite to that for CH4(Fig. 8). This is
proba-bly due to the many CH4 lines in channel 8, which are
of-ten (partially) overlapping with the much weaker and scarcer CO lines. This requires the CO lines to be fitted simultane-ously with the CH4 lines, indicating that the retrieved CO
total columns may be influenced by the fit to the CH4lines in
a non-linear way. Higher CH4total columns may fill in part
of the CO absorption lines, leading to lower retrieved CO total columns, but lower CH4total columns do not
necessar-ily result in higher retrieved CO total columns as e.g. can be seen in Sect. 5.1. Although the effect of the orbital variation does not exceed the current accuracy of the retrieved CO to-tal columns, the clear trend seen for all six months strongly suggests that the precision of the CO retrievals is much bet-ter, as is also indicated by the slit-function effect in Sect. 5.1 and Fig. 7. Thus, it is important to also correct the CO total columns for the orbital variation.
5.3 Effects of the dead pixels
The previous sections show that both the orbital variation and the growth of the ice layer result in a systematic, time-dependent effect on the retrieved columns. The dead detec-tor pixels in SCIAMACHY’s channel 8 are not expected to result in systematic effects. Although the number of dead pixels increases in time due to radiation damage (Kleipool et al., 20052), the effect of dead pixels does not depend on their total number but on their spectral location. A pixel that does not sample (part of) an absorption line, is not expected to have an effect on the retrieved total columns, whereas a pixel that lies at the centre of an absorption line can affect the re-trievals in two different ways: it can affect the retrieved total columns of the corresponding molecule and/or the retrieved total column of a different species, since the absorption lines of all molecules are fitted simultaneously.
In the case of CO, only a few absorption lines are present in the wavelength range of channel 8. These lines are most of the time barely above the noise level, many times weaker than the (often overlapping) CH4lines in the same spectra.
Thus, even without dead pixels, retrieval of CO total columns from SCIAMACHY spectra is difficult. The presence of dead pixels and the corresponding loss of spectral informa-tion further complicates the CO retrievals. Unfortunately, a significant number of dead pixels are already located at or near the centre of CO lines. Therefore, there is a realistic possibility that an insufficient number of good detector pix-els is left to retrieve accurate CO total columns well before the end of SCIAMACHY’s life time.
On the other hand, the wealth of strong CH4 lines in the
wavelength range of SCIAMACHY’s channel 8, ensures that the CH4retrievals are not easily influenced by dead pixels, as
long as the dead pixels are not used when fitting the SCIA-MACHY spectrum. However, Fig. 9 shows that the CH4
re-trievals are affected significantly, when this is not done cor-rectly.
Thus, in order to perform accurate CO and CH4retrievals,
A. M. S. Gloudemans et al.: SCIAMACHY’s impact on CH4and CO columns 2379
Fig. 10.Effect of not removing 1 dead pixel on the retrieved CH4and CO total columns over Asia and the Middle East for February 2004.
(a)Monthly-averaged CH4total columns masking all dead pixels correctly. (b)Monthly-averaged CH4total columns omitting one dead
pixel in the pixel mask for a period of 12 orbits (∼0.85 day).(c)As panel a, but for CO.(d)As panel b, but for CO.
results in a slow but almost constant increase of dead pixels over time.
The second problem is that a significant number of bad detector pixels in channel 8 show regular jumps between two or more discrete levels of the dark current on timescales varying from less than∼1 second to several days or longer. This implies that for some pixels the dark current during the SCIAMACHY measurement on the day side may be signifi-cantly different from the reference dark current measured at the night side. The size of these jumps can vary from values comparable to the noise in the dark current measurements to values comparable to the dark current itself. These so-called Random Telegraph Signal (hereafter: RTS) pixels can only be detected if the dead pixel identification algorithm includes a statistical constraint.
In order to deal with this, an algorithm has been developed that derives a dead pixel mask from the instrument calibra-tion data for each orbit, which includes the physical charac-teristics of the detector pixels such as the dark signal. Then, a statistical method is used to filter out noise and to detect the so-called RTS pixels by including the information from the last 50 orbits, corresponding to∼3.5 days. This will en-sure that radiation-damaged pixels as well as RTS pixels are detected quickly and accurately.
The dead pixel mask used in the current retrievals only masks a pixel if its physical characteristics are bad for more than 25% of this period. This mask has been tested and works well: analyzing retrievals for a whole year, only a few dead pixels have been found that are not masked. For each of these pixels, this is only the case for a period of∼1 day, af-ter which each of them is masked correctly. Putting stronger constraints on the physical characteristics leads to a signif-icantly larger number of dead pixels, including pixels that are still performing reasonably, further complicating the re-trievals in channel 8. Therefore, it occasionally happens that a dead pixel does not appear in the pixel mask instantly, but only after∼1 day. The current dead pixel mask is still being checked regularly and the current constraints may have to be adapted over time, to maintain a good performance.
However, even missing one pixel in the dead pixel mask for such a short period can have a significant effect on the re-trievals. An example of this effect is shown for one such pixel, which is dead based on its physical quantities, but does not show up in the dead pixel mask until after ∼0.85 day or equivalently, 12 SCIAMACHY orbits. This pixel is located at the position of a CH4 line, but not near a CO
2380 A. M. S. Gloudemans et al.: SCIAMACHY’s impact on CH4and CO columns
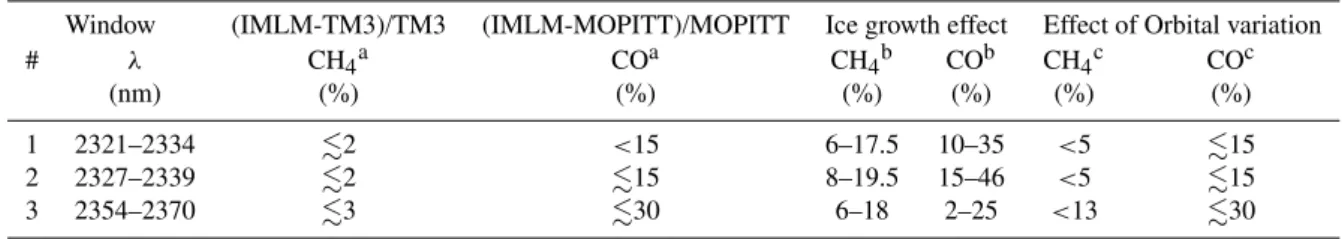
Table 1.Summary of retrieval results in different spectral windows.
Window (IMLM-TM3)/TM3 (IMLM-MOPITT)/MOPITT Ice growth effect Effect of Orbital variation # λ CH4a COa CH4b COb CH4c COc
(nm) (%) (%) (%) (%) (%) (%)
1 2321–2334 .2 <15 6–17.5 10–35 <5 .15 2 2327–2339 .2 .15 8–19.5 15–46 <5 .15 3 2354–2370 .3 .30 6–18 2–25 <13 .30
a For monthly-averaged total columns only. Differences for daily data are somewhat larger. b Based on daily averaged total columns over the Sahara (Sect. 5.1).
c Based on monthly-averaged total columns between 30◦W and 60◦E (Sect. 5.2).
February 2004, and then averaging all retrieved CH4and CO
total columns for that whole month. Comparing retrievals with and without masking this pixel clearly shows that it cre-ates artificially low CH4columns in some areas, but it may
not be that obvious that something is wrong from Fig. 10b only. Similarly, looking at Fig. 10d only, may lead to the conclusion that enhanced CO emission is seen over Iraq.
In this case, the retrievals of the individual orbits clearly indicate that something is wrong, by means of the large fit residuals. In fact, most of the time the few dead pixels that are missed are easily identified, since they cause large fit residuals and unrealistic values for the retrieved CH4and/or
CO total columns. However, a few cases have been found where a pixel with truly bad physical characteristics still gives good fit residuals. In particular, RTS pixels with a low noise level could display such a behaviour. Investigation of the effect of one such dead pixel, leads to similar results as seen in Fig. 10: enhanced CO emission is seen over India, which disappears when this pixel is masked out. In the un-likely case that such a pixel is missed by the dead pixel mask, a good way to detect such dead pixels is by comparing re-trievals from different wavelength ranges (see Sect. 5.4).
These results indicate that the identification of dead pix-els is best done by monitoring their physical behaviour, but inspecting the retrievals afterwards for strange anomalies re-mains important. Identification of dead pixels by means of fit residuals only appears insufficient and may lead to misin-terpretation of the results.
5.4 Effect of retrieval windows
The results presented in the previous sections are based on re-trievals in a single spectral window of SCIAMACHY’s chan-nel 8 between 2321–2334 nm (hereafter: window 1). Since this is not the only part of channel 8 that contains CO and/or CH4 absorption lines, two other spectral windows,
contain-ing both CH4and CO lines, have been investigated. The
re-sults for all three windows are summarized in Table 1. Window 2 covers the range 2327–2339 nm, and is cho-sen for the precho-sence of strong CO lines that are relatively
unaffected by the dead pixels. It overlaps partially with win-dow 1 which has been used so far and thus similar results are expected. Indeed, the retrieved CH4 total columns are
very similar to those from window 1, with monthly-averaged CH4results also differing from TM3 calculations by.2%.
Comparisons of monthly-averaged CO results with MOPITT measurements show a good agreement between the two data sets, with differences within∼15%.
The differences between retrievals with and without cor-rection for the slit function vary between∼8% and∼19.5% for CH4 and between∼15% and∼46% for CO. This may
suggest a slightly thicker ice layer in this wavelength range compared to window 1.
The effect of the orbital variation of the dark signal is also similar to that in window 1, i.e. relative differences of up to
∼4–5% for CH4 and up to∼15% for CO at high Northern
latitudes.
Window 3 ranges from 2354–2370 nm. This window is similar to the spectral range used by Buchwitz et al. (2004a) and contains CO lines from theP-branch, whereas the other windows containR-branch CO lines. The monthly-averaged CH4total columns compare well with TM3 calculations and
with results from the other two windows, although the dif-ferences with TM3 of.3% on the Southern Hemisphere are slightly larger than for window 1 and 2, and the deviation from TM3 seems to increase somewhat for high Northern latitudes. Comparisons of monthly-averaged CO results with MOPITT measurements result in deviations of∼30%, larger than for the other two windows. Here, the retrieved CO total columns are mostly lower than those from MOPITT, whereas window 1 shows total columns somewhat larger and window 2 somewhat lower than MOPITT.
The effect of the broadening of the slit function due to the growing ice layer ranges from∼6% to∼18% for CH4
in window 3, comparable to that of the other two windows. Although the atmospheric signal in this wavelength range is lower than in the other two windows, the slit-function broadening causes a relative effect on the CH4total column,
of a strong CO line, causes the retrieval algorithm to give a wrong fit to the remaining detector pixels containing parts of the other CO lines. This probably explains the low retrieved CO total columns for window 3.
The effect of the orbital variation of the dark signal in win-dow 3 is larger than in the other winwin-dows and can be up to ∼13% for CH4at high Northern latitudes. For CO, the effect
is also larger than in the other windows, up to∼30%, increas-ing towards Northern latitudes, whereas it is decreasincreas-ing for the other windows. As for the other windows, the relative dif-ference for CO is comparable to the accuracy of the CO total columns, making the effect of the orbital variation less pro-nounced for CO than for CH4. The larger effect of the orbital
variation and the increasing differences for CO are probably due to the lower atmospheric signal in this wavelength range compared to the other windows (see Fig. 1). The lower signal introduces a larger effect on the retrieved total columns from window 3 for calibration issues with wavelength independent behaviour. The absolute values of the orbital variation of the dark signal show only a weak dependency on wavelength, thus explaining the larger relative differences in window 3. The lower atmospheric signal in window 3 also requires a better calibration, and thus the retrieved CH4 and CO total
columns may suffer from larger uncertainties. In addition, the dead pixels may play a role for CO in this window.
The number of dead pixels in all three windows are com-parable, but it depends on the spectral location of these pixels whether the retrievals in one window give better results than in the other. The good agreement of the retrieved CH4total
columns in all three windows gives some indication that in terms of dead pixels no window is preferred over another for the considered time period, and that no dead pixels that are important for the CH4retrievals are missed by the dead pixel
mask. For CO, it seems that window 3 is preferred less than window 1 and 2, but using only part of window 3 results in CO total columns that are more in agreement with the results from the other two windows. This is due to a strong H2O line
overlapping with one of the stronger CO lines in this win-dow. All three windows contain strong H2O absorptions, but
it depends on the position of the lines whether they will in-fluence the retrieved CO and CH4total columns. In general
there is a good correlation between the retrieved H2O total
columns from different spectral windows, but there are cases with substantial differences too. This can also influence the retrieved total columns, especially for CO. Thus, using dif-ferent windows in SCIAMACHY’s channel 8 seems a good way to verify the retrieved CH4 and CO total columns and
thus improve their accuracy.
account. The nature of each of these effects is different. Whereas the effect of the growing ice layer varies strongly on the order of days, the effect of the orbital variation of the dark signal shows almost no time dependency. Also, both the growing ice layer and the orbital variation cause systematic effects in the retrieved CH4and CO total columns, whereas
the effect of the dead pixels is rather unpredictable: some dead pixels show a random effect, some more systematic, and others no effect at all. Applying accurate corrections for these instrument calibration problems significantly improves the retrieved CH4and CO total columns.
Although the instrument calibration problems discussed in this paper have the largest impact on the retrieved total columns in SCIAMACHY’s channel 8, additional smaller problems exist. As mentioned in Sect. 2, the dark signal decreases in time due to the growing ice layer and is cur-rently measured for every SCIAMACHY orbit. However, the dark signal measurements are not available for every orbit for which SCIAMACHY data is present, due to in-complete data distribution and different versions of the dis-tributed data. This may lead to small inaccuracies in the re-trieved total columns, especially right after decontamination, when the dark signal is dropping fastest due to the ice growth. These are not expected to be larger than a few percent, which is within the current accuracy of the retrieved CH4and CO
columns. Another possible error source is the non-linearity as reported by Kleipool (2003b). For channel 8 this effect is small and errors in the retrieved total columns of less than a few percent are expected. A more detailed calculation of these effects will be provided in a future paper. The instru-ment calibration issues instru-mentioned in this paper apply to both SCIAMACHY’s channels 7 and 8. Channel 7 also suffers from an additional serious problem, caused by a light leak.
In Sects. 5.3 and 5.4 it is mentioned that comparison of re-trievals in different wavelength ranges gives additional infor-mation on the accuracy of the retrieved total columns. Here, only retrievals in SCIAMACHY’s channel 8 have been dis-cussed. For CH4, useful independent information can also be
derived from SCIAMACHY’s only other near-infrared chan-nel 6, which covers the wavelength range 1000–1750 nm. This channel does not have an ice layer on its detector, and is not hampered by the orbital variation of the dark signal, due to the much higher atmospheric signal in this wavelength range. However, the spectral window containing CH4lines
contains more dead pixels than in channel 8, non-linearity plays an important role, and scattering in the atmosphere complicates the retrieval. Nevertheless, CH4 total column
2382 A. M. S. Gloudemans et al.: SCIAMACHY’s impact on CH4and CO columns
7 Conclusions
In this paper, the effects of three important instrument cal-ibration issues on the retrieved CH4 and CO total columns
from SCIAMACHY’s channel 8 are discussed: the broaden-ing of the slit function due to the growbroaden-ing ice layer on the detector, the variation of the dark signal over the orbit, and the dead detector pixels. The main conclusions are as fol-lows:
– The CH4 and CO total columns retrieved with the
IMLM retrieval algorithm, including corrections for all known instrument calibration issues, compare well with calculations from the atmospheric chemistry transport model TM3 and independent measurements from the MOPITT instrument on board the EOS-TERRA satel-lite.
– The slit-function broadening due to the growing ice layer causes a time-dependent systematic effect on both the CH4and CO total columns. For CH4, this effect is
much larger than the precision of∼1–2% required to detect CH4sources and sinks. The clear trend seen for
CO, corresponds well with the loss in the total signal, indicating that also CO is significantly affected.
– The orbital variation of the dark signal also causes a systematic effect, but has only a small time dependency. This effect is much smaller than the effect of the slit function, but is still significant for both CH4 and CO,
especially at high Northern latitudes.
– The effect of the dead pixels on the retrieved total columns is unpredictable and depends on the spectral position of each individual dead pixel. Therefore, this effect is difficult to quantify in a general sense. An accu-rate algorithm which identifies the dead pixels for every orbit is required in order to avoid misinterpretation of the retrieved total columns. The dead pixel mask used in the IMLM retrieval is based on the physical charac-teristics of the detector pixels and works well. Nev-ertheless, inspecting the fit residual remains important since it provides additional information. However, a dead pixel mask based on fit residuals only is insuffi-cient.
– Retrievals in different wavelength ranges within SCIA-MACHY’s channel 8 give similar results for CH4, but
show some differences for CO. This is probably due to the scarcity and weakness of the CO lines in combina-tion with the dead pixels, which complicates the CO re-trievals significantly.
– Comparison of retrievals in different wavelength ranges provides a useful tool to detect imperfections in the ap-plied instrument calibration corrections and helps to im-prove the quality of the retrieved total columns.
Acknowledgements. The authors would like to thank the SCIA-MACHY and ENVISAT teams who have participated in the planning, building, launching, and operating of the SCIAMACHY instrument. They thank the Netherlands SCIAMACHY Data Cen-ter (NL-SCIA-DC) for providing us data and processing services. They also thank R. Hoogeveen, S. Houweling, and A. Maurellis at SRON for useful discussions. The MOPITT data presented in this paper were obtained from the NASA Langley Research Center Atmospheric Sciences Data Center. The work performed for this publication is (partly) financed by the Netherlands Agency for Aerospace Programmes (NIVR) and the European Commission (Fifth Framework Programme on Energy, Environment, and Sustainable Development, Contract no. EVG-1-CT-2002-00079, project EVERGREEN).
Edited by: H. Kelder
References
Barret, B. , Turquety, S., Hurtmans, D., et al.: Global carbon monoxide vertical distributions from spaceborne high-resolution FTIR nadir measurements, Atmos. Chem. Phys. Discuss., 5, 4599–4639, 2005,
SRef-ID: 1680-7375/acpd/2005-5-4599.
Beer, R., Glavich, T. A., and Rider, D. M.: Tropospheric emission spectrometer for the Earth Observing System’s Aura satellite, Applied Optics, 40, 2356–2367, 2001.
Buchwitz, M. and Burrows, J. P.: Retrieval of CH4, CO, and CO2
total column amounts from SCIAMACHY near-infrared nadir spectra: Retrieval algorithm and first results, in Remote Sens-ing of Clouds and the Atmosphere VIII, edited by: Sch¨afer, K. P., Com`eron, A., Carleer, M. R., and Picard R. H., Proceedings of SPIE, 5235, 375–388, 2004.
Buchwitz, M., de Beek, R., Bramstedt, K., et al.: Global carbon monoxide as retrieved from SCIAMACHY by WFM-DOAS, At-mos. Chem. Phys., 4, 1945–1960, 2004a,
SRef-ID: 1680-7324/acp/2004-4-1945.
Buchwitz, M., de Beek, R., Burrows J. P., et al.: Atmospheric methane and carbon dioxide from SCIAMACHY satellite data: initial comparison with chemistry and transport models, Atmos. Chem. Phys., 5, 941–962, 2005,
SRef-ID: 1680-7324/acp/2005-5-941.
Buchwitz, M., de Beek, R., No¨el, S., et al.: Carbon monox-ide, methane and carbon dioxide columns retrieved from SCIA-MACHY by WFM-DOAS: year 2003 initial data set, Atmos. Chem. Phys. Discuss., 5, 1943–1971, 2005,
SRef-ID: 1680-7375/acpd/2005-5-1943.
Clerbaux, C., Hadji-Lazaro, J., Turquety, S., M´egie, G., Coheur, P.-F.: Trace gas measurements from infrared satellite for chemistry and climate applications, Atmos. Chem. Phys., 3, 1495–1508, 2003,
SRef-ID: 1680-7324/acp/2003-3-1495.
Deeter, M. N., Emmons, L. K., Francis, G. L., et al.: Operational carbon monoxide retrieval algorithm and selected results for the MOPITT instrument, J. Geophys. Res., 108, D14, 4399–4409, 2003.
mos. Chem. Phys., 3, 73–88, 2003,
SRef-ID: 1680-7324/acp/2003-3-73.
Dils, B., de Mazi`ere, M., Blumenstock, T., et al.: Comparisons between SCIAMACHY and ground-based FTIR data for total columns of CO, CH4, CO2, and N2O, Atmos. Chem. Phys.
Dis-cuss., 5, 2677–2717, 2005,
SRef-ID: 1680-7375/acpd/2005-5-2677.
Drummond, J. R. and Mand, G. S.: The Measurements of Pollu-tion in the Troposphere (MOPITT) Instrument: Overall Perfor-mance and Calibration Requirements, Journal of Atmospheric and Oceanic Technology, 13, 314, 1996.
Ehret, G. and Kiemle, C.: Requirements Definition for Future DIAL Instruments, Final Report, ESA RFQ reference: IMT-CSO/FF/fe/03.887; RFQ/3-10880/03/NL/FF, DLR reference: 3 472 749, DLR, 2005.
Frankenberg, C., Platt, U., and Wagner, T.: Retrieval of CO from SCIAMACHY onboard ENVISAT: detection of strongly pol-luted areas and seasonal patterns in global CO abundances, At-mos. Chem. Phys., 5, 1639–1644, 2005a,
SRef-ID: 1680-7324/acp/2005-5-1639.
Frankenberg, C., Platt, U., and Wagner, T.: Iterative maximum a posteriori (IMAP)-DOAS for retrieval of strongly absorbing trace gases: Model studies for CH4and CO2retrieval from near
infrared spectra of SCIAMACHY onboard ENVISAT, Atmos. Chem. Phys., 5, 9–22, 2005b,
SRef-ID: 1680-7324/acp/2005-5-9.
Frankenberg, C., Meirink, J. F., van Weele, M., Platt, U., and Wag-ner, T.: Assessing Methane Emissions from Global Space-Borne Observations, Science (Science Express 17 March 2005), 2005c. Gloudemans, A. M. S., Schrijver, H., Straume, A. G., et al.: CH4
and CO total columns from SCIAMACHY: Comparisons with TM3 and MOPITT, in Proc. Second Workshop on Atmospheric Chemistry Validation of ENVISAT (ACVE-2), ESA/ESRIN, Frascati, Italy, 3–7 May 2004 (ESA SP-562, August 2004), ESC02AG, 2004.
well can point measurements be reproduced by a global model?, J. Geophys. Res., 105, d7, 8981–9002, 2000.
Kleipool, Q.: SCIAMACHY SODAP: Algorithm Specification for Dark Signal Determination, Tech. Report SRON-SCIA-PhE-RP-009, SRON, 2003a.
Kleipool, Q.: SCIAMACHY: Recalculation of OPTEC5 Non-Linearity, Tech. Report SRON-SCIA-PhE-RP-013, SRON, 2003b.
Kleipool, Q.: SCIAMACHY: Orbital Variation of dark signal, Tech. Report SRON-SCIA-PhE-RP-18, SRON, 2004a.
Kleipool, Q.: SCIAMACHY: Evolution of Dead and Bad Pixel Mask, Tech. Report SRON-SCIA-PhE-RP-21, SRON, 2004b. Krijger, J. M., Aben, I., and Schrijver, H.: Distinction between
clouds and ice/snow covered surfaces in the identification of cloud-free observations using SCIAMACHY PMDs, Atmos. Chem. Phys. Discuss., 5, 815–845, 2005,
SRef-ID: 1680-7375/acpd/2005-5-815.
Lichtenberg, G. F., Kleipool, Q., Krijger, J. M., et al.: SCIA-MACHY Level1 data: Calibration concept and in-flight calibra-tion, Atmos. Chem. Phys. Discuss., 5, in press, 2005.
Rodgers, C. D.: Inverse Methods for Atmospheric Sounding, World Scientific, London, 2000.
Schrijver, H.: Retrieval of carbon monoxide, methane and nitrous oxide from SCIAMACHY measurements, in Proc. ESAMS, Eu-ropean Symposium on Atmospheric Measurements from Space, ESA WPP-161 1, ESTEC, Noordwijk, The Netherlands, 285– 294, 1999.