Open Access
Research article
Evaluation of two methods for computational HLA haplotypes
inference using a real dataset
Bruno F Bettencourt
1,2, Margarida R Santos
1,2, Raquel N Fialho
1,2,
Ana R Couto
1,2, Maria J Peixoto
1,2, João P Pinheiro
1,2, Hélder Spínola
3,
Marian G Mora
4, Cristina Santos
5, António Brehm
3and Jácome
Bruges-Armas*
1,2Address: 1Hospital Santo Espírito de Angra do Heroísmo, SEEBMO, Angra do Heroísmo, Azores, Portugal, 2Genetics & Arthritis Research Group
(GARG), Institute for Molecular and Cell Biology (IBMC), University of Porto, Porto, Portugal, 3University of Madeira, Campus of Penteada,
Funchal, Madeira, Portugal, 4Hospital Universitário de Canarias, Tenerife, Canarias, Spain and 5Center of Research in Natural Resources (CIRN)
and Department of Biology, University of The Azores, Campus of Ponta Delgada, Ponta Delgada, Azores, Portugal
Email: Bruno F Bettencourt - [email protected]; Margarida R Santos - [email protected]; Raquel N Fialho - [email protected]; Ana R Couto - [email protected]; Maria J Peixoto - [email protected]; João P Pinheiro - [email protected];
Hélder Spínola - [email protected]; Marian G Mora - [email protected]; Cristina Santos - [email protected]; António Brehm - [email protected]; Jácome Bruges-Armas* - [email protected]
* Corresponding author
Abstract
Background: HLA haplotype analysis has been used in population genetics and in the investigation of disease-susceptibility locus, due to its high polymorphism. Several methods for inferring haplotype genotypic data have been proposed, but it is unclear how accurate each of the methods is or which method is superior. The accuracy of two of the leading methods of computational haplotype inference – Expectation-Maximization algorithm based (implemented in Arlequin V3.0) and Bayesian algorithm based (implemented in PHASE V2.1.1) – was compared using a set of 122 HLA haplotypes (A-B-Cw-DQB1-DRB1) determined through direct counting. The accuracy was measured with the Mean Squared Error (MSE), Similarity Index (IF) and Haplotype Identification Index (IH).
Results: None of the methods inferred all of the known haplotypes and some differences were observed in the accuracy of the two methods in terms of both haplotype determination and haplotype frequencies estimation. Working with haplotypes composed by low polymorphic sites, present in more than one individual, increased the confidence in the assignment of haplotypes and in the estimation of the haplotype frequencies generated by both programs.
Conclusion: The PHASE v2.1.1 implemented method had the best overall performance both in haplotype construction and frequency calculation, although the differences between the two methods were insubstantial. To our knowledge this was the first work aiming to test statistical methods using real haplotypic data from the HLA region.
Published: 29 January 2008
BMC Bioinformatics 2008, 9:68 doi:10.1186/1471-2105-9-68
Received: 21 August 2007 Accepted: 29 January 2008
This article is available from: http://www.biomedcentral.com/1471-2105/9/68 © 2008 Bettencourt et al; licensee BioMed Central Ltd.
Background
The Human Leukocyte Antigen (HLA) is a highly poly-morphic gene cluster located on the Major Histocompati-bility Complex (MHC) on the chromosome 6 (6p21) [1]. The MHC has an extension of 3.5 megabases and contains over 200 genes divided into three sub-regions: Class I (1800 kb), Class II (800 kb) and Class III (1100 kb) [1]. The HLA genes are the most polymorphic group known in the human genome. Their high rate heterozygosity is the result of the presence of three genes encoding classical MHC Class I and three or four gene sets for the classical MHC Class II molecules, on each chromosome. The cells express at least three different MHC proteins, decreasing the chance of each individual being homozygous at all these three loci [2]. Another important feature of HLA genes is the presence of Linkage Disequilibrium (LD) between the alleles of the different loci. Despite the large number of alleles at each expressed loci, the number of haplotypes observed in populations is smaller than the expected. This fact indicates that certain HLA alleles tend to occur together in the same haplotype rather than ran-domly segregating together [3,4].
HLA haplotype analysis has been used for disease-suscep-tibility locus identification and for a better knowledge of many other processes such as population genetics, due to its relation with immune response and high polymorphic rate [5,6].
Molecular haplotyping is expensive and laborious. On family-based studies, the genotyping of the relatives of each studied subject is required to establish phases. For other population-based studies there are several molecu-lar methods available that allow a correct construction of the haplotypes [5]. Allele-specific polymerase chain reac-tion (AS-PCR) [7] and somatic cell hybrids [8], are two of the most used molecular methods for an unambiguously determination of haplotypes on relatively small popula-tion studies [5]. The use of statistical methods is a less expensive and time-consuming approach for the inference of haplotypes from a large population genotypic dataset [9]. Several statistical methods have been proposed, but it is unclear how accurate each method is for haplotype esti-mation on HLA genes.
The most commonly used approach, estimating HLA allele and haplotype frequencies, is the expectation-maxi-mization (EM) algorithm [10]. EM algorithms support complex datasets including large number of individuals with ambiguous haplotypes, since they make an initial guess of the haplotype frequencies [5]. EM-based haplo-type frequency estimates can accommodate several loci with an arbitrary number of alleles. However, analysis of a large number of loci can result in a exponentially grow-ing computgrow-ing time. Furthermore, most reports on the use
of EM methods have not provided information on the validity of the estimates, nor on the influence on estima-tion accuracy of populaestima-tion genetic factors, such as depar-tures from Hardy-Weinberg equilibrium (HWE) and the actual haplotype frequency [11]. The Arlequin V3.0 soft-ware [12] integrates several basic and advanced methods for population genetics data analysis, using the EM algo-rithm to estimate maximum likelihood (ML) haplotype frequencies.
Another alternative is the application of Bayesian meth-ods that incorporate prior expectations based upon popu-lation genetic principles [13,14]. Using a wide variety of real and simulated data sets it was demonstrated that Bayesian algorithm is robust to the violation of HWE, to the presence of missing data, and to occurrences of recom-bination hotspots [15]. The program PHASE v2.1.1 [13,14] implements a Bayesian statistical method and par-tition-ligation for reconstructing haplotypes from popula-tion genotype data.
In this study the accuracy of two of the leading methods of computational haplotype inference – EM algorithm based implemented in Arlequin V3.0 and Bayesian algo-rithm based implemented in PHASE v2.1.1 was compared for a data set composed of 61 unrelated families phase-known HLA haplotypes (A; B; Cw; HLA-DQB1; HLA-DRB1).
Results
Identification of the real HLA haplotypes
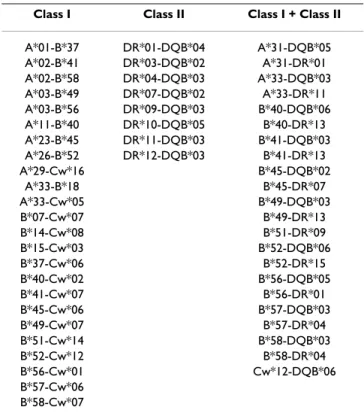
All the 5 loci and haplotypes were in HWE. The analysis of all pairs of alleles at different loci revealed the presence of 54 haplotypes (Table 1) in complete LD (|D'| = 1). As shown in Table 1, there were 24 pairs of Class I alleles, 8 pairs of Class II alleles and 22 pairs of Class I plus Class II alleles, all with |D'| = 1.
One hundred different extended haplotypes were identi-fied (A-B-Cw-DQB-DRB). After splitting the extended haplotypes into Class I (A-B-Cw) and Class II (DQB-DRB), 47 and 18 real haplotypes were observed respec-tively. Fifty haplotypes with frequencies above 0.01 were found; 15 Class II (Table 2), 21 Class I (Table 3) and 14 extended haplotypes (Table 4).
Computational estimation of the HLA haplotypes
The five runs performed with both PHASE v2.1.1 and Arlequin V3.0 gave the same HLA haplotype results, despite using different random sample groups.
Variable number of loci
overall decrease in the similarity index (IF) as the number of analyzed loci increased (Fig 1-A). Arlequin V3.0 had the highest IF value for Class II haplotypes (2 loci – 0.988), which was close to its maximal value. PHASE v2.1.1
results showed lower values than Arlequin V3.0, also decreasing as the number of loci increased. However, PHASE v2.1.1 had a higher IF value than Arlequin V3.0, 0.714 and 0.708 respectively (Figure 1-a) when the analy-sis of five loci haplotypes was performed.
The IH value of both methods for Class II haplotypes was
0.971 (Figure 1-b). Lower results were observed with the three loci haplotypes (PHASE v2.1.1: 0.683; Arlequin V3.0: 0.785). PHASE v2.1.1 registered the highest IH val-ues obtained for the five loci haplotypes.
The mean squared error (MSE) increased as the number of loci was increased from two to three. The highest values were obtained with three loci haplotypes, decreasing again with five loci haplotypes (Figure 1-c). The same fig-ure shows that MSE values for Arlequin V3.0 were always higher than PHASE v2.1.1, and that the discrepancy between these methods was more evident as the number of analyzed loci increased.
Variable number of samples
In order to investigate the performance of both methods with different sample sizes, four different randomly selected groups of samples (30, 40, 50 and 60 samples) with different sizes were defined for each one of the five runs performed. These groups of samples were investi-gated with both methods, and the results of the estima-tion accuracy measures are shown in Figure 2.
Table 1: Pairs of alleles at HLA different loci, with complete LD (|D'| = 1) (n = 61 individuals)
Class I Class II Class I + Class II
A*01-B*37 DR*01-DQB*04 A*31-DQB*05 A*02-B*41 DR*03-DQB*02 A*31-DR*01 A*02-B*58 DR*04-DQB*03 A*33-DQB*03 A*03-B*49 DR*07-DQB*02 A*33-DR*11 A*03-B*56 DR*09-DQB*03 B*40-DQB*06 A*11-B*40 DR*10-DQB*05 B*40-DR*13 A*23-B*45 DR*11-DQB*03 B*41-DQB*03 A*26-B*52 DR*12-DQB*03 B*41-DR*13 A*29-Cw*16 B*45-DQB*02
A*33-B*18 B*45-DR*07 A*33-Cw*05 B*49-DQB*03 B*07-Cw*07 B*49-DR*13 B*14-Cw*08 B*51-DR*09 B*15-Cw*03 B*52-DQB*06 B*37-Cw*06 B*52-DR*15 B*40-Cw*02 B*56-DQB*05 B*41-Cw*07 B*56-DR*01 B*45-Cw*06 B*57-DQB*03 B*49-Cw*07 B*57-DR*04 B*51-Cw*14 B*58-DQB*03 B*52-Cw*12 B*58-DR*04 B*56-Cw*01 Cw*12-DQB*06 B*57-Cw*06
B*58-Cw*07
Table 2: HLA Class II haplotype (2 loci) frequencies above 0.01 determined by direct counting and computational methods (n = 61 individuals)
Correct Haplotypes Haplotype Frequency
Real Arlequin V3.0 PHASE v2.1.1
1 DQB1*03-DRB1*04 0.164 0.164 0.163
2 DQB1*02-DRB1*07 0.148 0.148 0.146
3 DQB1*05-DRB1*01 0.139 0.139 0.139
4 DQB1*03-DRB1*11 0.123 0.123 0.122
5 DQB1*06-DRB1*15 0.074 0.074 0.074
6 DQB1*06-DRB1*13 0.074 0.073 0.072
7 DQB1*02-DRB1*03 0.074 0.074 0.073
8 DQB1*04-DRB1*08 0.041 0.041 0.041
9 DQB1*05-DRB1*15 0.025 0.025 0.025
10 DQB1*03-DRB1*13 0.025 0.033 0.031
11 DQB1*05-DRB1*10 0.025 0.025 0.024
12 DQB1*05-DRB1*14 0.016 0.016 0.014
13 DQB1*02-DRB1*13 0.016 0.008 0.010
14 DQB1*03-DRB1*12 0.016 0.016 0.016
15 DQB1*03-DRB1*09 0.016 0.016 0.016
IF 0.992 0.989
IH 1.000 1.000
Despite increasing the number of samples, both methods exhibited a small range of variation in the IF value (Figure 2-a). Arlequin V3.0 showed the same IF with 30 or 60 sam-ples (0.709), although a small reduction of this value was obtained with 40 or 50 individuals (0.675). Different results were obtained with IH Arlequin V3.0 values (Fig.
2-b). IH decreased when the sample size was increased from 30 to 40 individuals (0.611 to 0.517), increasing again when the test was performed with 40 to 60 individuals (the highest difference was obtained from 50 to 60 – 0.523 and 0.620 respectively).
PHASE v2.1.1 analysis reported smaller IF values than Arlequin V3.0 with 30 samples (0.690), but after increas-ing the sample size the values obtained were always higher than Arlequin V3.0 (Figure 2-b).
The MSE of Arlequin V3.0 for 30 samples was 1 order of magnitude lower than the registered by PHASE v2.1.1 (Figure 2-c). When the sample value was increased from 30 to 40 individuals the Arlequin V3.0's MSE increased from 2.1E-05 to 1.5E-04, while in PHASE v2.1.1 this value
decreased from 2.2E-04 to 9.8E-05. Both methods showed an overall decrease when samples where higher than 40 individuals, although PHASE v2.1.1 had the best MSE val-ues.
Haplotypes with frequencies above 0.01
There was 100% concordance between real Class II haplo-type phases (2 loci) and those predicted computationally by both methods (Table 2). The IF values were 0.992 for Arlequin V3.0 and 0.989 for PHASE v2.1.1, which were both close to its maximal value. Within the two loci hap-lotype analysis, PHASE v2.1.1 MSE value was lower than Arlequin V3.0, despite the maximum IH value reported by both methods.
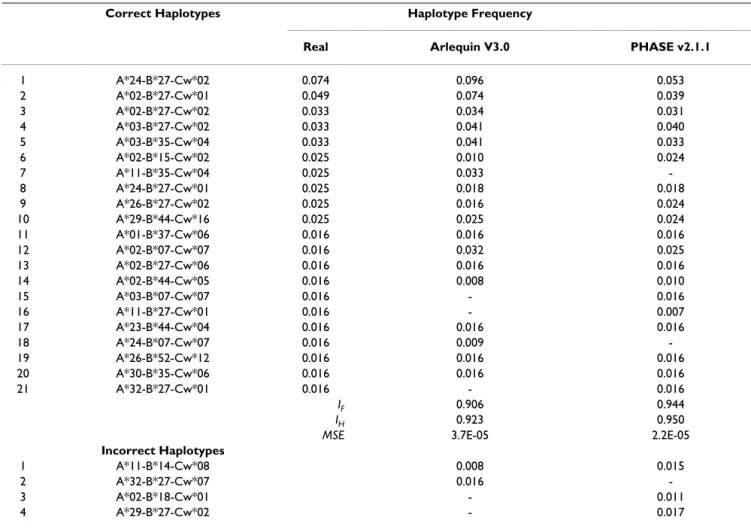
IF results were lower with Arlequin V3.0 than PHASE v2.1.1 (0.906 and 0.944 respectively) for the 3 loci haplo-types (Class I). Although Arlequin V3.0 generated 18 out of 21 real Class I haplotypes, it also created 2 incorrect haplotypes with frequencies above 0.01 (Table 3). PHASE v2.1.1 was more effective and accurate in haplotype con-struction, as well as in frequency estimation, thus present-Table 3: HLA Class I haplotype (3 loci) frequencies above 0.01 determined by direct counting and computational methods (n = 61 individuals)
Correct Haplotypes Haplotype Frequency
Real Arlequin V3.0 PHASE v2.1.1
1 A*24-B*27-Cw*02 0.074 0.096 0.053
2 A*02-B*27-Cw*01 0.049 0.074 0.039
3 A*02-B*27-Cw*02 0.033 0.034 0.031
4 A*03-B*27-Cw*02 0.033 0.041 0.040
5 A*03-B*35-Cw*04 0.033 0.041 0.033
6 A*02-B*15-Cw*02 0.025 0.010 0.024
7 A*11-B*35-Cw*04 0.025 0.033
-8 A*24-B*27-Cw*01 0.025 0.018 0.018
9 A*26-B*27-Cw*02 0.025 0.016 0.024
10 A*29-B*44-Cw*16 0.025 0.025 0.024
11 A*01-B*37-Cw*06 0.016 0.016 0.016
12 A*02-B*07-Cw*07 0.016 0.032 0.025
13 A*02-B*27-Cw*06 0.016 0.016 0.016
14 A*02-B*44-Cw*05 0.016 0.008 0.010
15 A*03-B*07-Cw*07 0.016 - 0.016
16 A*11-B*27-Cw*01 0.016 - 0.007
17 A*23-B*44-Cw*04 0.016 0.016 0.016
18 A*24-B*07-Cw*07 0.016 0.009
-19 A*26-B*52-Cw*12 0.016 0.016 0.016
20 A*30-B*35-Cw*06 0.016 0.016 0.016
21 A*32-B*27-Cw*01 0.016 - 0.016
IF 0.906 0.944
IH 0.923 0.950
MSE 3.7E-05 2.2E-05
Incorrect Haplotypes
1 A*11-B*14-Cw*08 0.008 0.015
2 A*32-B*27-Cw*07 0.016
-3 A*02-B*18-Cw*01 - 0.011
ing the best MSE value of the two methods, as shown on Table 3. Despite having a better MSE value (Table 3), PHASE v2.1.1 generated 3 incorrect haplotypes, one more than Arlequin V3.0.
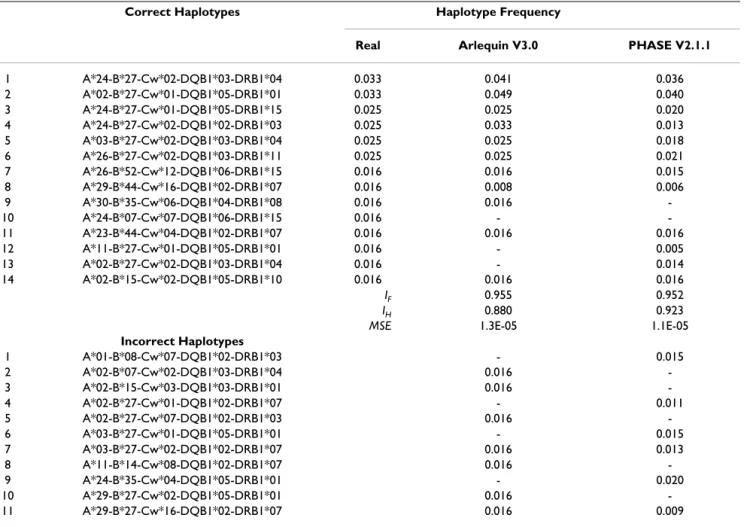
Regarding the 5 loci haplotypes (Table 4), PHASE v2.1.1 had a more favourable MSE (1.1E-05, versus Arlequin V3.0's 1.3E-05), and a better performance in IH (0.923, versus Arlequin V3.0's 0.880). Moreover, PHASE v2.1.1 presented 6 incorrect 5 loci haplotypes (with frequencies above 0.01), one less than Arlequin V3.0. The IF value was
similar between Arlequin V3.0 and PHASE v2.1.1 (0.955 and 0.952 respectively) showing that both methods had a high accuracy on extended haplotypes estimation (Table 4). One of the incorrect haplotypes generated by PHASE v2.1.1 showed a frequency of 0.02, but in general this soft-ware estimated lower frequencies for the incorrect haplo-types that were generated by both methods. In this group of haplotypes (5 loci) the number of possible combina-tions between the alleles of the various loci increased due to the increase of the polymorphic rate but the number of
real haplotypes decreased when compared to the 3 loci haplotypes with frequencies above 0.01.
Discussion
We have tested the effectiveness and accuracy of two com-putational algorithms to estimate haplotype frequencies and to predict haplotype phases using real HLA haplo-typic data. To our knowledge this was the first work aim-ing to test statistical methods usaim-ing haplotypic data from the HLA region, characterized by a high rate of polymor-phic sites and LD.
Contrasting with the findings of Xu et al. [16], the decrease in accuracy of both methods occurred when LD rate between the alleles increased. Both methods regis-tered a higher decrease in the IF value from 2 to 3 loci than from 3 to 5 loci (Figure 1-a), suggesting that the presence of HLA-B was the main factor influencing the algorithms' performance. This finding was confirmed when the number of individuals varied within the 5 loci haplotypes (A-B-Cw-DQB-DRB) (Figure 2).
Table 4: Extended HLA haplotype (5 loci) frequencies above 0.01 determined by direct counting and computational methods (n = 61 individuals)
Correct Haplotypes Haplotype Frequency
Real Arlequin V3.0 PHASE V2.1.1
1 A*24-B*27-Cw*02-DQB1*03-DRB1*04 0.033 0.041 0.036 2 A*02-B*27-Cw*01-DQB1*05-DRB1*01 0.033 0.049 0.040 3 A*24-B*27-Cw*01-DQB1*05-DRB1*15 0.025 0.025 0.020 4 A*24-B*27-Cw*02-DQB1*02-DRB1*03 0.025 0.033 0.013 5 A*03-B*27-Cw*02-DQB1*03-DRB1*04 0.025 0.025 0.018 6 A*26-B*27-Cw*02-DQB1*03-DRB1*11 0.025 0.025 0.021 7 A*26-B*52-Cw*12-DQB1*06-DRB1*15 0.016 0.016 0.015 8 A*29-B*44-Cw*16-DQB1*02-DRB1*07 0.016 0.008 0.006 9 A*30-B*35-Cw*06-DQB1*04-DRB1*08 0.016 0.016 -10 A*24-B*07-Cw*07-DQB1*06-DRB1*15 0.016 - -11 A*23-B*44-Cw*04-DQB1*02-DRB1*07 0.016 0.016 0.016 12 A*11-B*27-Cw*01-DQB1*05-DRB1*01 0.016 - 0.005 13 A*02-B*27-Cw*02-DQB1*03-DRB1*04 0.016 - 0.014 14 A*02-B*15-Cw*02-DQB1*05-DRB1*10 0.016 0.016 0.016
IF 0.955 0.952
IH 0.880 0.923
MSE 1.3E-05 1.1E-05
Incorrect Haplotypes
Influence of the number of loci on haplotypefrequency estimation
Figure 1
Influence of sample size on haplotype frequency estimation
Figure 2
Regarding the variable number of loci analysis, it is rele-vant to notice that the 3 loci and 5 loci haplotypes included the locus HLA-B which has the highest level of polymorphism within the HLA region [1]. Moreover being especially polymorphic, HLA-B alleles were present in 39 of the pairs of alleles with |D'| = 1.
The IF and MSE results show similar behaviour in both methods in terms of overall haplotype frequency estima-tion, despite the variation on the number of tested loci. These findings are in contrast to those observed by other authors [14,17], but are quite similar to the results obtained by Zhang et al. [18]. Despite the differences between the EM-based method and PHASE v2.1.1 observed by the first authors [14,17], the work of Zhang et al. [18] revealed that, in general, for most populations, there is no significant differences between the PHASE v2.1.1 method and the EM-based method when compar-ing estimated and true sample haplotype frequencies.
The low variability observed in Arlequin V3.0 IF values when different numbers of samples were tested is in agree-ment with previous reports performed with EM algo-rithms in haplotype frequency estimation in other genes [11,16]. These previous studies demonstrated that the EM-based method has a very good performance under a wide range of population and data set scenarios.
Analyzing the MSE values of variable number of samples and loci, PHASE v2.1.1 had the best performance, exhib-iting higher MSE values than Arlequin V3.0 only in the smallest group of samples (Figure 2-a).
Concerning haplotypes with frequencies above 0.01, Arle-quin V3.0 IH values had a progressive decline as the number of loci increased. The decrease in haplotype fre-quency accuracy in Arlequin V3.0 might be the result of the presence of a high polymorphic site, like HLA-B, as well as the increase in the number of loci (from 2 to 3 and to 5 loci) with variable number of polymorphic sites. The
IH decrease, registered by PHASE v2.1.1 (haplotypes with frequency above 0.01), was very small when the number of loci was increased from 3 to 5, suggesting once more that in PHASE v2.1.1 the presence of HLA-B, and conse-quently the increase of the polymorphic rate in the larger extended haplotypes, was the major factor influencing its performance.
Like the IF, the IH values in both methods seem to be influ-enced by the number of polymorphic sites and the rate of pairs of alleles in complete LD.
The best results in both algorithms were obtained when only the Class II real haplotypes with a frequency above 0.01 were analysed. The Class II region has a low
poly-morphic rate when compared with the Class I region, decreasing the number of possible combinations within the alleles. However, this group has less pairs on complete LD (Table 1), which could suggest a low effectiveness in both methods [16,19,20]. No incorrect haplotypes were estimated, suggesting that for this type of samples both Arlequin V3.0 and PHASE v2.1.1 had a very good per-formance. The results obtained with Class II were in con-cordance with the work of Adkins [21] in single nucleotide polymorphism (SNP) haplotypes. This author showed that both EM-based methods and PHASE could identify all the haplotypes with a frequency above 0.01.
The increase of polymorphic rate in the 3 loci haplotypes (Class I) increased the number of different real haplotypes with frequencies greater than 0.01. One incorrect haplo-type was generated in common by both methods, present-ing a lower frequency when calculated by Arlequin V3.0. The presence of this haplotype (A*11-B*14-Cw*08) in both methods might be caused by the complete LD between B*14 and Cw*08 (Table 1). Higher haplotypic frequencies (above 0.01) increase the confidence and the accuracy of computational methods on haplotype deter-mination. Consequently, it decreases the probability of identifying an incorrect haplotype.
The strong LD among the markers in this region is well known [6], and was confirmed by the results displayed on Table 1. Despite the influence of LD in the performance of computational methods [16,19,20], the results demon-strated that the rate of polymorphic sites within the loci also plays an important role. The increase of LD rate was responsible for the decrease of the accuracy of these pro-grams contrary to the findings of other authors, whose research addressed other genetic regions with both high and low LD [16,19,20]. In these studies, the authors worked with SNP where the probability of recombination events is small despite the existing LD rate. The results obtained in the present work might be a consequence of HLA system specificities. The HLA high rate of heterozy-gosity allows a large number of combinations between different alleles [2], even with the strong LD in this region. Therefore it is likely that in both methods the decrease of accuracy when the LD rate increases is the result of the high variability in pairs of alleles with |D'| = 1.
Stephens and Donnelly [13]. To remedy this problem, Zhang et al. [23] developed a novel coalescence-guided hierarchical Bayesian method wich uses a hierarchical structure to directly model the coalescence relationship among modern-day haplotypes. This method has shown to have merits compared with PHASE v2.1.1.
Conclusion
This work suggests that high HLA haplotype frequency in the population under study is an important factor for the accuracy and performance of Arlequin V3.0 and PHASE v2.1.1, despite the presence of a high rate of polymorphic sites and alleles with complete LD.
Arlequin V3.0 had the best performance on haplotype inference and frequency estimation when dealing with less than 5 loci haplotypes. PHASE v2.1.1 had the best overall performance both in haplotype prediction and in frequency calculation. Nevertheless, in general and like reported in previous works [18], the difference found in this work between PHASE v2.1.1 and Arlequin V3.0 was insubstantial.
The best results of both algorithms were obtained when only real haplotypes with a frequency above 0.01 were analysed.
From a practical point of view, both methods provide advantages and disadvantages to estimate HLA haplo-types. Arlequin V3.0 main advantage may be the format of the input file, which does not require any transformation on the haplotypic data and supports the HLA nomencla-ture currently used. With PHASE v2.1.1, the haplotypic data needs to be transformed into a numeric code, prior to running the program, and the results have to be trans-formed again to the original HLA nomenclature. Hence, data transformation can become very laborious when using large haplotypic data sets. PHASE v2.1.1 main advantage is the fact that all the possible haplotypes are displayed in the output file, which can be useful in certain studies. This does not happen with Arlequin V3.0 where only the most frequent haplotypes (above a frequency established by the program) are displayed on the output file.
The present work indicates that, like with other genes and sample sizes [5,11,16,18-21], computational methods can provide an effective calculation of HLA haplotype fre-quencies by using data from unrelated individuals. These computational methods can provide an accurate predic-tion of haplotype phases on this particular region, despite the strong LD and high polymorphism within alleles from different HLA loci. This work may present some useful information about statistical approach in studies using HLA.
Methods
DNA Samples/Genotyping
Blood was collected from 61 probands (38 males and 23 females) and their relatives (228 individuals; 107 males and 121 females) belonging to unrelated families, under informed consent. DNA extraction was performed by the salting-out technique [24]. HLA typing was carried out for the Class I loci: HLA-A, HLA-B, HLA-Cw; and Class II loci: HLA-DQB1, HLA-DRB1, by Polymerase Chain Reaction – Sequence Specific Primers (PCR-SSP), as described by Olerup and Zetterquist (1992) [25] using the Olerup SSP HLA typing kit (Olerup SSP AB, Sweden).
Real haplotypes identification
The HLA A-B-Cw-DQB1-DRB1 real haplotypes were deter-mined through a family-based study using family mem-bers of the 61 probands. A segregation study of the HLA haplotypes was performed on the probands pedigree, allowing the identification of each individual real haplo-types.
Hardy-Weinberg equilibrium (HWE)
The HWE was calculated locus by locus and for whole haplotype, using the software package GENEPOP v3.4 [26]. The Markov chain approximation was used with 100000 steps and 1000 dememorization steps definition.
Pairwise LD between alleles
LD, between pairs of alleles at different loci, was calcu-lated through the computing of the standardized LD value (D') [27]. D' is the normalization of the LD, dividing it by the theoretical maximum value for the observed allele
fre-quencies ( ). |D'| = 1 indicates complete LD
and D' = 0 corresponds to total absence of LD.
Haplotype computational estimation
Two different algorithms were used to examine the accu-racy of computational haplotype inference. PHASE v2.1.1 was run with the default options, with an exception: the number of iterations of the final run of the algorithm was increased to five restarting points (-X option). Arlequin V3.0 was run using the following settings: EM algorithm performed at the haplotype level, ε = 1e-7. 5 significant digits for output, 50 starting points for EM algorithm and a maximum of 1000 iterations. Both programs were runned five times, for each of the used scenarios (variable number of individuals and variable number of loci). New input data files were created for every run. Each data file was composed by different randomly selected sample groups.
Measures of estimation accuracy
The mean squared error (MSE) [11] was used to measure the accuracy of computational algorithms in haplotype
frequency estimation. The MSE incorporates all the k lotype frequencies reflecting the overall difference in hap-lotype frequencies between estimated and true values for a particular data set:
where h is the number of haplotypes in the data set, pek
and ptk are the estimated and real (in this case) haplotype frequencies for the k haplotype. Another two measures, IF
(Similarity Index) and IH (Haplotype Identification Index) [10], were also used to estimate the efficiency of computa-tional algorithms. IF ranges from 0 to 1 (the value 1 means that the real and the estimated frequencies are identical), and measures the haplotype frequency estimations, describing how closely the estimated haplotype frequen-cies are to the real frequenfrequen-cies. This index is defined as the proportion of haplotype frequencies which are in com-mon between estimated and true frequencies:
where h, pek and ptk are defined as above. IH measures the accuracy of haplotype identification, comparing the number of different haplotypes obtained experimentally with the number of different haplotypes identified by the computer software. A haplotype is defined as being detected if it has an estimated frequency of at least 1/(2n) in a population of n individuals [10]. IH is defined as:
where mtrue is the number of haplotypes known to occur,
mest is the number of inferred haplotypes with frequency ≥
1/(2n), and mmissed is the number of known haplotypes that were not inferred.
Authors' contributions
BFB participated in the design of the study, performed the statistical analysis and drafted the manuscript. MRS car-ried out the determination of real haplotypes. RNF partic-ipated in the statistical analysis. ARC particpartic-ipated in the design of the study and helped to draft the manuscript. MJP participated on the determination of real haplotypes. JPP carried out genotyping assays. HS helped to draft the manuscript. MGM participated in the design of the study. CS participated in the design of the study and helped to draft the manuscript. AB participated in the design of the study. JBA conceived the study and participated in its coordination and helped to draft the manuscript. All authors read and approved the final manuscript.
Acknowledgements
This work was supported by Interreg-IIIB Madeira-Açores-Canarias (project MACAROGENE – MAC/2.3/A6) and by project MANSEEBMO (MI.2.1/I/004/2005). We are thankful to Dr. Matthew Brown for the sugges-tions and critical readings of the manuscript.
References
1. Klein J, Sato A: The HLA system. First of two parts. N Engl J Med
2000, 343(10):702-709.
2. Eren E, Travers P: The Stucture of the Major Histocompatibil-ity Complex and its Molecular Interactions. In HLA in Health and Disease 2nd edition. Edited by: Lechler R, Warrens A. London , Academic Press; 2000:26-27.
3. Begovich AB, McClure GR, Suraj VC, Helmuth RC, Fildes N, Bugawan TL, Erlich HA, Klitz W: Polymorphism, recombination, and linkage disequilibrium within the HLA class II region. J Immu-nol 1992, 148(1):249-258.
4. Mattiuz PL, D I, Piazza A, Ceppelini R, Bodmer WF: New approaches to the population genetic and segregation analy-sis of the HL-A system. In Histocompatibility Testing 1970 1st edi-tion. Edited by: Terasaki P. Copenhagen , Munksgaard; 1971:193-205. 5. Crawford DC, Nickerson DA: Definition and clinical
impor-tance of haplotypes. Annu Rev Med 2005, 56:303-320.
6. Trowsdale J: HLA genomics in the third millennium. Curr Opin Immunol 2005, 17(5):498-504.
7. Yan H, Papadopoulos N, Marra G, Perrera C, Jiricny J, Boland CR, Lynch HT, Chadwick RB, de la Chapelle A, Berg K, Eshleman JR, Yuan W, Markowitz S, Laken SJ, Lengauer C, Kinzler KW, Vogelstein B:
Conversion of diploidy to haploidy. Nature 2000,
403(6771):723-724.
8. Douglas JA, Boehnke M, Gillanders E, Trent JM, SB G: Experimen-tally-derived haplotypes substantially increase the efficiency of linkage disequilibrium studies. Nat Genet 2001,
28(4):361-364.
9. Niu T: Algorithms for inferring haplotypes. Genet Epidemiol
2004, 27(4):334-347.
10. Excoffier L, Slatkin M: Maximum-likelihood estimation of molecular haplotype frequencies in a diploid population. Mol Biol Evol 1995, 12(5):921-927.
11. Fallin D, Schork NJ: Accuracy of haplotype frequency estima-tion for biallelic loci, via the expectaestima-tion-maximizaestima-tion algo-rithm for unphased diploid genotype data. Am J Hum Genet
2000, 67(4):947-959.
12. Excoffier L, Laval G, Schneider S: Arlequin ver. 3.0: An integrated software package for population genetics data analysis. EBO
2005:47-50.
13. Stephens M, Donnelly P: A comparison of bayesian methods for haplotype reconstruction from population genotype data.
Am J Hum Genet 2003, 73(5):1162-1169.
14. Stephens M, Smith NJ, Donnelly P: A new statistical method for haplotype reconstruction from population data. Am J Hum Genet 2001, 68(4):978-989.
15. Niu T, Qin ZS, Xu X, Liu JS: Bayesian haplotype inference for multiple linked single-nucleotide polymorphisms. Am J Hum Genet 2002, 70(1):157-169.
16. Xu CF, Lewis K, Cantone KL, Khan P, Donnelly C, White N, Crocker N, Boyd PR, Zaykin DV, Purvis IJ: Effectiveness of computational methods in haplotype prediction. Hum Genet 2002,
110(2):148-156.
17. Stephens M, Smith NJ, P D: Reply to Zhang et al. Am J Hum Genet
2001, 69:912-914.
18. Zhang S, Pakstis AJ, Kidd KK, Zhao H: Comparisons of two meth-ods for haplotype reconstruction and haplotype frequency estimation from population data. Am J Hum Genet 2001,
69(4):906-914.
19. Avery CL, Martin LJ, Williams JT, North KE: Accuracy of haplo-type estimation in a region of low linkage disequilibrium.
BMC Genet 2005, 6(Suppl I):S80.
20. Lin S, Cutler DJ, Zwick ME, Chakravarti A: Haplotype inference in random population samples. Am J Hum Genet 2002,
71(5):1129-1137.
21. Adkins RM: Comparison of the accuracy of methods of com-putational haplotype inference using a large empirical data-set. BMC Genet 2004, 5(22):.
MSE pek p h
k h tk = − =
∑
( ) / 1 2IF pek ptk
k h = − − =
∑
1 1 2 1Publish with BioMed Central and every scientist can read your work free of charge
"BioMed Central will be the most significant development for disseminating the results of biomedical researc h in our lifetime."
Sir Paul Nurse, Cancer Research UK
Your research papers will be:
available free of charge to the entire biomedical community peer reviewed and published immediately upon acceptance cited in PubMed and archived on PubMed Central yours — you keep the copyright
Submit your manuscript here:
http://www.biomedcentral.com/info/publishing_adv.asp
BioMedcentral
22. Stephens M, Scheet P: Accounting for decay of linkage disequi-librium in haplotype inference and missing-data imputation.
Am J Hum Genet 2005, 76(3):449-462.
23. Zhang Y, Niu T, Liu JS: A coalescence-guided hierarchical Baye-sian method for haplotype inference. Am J Hum Genet 2006,
79(2):313-322.
24. Laitinen J, Samarut J, Holtta E: A nontoxic and versatile protein salting-out method for isolation of DNA. Biotechniques 1994,
17(2):316, 318, 320-322.
25. Olerup O, Zetterquist H: HLA-DR typing by PCR amplification with sequence-specific primers (PCR-SSP) in 2 hours: an alternative to serological DR typing in clinical practice including donor-recipient matching in cadaveric transplanta-tion. Tissue Antigens 1992, 39(5):225-235.
26. Raymond M, Rousset F: Genepop 3.4., an updated version of Genepop V.1.2 (1995): population genetics software for exact tests and ecumenicism. J Heredity 2003, 86:248-249. 27. Lewontin RC: The Interaction of Selection and Linkage.
Gen-eral Considerations; Heterotic Models. Genetics 1964,