An investigation of the psychometric
properties of a measure of teamwork among
high school students
Brian F. French
1, Chad M. Gotch
2,
Jason C. Immekus
3& Jessica L. Beaver
2Abstract
High school students need to possess a range of skills (e.g., reasoning) to function in a technologi-cally driven workforce age (21st Century Workforce Commission, 2000). Teamwork skills com-prise a foundational competency that addresses students’ ability to collaborate to attain a shared goal. Among high school students, there is a lack of theoretically and psychometrically sound instruments to measure teamwork (Wang, MacCann, Zhuang, Liu, & Roberts, 2009). The purpose of this study was to evaluate the psychometric properties of a teamwork measure for use among high school students. Data included students’ (N = 382) responses on a 26-item Teamwork scale and noncognitive and academic achievement measures. Confirmatory factor analytic results sup-ported conceptualizing the scale in terms of a bifactor model (Gibbons et al., 2007). Reliability estimates ranged from .76 to .92, respectively. Moderate to high positive correlations were found between Teamwork total and subscale scores and noncognitive and cognitive measures. Results suggest that the instrument may serve useful for the high school population, with implications for practice and research.
Key words: teamwork, validity, STEM, high school students
1
Correspondence concerning this article should be addressed to: Brian F. French, PhD., Learning and Performance Research Center, Washington State University, Pullman, WA 99163, United States of America; email: [email protected]
2
Washington State University
3
Collaborative, team-based learning is considered an effective approach to develop students’ knowledge and skills necessary for academic and professional success (Bell, 2010; Larson & Northern Miller, 2011; Thorp & Sage, 2002). The basis of this student-centered pedagogy is to promote such essential skills as critical thinking, reasoning, problem-solving, and teamwork, which serve as the cornerstone of various policy initia-tives to promote workforce development (e.g., Partnerships for 21st Century Skills, 2009). While paramount to life success, effective strategies to facilitate these outcomes with fidelity require consideration of factors specific to curriculum, teacher quality, and assessment (Rotherham & Willingham, 2009). The availability of effective tools for teachers and researchers alike to facilitate the learning process is critical, especially given the challenge and required time investment inherent in collaborative work (John-son, Al-Mahmood, & Maier, 2012).
United States national educational standards and workforce policy initiatives specify the diverse skills needed by high school graduates to be college and career ready (Partner-ships for 21st Century Skills, 2009; 21st Century Workforce Commission, 2000). Such frameworks seek to encourage a strong primary and secondary educational system to expose students to diverse, rich learning opportunities to build skills needed for life success. The frameworks advance strategies to produce students who are able to think critically, apply their knowledge and skills, and engage in higher-order processing of information across diverse areas (e.g., mathematics, science). For example, the 21st Cen-tury Workforce Commission’s (2000) report identified a set of nine areas of “Keys to Success” to promote the technology literacies of emerging work to ensure graduating students have the knowledge and skills to succeed in an increasingly technologically driven age. The development, delivery, and evaluation of effective instructional strate-gies to promote students’ learning outcomes to meet workforce demands requires the availability of psychometrically sound measures of targeted knowledge and skills to guide instructional and programmatic decisions. Wang, MacCann, Zhuan, Liu, and Rob-erts (2009) noted a considerable lack of measures to measure teamwork skills among high schools.
Conceptualizing teamwork
Historically, “industry”-type teams have provided a framework to examine teams in educational settings (e.g., classrooms). Guzzo (1986) characterized a team as a collection of individuals with a shared view that see themselves as a social entity. More specifical-ly, Guzzo and Dickson (1996) characterized a team as a collection of persons consider-ing themselves and are considered by others to function as a social group. This group is interdependent given the activities they engage in together. Therefore, what distinguishes a team from a group is the interdependency of the individuals to complete the tasks nec-essary to attain a shared goal (Imbrie, Maller, & Immekus, 2005).
The dimensions of effective teams have been characterized by their produced outputs (e.g., deliverables), consequences for group members, and the capability to perform well in the future. For example, Hackman (1990) characterized team effectiveness based on three dimensions: output meeting quality standards, ability to work interdependently in the future, and individuals’ growth and well-being. Campion, Medsker, and Higgs (1993) suggested five broad domains – job design, interdependence, composition, context, and potency. They empirically supported these domains and demonstrated that the majority of the team characteristics (e.g., interdependence, potency) were related to criteria of effectiveness (e.g., productivity). While some conceptual differences exist among the perspectives (e.g., Campion et al., 1993; O’Neil, Wang, & Lee, 2003; Stevens & Campi-on, 1994), there is general agreement of the components specified by Campion and colleagues (1993).
There are also outcomes associated with classroom-based teams. For example, the Na-tional Middle School Association (2010) specifies, “The team is the foundation for a strong learning community characterized by a sense of family. Students and teachers on the team become well acquainted, feel safe, respected, and supported, and are encour-aged to take intellectual risks” (p. 31). Teams can create a sense of community and foster stable relationships with teachers and students (Ellerbrock, 2012). When examining the middle school and high school classroom, it is apparent that the components described above pertain to the interdisciplinary teams in which students are engaged.
Research on teamwork
Council of Advisors on Science & Technology, 2010). There is a positive relationship between effective teams and outcomes in many domains including higher education, business, aviation, the military (e.g., Cohen & Bailey, 1997), U.S. government and inter-national agencies (Larson & Northern Miller, 2011; Partnerships for 21st Century Skills, 2009), and health care (Wholey, Zhu, Knoke, Zellmer-Bruhn, & Witheridge, 2012). With-in education, students’ teamWith-ing experiences have been examWith-ined to create developmen-tally responsive learning environments (Ellerbrock, 2012). Nonetheless, the extent to which student-centered, team-based strategies are considered effective across diverse contexts (e.g., online) and populations (e.g., at-risk, students with disabilities) will de-pend on the quality of the measures used to operationalize the teamwork processes and outcomes.
Operationalization of teamwork
Diverse approaches have been advanced to measure teamwork. In general, these have included self-report (Campion et al., 1993), peer evaluation (Loughry, Ohland, & Moore, 2007), and external (e.g., manger) judgment (Campion et al., 1993). More recently, Wang et al. (2009) developed a multimethod approach based on the use of self-report, situational judgment, and teacher-report to evaluate teamwork among high school stu-dents. Indeed, the assessment of teamwork skills in a high school context is a challenge as high school students’ involvement on diverse teams is unique due to a range of factors (e.g., curriculum). Nonetheless, expanding the literature base on the ways in which teamwork can be measured and related to other theoretical factors (e.g., achievement motivation) is critical to design, deliver, and evaluate various types of curriculum, in-struction, and assessments.
Study purpose
interdependency, goals) of teamwork. Associations with other variables were examined through standard correlation analyses.
Method
Participants
Study data were based on a sample of high school students (N = 382; 36 % female) in the Pacific Northwest United States. The sample was majority White (62 %), and approxi-mately one-quarter (27 %) of the sample identified as of Hispanic/Latino origin. Students were primarily at the 9th (48 %) or 10th (35 %) grade level; fewer students were at the 11th (13 %) or 12th (4 %) grade level.
Procedure
Three noncognitive surveys designed for college students were modified for use as a part of a multi-year study of processes and impacts at a newly formed STEM high school in the Pacific Northwest of the United States. Surveys included measures of academic mo-tivation, institutional integration, and teamwork that were administered during the Fall 2012 semester via an online survey system following the Tailored Design Method (Dill-man, Smyth, & Christian, 2014). Study participants were invited into the study using a pre-notice letter, invitation letter, and two reminders spaced two weeks apart. All com-munications were sent via email. All study procedures were approved by the institutional review board.
Instrumentation
Teamwork.The Teamwork scale was based on an instrument designed for use in under-graduate engineering courses (Imbrie et al., 2005; Immekus et al., 2004) with items addressing how students perceive teamwork, team effectiveness, and task accomplish-ment. To achieve the downward extension of this scale, a few items that did not match the high school environment (e.g., items focused on laboratory sessions as classes or featuring engineering-specific wording) were deleted. The final scale was composed of 26 items comprising 4 subscales: Group Composition (4 items), Interdependency (7 items), Norms and Roles (6 items), and Goals (9 items). Appendix A presents content and descriptive statistics across scale items. Total score internal consistency reliability (alpha) was 0.96, whereas subscale estimates ranged from .76 to .92.
Institutional integration. A revised version of the Institutional Integration Scale (French & Oakes, 2004) was used to assess students’ social and academic integration. The downward extension of this scale involved deleting one subscale (College Commit-ment) as well as adjusting item wording to match a high school environment. The final scale included 30 items and 4 subscales: Peer-Group Interactions, Interactions with Fac-ulty, Faculty Concern for Student Development and Teaching, and Academic and Intel-lectual Development. Internal consistency reliability (alpha) for the total score was 0.96.
Academic achievement.Cumulative grade point average (GPA) was used as an indica-tor of academic achievement, and was obtained from local school district assessment offices. The mean grade point average across all participants was 2.93 on a scale from 0.00 to 4.00 (SD = 0.86; Range = 0.80 to 4.00).
Data analysis
Confirmatory factor analysis. CFA was used to test the dimensionality of the items of the Teamwork scale and provide internal structure validity evidence. This analysis en-tailed the sequential testing of nested models that differed in terms of the number of factors underlying the scale items and testing the statistical difference between their model-data fit statistics (i.e., chi-square). Compared models included: unidimensional, correlated four-factor, and bifactor (Gibbons et al., 2007; Gibbons, Immekus, & Rush, 2009; Reise, Morizot, & Hays, 2007). In addition, models without a particular group factor (e.g., Goals) were compared to a full bifactor model to determine the saliency of the secondary factors to account for the relationship of item subsets after accounting for the primary domain (i.e., Teamwork). In total, there were four group factors that corre-sponded to the Teamwork subscales.
approach provides a confirmatory-based approach to testing scale dimensionality instead of a more data-driven approach based on the use of exploratory factor analysis (EFA).
LISREL 8.3 (Jöreskog & Sörbom, 2006) was used for parameter estimation based on the asymptotic covariance matrix to correct for violations of bivariate normality (Boomsma, 1987) using robust weighted least squares (DWLS; Finney & DiStefano, 2013), based on a polychoric correlation matrix. Model-data fit was evaluated using Comparative Fit Index (CFI), Root Mean Squared Error of Approximation (RMSEA), Standardized Root Mean Square Residual (SRMR), and chi square (i.e., maximum likelihood [ML χ2]; Satorra-Bentler [SB χ2]). Model-data fit was considered adequate when CFI > .95, RMSEA < .06, and SRMR < .08 (Hu & Bentler, 1999). The SB χ2 statistic was used in addition to the ML χ2 based on its performance in conditions of nonnormality (Curran, West, & Finch, 1996). But the SB χ2 difference test (Satorra & Bentler, 2001) was con-ducted to compare models. For the dimensionality assessment of the Teamwork scale, chi-square differences tests with α = .01 as the criteria were used to judge whether the reduced model (e.g., unidimensional) resulted in more parsimonious model-data fit com-pared to the full model (e.g., bifactor; Kline, 2010). We acknowledge that other fit crite-ria can be used to make this judgement (e.g., Themessl-Huber, 2014). However, there are no set criteria for all conditions, especially with the use of estimation procedures other than ML in relation to the behavior of the other indices. Thus, we relied on the standard procedure that performs well (French & Finch, 2006; French & Finch, 2011).
Associations with other variables. Pearson Product Momentcorrelations were comput-ed among scores on the Teamwork scale (overall score and the four subscores) and the measures of academic motivation, institutional integration, and academic achievement. Based on prior work in the area, we expected moderate-to-high positive correlations.
Results
Confirmatory factor analysis
Table 1 reports the model-data fit across the tested CFA models. As shown, the full bifactor model reported the best fit to the data, SB χ2 (273) = 478, p < .01, CFI = .99, RMSEA = .044, SRMR = .051. Additional support for conceptualization of the data in terms of a bifactor model was based on inspection of the model-data fit of the correlated four factor model and corresponding parameter estimates. In particular, while the four-factor model displayed adequate fit, interfour-factor correlations were exceedingly high (>.80) suggesting indistinguishable latent traits (Kline, 2010). Comparisons of CFA models without individual group factors (e.g., norms, goals) to the full bifactor model indicated statistically significantly worse model-data fit (ps < .001), supporting the inclusion of each of the four secondary factors.
Table 1:
Model Fit Results for the Teamwork Scale
Model df χ2 SB χ2 CFI RMSEA (90 % CI) SRMR Full bifactor 273 1,505* 478* .99 .044 (.038-.051) .051 Unidimensional (1 factor) 299 2,411* 1035* .98 .080 (.075-.086) .066
Four-factor 293 1,802* 659* .99 .057 (.051-.063) .063
Bifactor without Group Composition 277 1,689* 563* .99 .052 (.046-.058) .058 Bifactor without Interdependency 280 1,646* 556* .99 .051 (.045-.057) .058 Bifactor without Norms and Roles 279 1,756* 577* .99 .053 (.047-.059) .054 Bifactor without Goals 282 1,682* 587* .99 .053 (.047-.059) .054
* p < .01
Table 2:
Factor Pattern Coefficients for the Five-Dimensional Bifactor Structure of the Teamwork Scale
Factor
Item Teamwork
Group Composition
Inter-dependency
Norms and
Roles Goals 1 .58 .51
2 .51 .56 3 .69 .52 4 .60 .14
5 .75 .10
6 .70 .26
7 .73 .49
8 .75 .43
9 .82 .26
10 .77 .31
11 .49 .32
12 .68 .16
13 .82 -.03
14 .80 .25
15 .74 .57
16 .74 .52
17 .78 .24
18 .78 .02
19 .81 .21
20 .74 .32
21 .86 -.04
22 .82 -.02
23 .75 .13
24 .75 .33
25 .74 .50
ry factor and varied loadings on the group factors. Specifically, inspection of primary factor loadings on the Teamwork dimension indicated that loadings were moderate to strong, ranging from .49 (Item 11) to .86 (Item 21). Such loadings indicate the primary dimension accounted for significant item variance. Turning attention to the secondary factor loadings found varying degrees of association from low to moderate between the items and sub-domains after accounting for the primary dimension.
In particular, the Group Composition factor loadings ranged from .14 (Item 4) to .56 (Item 2), and Interdependency loadings fell between .10 (Item 5) and .49 (Item 7). More varied loadings were observed for the secondary factors of Norms and Roles (-.03 [Item 13] to .57 [Item 16]) and Goals (-.04 [Item 21] to .50 [Item 25]). Notably, those items (i.e., Items 13, 21, & 22) reporting the strongest primary factor loadings also had the weakest relationship to the secondary factors (i.e., -.02 to -.04). This pattern indicates that once their relationship with the primary Teamwork factor was accounted for, the items did not contribute to the operationalization of their theoretically associated second factor (e.g., Norms & Roles). Such information provides empirical evidence for addi-tional inspection of these items to measure specific components of teamwork above and beyond the measurement of students’ general teamwork ability.
Associations with other variables
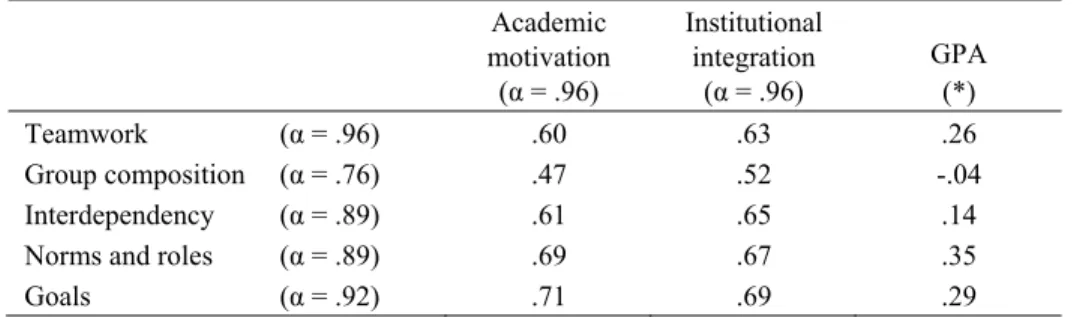
Table 3 displays correlations among total and subscale Teamwork scores and total scores of the other measured variables. As expected, Teamwork total and subscale scores were moderately correlated (rs .47 to .71) to motivation and institutional inte-gration. Correlations with academic achievement were less strong. A correlation of .26 was observed between GPA and overall scores on the teamwork scale. Scores for the Norms & Roles subscale demonstrated the strongest correlation (.35) with GPA. There was essentially no relationship (-.04) between scores on the Group Composition sub-scale and GPA.
Table 3:
Scale Reliabilities and Intercorrelations among the Measured Variables
Academic motivation
(α = .96)
Institutional integration (α = .96)
GPA (*) Teamwork (α = .96) .60 .63 .26 Group composition (α = .76) .47 .52 -.04 Interdependency (α = .89) .61 .65 .14 Norms and roles (α = .89) .69 .67 .35 Goals (α = .92) .71 .69 .29
Discussion
The ability to work on teams is recognized as a valuable skill needed for success in one’s selected profession as well as completion of college. To gain an understanding of the way in which students perceive team value and effectiveness, the purpose of this study was to evaluate a measure of teamwork for use among high school students. There is a need to extend the assessment of teamwork skills to this age group as there is more em-phasis placed at the university level to have students work in teams early on in the col-lege years. While not all high school students will attend colcol-lege, teamwork skills may be desired by employers for success in their organizations (Partnerships for 21st Century Skills, 2009; 21st Century Workforce Commission, 2000). An existing teamwork meas-ure (Imbrie et al., 2005), developed for the college student population, was modified to create a 26-item instrument for high school students. Subsequently, the scale’s psycho-metric properties were evaluated within the context of anticipated classroom assessment uses.
Empirical evidence based on the comparison of nested CFA models supported the scale’s multidimensional structure. Specifically, conceptualization of the scale according to a bifactor structure in which items relate to a primary factor (i.e., teamwork) in addition to a secondary group factor was supported. Within this structure, the collective item set was found to report moderate loadings on the primary dimension, with varied loadings on the secondary group factors (e.g., Goals). Whereas an EFA could have been conducted fol-lowing a lack of model-data fit of the theorized four-factor structure to identify and re-tain items to obre-tain a simple structure of the data, the comparison of CFA models pro-vided a confirmatory-based approach to dimensionality assessment. That is, dimensional-ity assessment within a CFA framework provided a theoretically-based approach to determining the number of empirical factors underlying the scale items. Specifically, within the current study, the lack of fit of the unidimensional and correlated four-factor models indicated that item variance may be explained in terms of primary and secondary factors. The specification of the bifactor model and comparing it to restrictive models absent of group factors provided a framework to judge the multidimensionality of indi-vidual items and item subsets. Although each of the specified secondary group factors was supported within the bifactor structure, specific items were identified to undergo more thorough examination. As such, the approach to dimensionality assessment within the current study provided a basis to examine item dimensionality, identify areas in con-sideration of scale revision, and the creation of subscale scores.
team reflect the input of all group members. As compared to items that loaded similarly on both the primary and secondary dimensions, these items were more aligned with assessing general team functioning than specific components of teamwork, such as inter-dependency and goal-setting. Additional research is needed to judge the degree to which specific components of teamwork (e.g., goals, norms and roles) can be measured inde-pendently of general team functioning. This is essential as goals and norms and roles had higher correlations, although similar in magnitude, compared to the Teamwork total score with the 3 external variables. In terms of practical and empirical implications, these findings (a) support the multidimensional structure of the teamwork measure, (b) identify items that are unrelated to their intended group factor after accounting for the primary dimension, and (c) point to areas of future research regarding the interpretation and use of obtained scores.
Results of the correlational analyses support the use of the teamwork scale for formative uses in collaborative learning environments. Correlations between teamwork scores and scores on the academic motivation and institutional integration scales were strong, but the coefficients were not so high as to suggest a redundancy in introducing the teamwork measure as a part of an assessment system. While the observed correlations between teamwork and GPA were smaller in magnitude, 3 of the 5 estimates approached a mod-erate level, and suggest teamwork beliefs and behaviors are important considerations in cultivating students’ academic success. Also noted are shortcomings in using GPA as a measure of academic achievement. Assigned grades often reflect not only student learn-ing, but also effort and persistence (Brookhart, 2013). Furthermore, GPA distributions often suffer from range restrictions that suppress observed correlations. In the present study, 18 % of the sample had a GPA above 3.85. It is possible a different operationali-zation of academic achievement could show a greater relationship with scores from the Teamwork scale. Such information may serve particularly useful for educators in devel-oping student-based teams to ensure they are composed of students with a diversity of skill development levels. The examination of relationships with other variables to con-tinue gathering evidence for the function of Teamwork scores is encouraged.
References
Bell, S. (2010). Project-based learning for the 21st century: Skills for the future. The Clearing
House, 83, 39-43. doi: 10.1010/00098650903505415
Boomsma, A. (1987). The robustness of maximum likelihood estimation in structural
equa-tion models. In P. Cuttance & R. Ecob (Eds.), Structural modeling by example:
Applica-tions in educational, sociological, and behavioral research (pp. 160-180). New York:
Cambridge University Press.
Braverman, M. T. (2013). Negotiating measurement: Methodological and interpersonal
con-siderations in the choice and interpretation of instruments. American Journal of
Evalua-tion, 34, 99-114. doi: 10.1177/1098214012460565
Brookhart, S. M. (2013). Grading. In J. H. McMillan (ed.), Handbook of research on
class-room assessment (pp. 257-271). Los Angeles: Sage.
Brown, P. (2013). Engineering efforts and opportunities in the National Science Foundation’s
Math and Science Partnerships Program. Journal of Technology Education, 24, 41-54.
Campion, M. A., Medsker, G. J., & Higgs, A. C. (1993). Relations between work group
char-acteristics and effectiveness: Implications for designing effective work groups. Personnel
Psychology,46, 823-850.
Caster, J. (2012). Validity and reliability of the brief TeamSTEPPS teamwork perceptions
questionnaire. Journal of Nursing Measurement, 20, 186-198.
Cohen, S. G., & Bailey, D. E., (1997). What makes teams work: group effectiveness research
from shop floor to the executive suite. Journal of Management, 23, 239-290.
Curran, P. J., West, S. G., & Finch, J. F. (1996). The robustness of test statistics to
nonnor-mality and specification error in confirmatory factor analysis. Psychological Methods, 1,
16–29.
Dillman, D. A., Smyth, J. D., & Christian, L. M. (2014). Internet, mail, and mixed-mode
surveys: The tailored design method (4th ed.). Hoboken, NJ: Wiley & Sons.
Ellerbrock, C. R. (2012). Creating a family-like ninth-grade environment through
interdisci-plinary teaming. Urban Education, 47, 32-64. doi: 10.1177/0042085911427736
Escudeiro, N. F., & Escudeiro, P. M. (2012). The multinational undergraduate teamwork
project: An effective way to improve students’ soft skills. Industry and Higher
Educa-tion, 26(4), 279-290.
Finney, S & DiStefano C. (2013). Nonnormal and categorical data in structural equation
modeling. In G. R. Hancock & R. O. Mueller (Eds), Structural equation modeling: A
sec-ond course (2nd ed), pp. 439-492. Greenwich, CT: Information Age Publishing.
French, B. F., & Finch, W. H. (2006). Confirmatory factor analytic procedures for the
deter-mination of measurement invariance. Structural Equation Modeling, 13, 378-402.
French, B. F., & Finch, W. H. (2011). Model misspecification and invariance testing via
confirmatory factor analytic procedures. Journal of Experimental Education, 79.404-428.
French, B. F., & Oakes, W. (2004). Reliability and validity evidence for the institutional
French, B. F., & Oakes, W. (2003). Measuring academic intrinsic motivation in the first year
of college: Reliability and validity evidence for a new instrument. Journal of the
First-Year Experience, 15, 83-102.
Gibbons, R. D., Bock, R. D., Hedeker, D., Weiss, D. J., Segawa, E., Bhaumik, D., . . .,Stover,
A. (2007). Full-information item bi-factor analysis of graded response data. Applied
Psy-chological Measurement, 31, 4-19.
Gibbons, R. D., Immekus, J. C., & Bock, R. D. (2007). The added value of multidimensional
item response theory models. Workbook for the National Institute of Health. Supported by
Contract 2005-05828-00-00.
Gibbons, R. D., Rush, J., & Immekus, J. C. (2009). On the psychometric validity of the
do-mains of the PDSQ: An illustration of the bi-factor item response theory model. Journal
of Psychiatric Research, 43, 401-410.
Guzzo, R. A. (1986). Group decision making and group effectiveness. In Goodman, P. S.
(ed.), Designing effective work groups, 34-71. San Francisco, CA: Jossey-Bass.
Guzzo, R. A., & Dickson, M. W. (1996). Teams in organizations: Recent research on
perfor-mance and effectiveness. Annual Review of Psychology, 47, 307-38.
Hackman, J. R. (1990). Groups that work (and those that don’t). San Francisco, CA:
Jossey-Bass.
Hmelo-Silver, C. E. (2004). Problem-based learning: What and how do students learn?
Edu-cational Psychology Review, 16, 235-266. doi: 1040-726X/04/0900-0235/0 C
Hu, L., & Bentler, P. M. (1999). Cutoff criteria for fit indexes in covariance structure
analy-sis: Conventional criteria versus new alternatives. Structural Equation Modeling, 6, 1–55.
Immekus, J. C., & Imbrie, P. K. (2008). Dimensionality assessment using the full-information item bifactor analysis for graded response data: An illustration with the State
Metacogni-tive Inventory. Educational and Psychological Measurement, 68, 695-709.
Imbrie, P. K., Maller, S. J., & Immekus, J. C. (2005). Assessing team effectiveness.
Proceed-ings of American Society of Engineering Education, USA, 2230.
Immekus, J. C., Tracy, S., Yoo, J., Maller, S. J., French, B. F., & Oakes, W. C. (2004). De-veloping self-report instruments to measure ABET EC 2000 Criterion 3 professional
out-comes. Proceedings of American Society of Engineering Education, USA, 3230.
Johnson, Al-Mahmood, & Maier, (2012). Student and staff perceptions of teamwork in group
writing for Science honours. International Journal of Innovation in Science and
Mathe-matics Education, 20, 25-41.
Jöreskog, K. G., & Sörbom, D. (2006). LISREL. Chicago: Scientific Software International,
Inc.
Kane, M. T. (2006). Validity. In R. L. Brennan (ed.), Educational Measurement (pp. 17-64,
4th ed.). Westport CT: Praeger Publishers.
Kline, R. (2010). Principles and practice of structural equation modeling (3rd ed.). New York:
Guilford Press.
Larson, L. C., & Northern Miller, T. (2011). 21st Century Skills: Prepare students for the
Loughry, M. L., Ohland, M. W., & DeWayne Moore, D. (2007). Development of a
theory-based assessment of team member effectiveness. Educational & Psychological
Measure-ment, 67, 505-524. doi: 10.77/0013164406292085
Messick, S. (1989). Validity. In R. L. Linn (Ed.), Educational measurement (3rd ed.; pp.
13-103). New York: American Council on Education.
National Middle School Association. (2010). This we believe: Successful schools for young
adolescents. Westerville, OH: Author.
O’Neil, H. F., Jr., Wang, S., Jr., & Lee, C. (2003). Assessment of teamwork skills via a
team-work questionnaire. In H. F. O’Neil Jr. & R. S. Perez. (Eds.), Technology applications in
education: A learningview (pp. 283-303). Mahwah, NJ: Erlbaum.
Partnership for 21st Century Skills (2009). A framework for 21st century learning. Tucson,
AZ: P21. Available at: www.21stcenturyskills.org
President’s Council of Advisors on Science & Technology (2010). Prepare and inspire: K-12 education in science, technology, engineering, and math (STEM) for American’s Future.
Rotherham, A. J., & Willingham, D. (2009). 21st Century. Educational Leadership, 16-21.
Reise, S. P., Morizot, J., & Hays, R. D. (2007). The Role of the bi-factor model in resolving
dimensionality issues in health outcomes measures, Medical Care, 16, 19-31. doi
10.1007/s11136-007-9183-7
Stevens, M. J., & Campion, M. A. (1994). The knowledge, skill, and ability requirements for
teamwork: Implications for human resource management. Journal of Management, 20,
503-530.
21st Century Workforce Commission (2000). A nation of opportunity: Building America’s 21st
Century Workforce. Washington, DC: U.S. Department of Labor. Retrieved from
http://wdr.doleta.gov/opr/fulltext/document.cfm?docn=6113
Themessl-Huber, M. (2014). Evaluation of the χ2 statistic and different fit indices under
mis-specified number of factors in confirmatory factor analysis. Psychological Test and
As-sessment Modeling, 56, 219-236.
Torp, L., & Sage, S. (2002). Problems as possibilities: Problem-based learning for K–12
education, (2nd ed.) Alexandria, VA; ASCD.
Wang, L, MacCann, C., Zhuang, X., Liu, O. L., & Roberts, R. D. (2009). Assessing teamwork
and collaborations in high school students: A multimethod approach. Canadian Journal of
School Psychology, 24, 108-124. doi: 10.1177/0829573509335470
Wholey, D. R., Zhu, X., Knoke, D., Zellmer-Bruhn, & Witheridge, T. F., (2012). The
team-work in assertive community treatment (TACT) scale: Development and validation.
Appendix A
The Teamwork scale
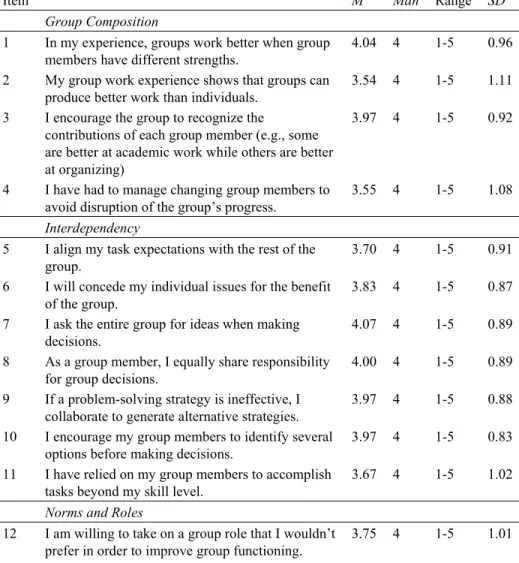
Table A1 presents the items comprising the downward extension of the Teamwork scale used in the present study. Item means (on a scale from 1 to 5), medians, ranges, and standard deviations are provided.
Table A1:
Item Descriptives for the Teamwork Scale
Item M Mdn Range SD Group Composition
1 In my experience, groups work better when group members have different strengths.
4.04 4 1-5 0.96
2 My group work experience shows that groups can produce better work than individuals.
3.54 4 1-5 1.11
3 I encourage the group to recognize the
contributions of each group member (e.g., some are better at academic work while others are better at organizing)
3.97 4 1-5 0.92
4 I have had to manage changing group members to avoid disruption of the group’s progress.
3.55 4 1-5 1.08
Interdependency
5 I align my task expectations with the rest of the group.
3.70 4 1-5 0.91
6 I will concede my individual issues for the benefit of the group.
3.83 4 1-5 0.87
7 I ask the entire group for ideas when making decisions.
4.07 4 1-5 0.89
8 As a group member, I equally share responsibility for group decisions.
4.00 4 1-5 0.89
9 If a problem-solving strategy is ineffective, I collaborate to generate alternative strategies.
3.97 4 1-5 0.88
10 I encourage my group members to identify several options before making decisions.
3.97 4 1-5 0.83
11 I have relied on my group members to accomplish tasks beyond my skill level.
3.67 4 1-5 1.02
Norms and Roles
12 I am willing to take on a group role that I wouldn’t prefer in order to improve group functioning.
Item M Mdn Range SD
13 I ensure my group follows a process so members have to do their fair share of the work.
3.80 4 1-5 0.91
14 I make sure I understand my assigned role before working on my individual task.
4.06 4 1-5 0.81
15 My group members would say I always attend group meetings.
4.00 4 1-5 0.84
16 My group members would say I am always prepared for group meetings.
3.88 4 1-5 0.92
17 I consider group members’ strengths when task roles are assigned.
4.05 4 1-5 0.84
Goals
18 I align my individual goals to the goals of the group.
3.73 4 1-5 0.95
19 I am an active voice in identifying group goals. 3.87 4 1-5 0.93 20 I feel a sense of personal responsibility for group
outcomes.
4.12 4 1-5 0.88
21 I ensure that the goals of the team reflect the input of all group members.
3.92 4 1-5 0.85
22 I encourage the group to evaluate goal progress. 3.79 4 1-5 0.86 23 I have been on groups that were required to set
specific goals.
3.89 4 1-5 0.90
24 I have been on groups that had to follow a strict timeline to attain goals.
4.07 4 1-5 0.85
25 I would be willing to assume extra responsibilities for my group to achieve its goals.
4.03 4 1-5 0.95
26 I make a unique contribution (e.g., strengths, knowledge) to accomplishing group goals.