Employing the Components of the Human Development
Index to Drive Resources to Educational Policies
Annibal Parracho Sant’Anna•Rodrigo Ota´vio de Arau´jo Ribeiro• Steven Dutt-Ross
Accepted: 19 November 2010
Springer Science+Business Media B.V. 2010
Abstract A new form of composition of the indicators employed to generate the United Nations Human Development Index (HDI) is presented here. This form of composition is based on the assumption that random errors affect the measurement of each indicator. This assumption allows for replacing the vector of evaluations according to each indicator by vectors of probabilities of being the best or the worst according to such attribute. The probabilistic composition of such probabilities of preference according to each indicator into probabilities of being the best or the worst according to all of them generates indices that may unveil, on one hand, performances to be followed and, on the other hand, extreme conditions that an additive composition would hide. Differences between the results of application of the diverse forms of composition are examined in the case of the HDI and in the case of the districts version of the HDI employed to compare Brazilian municipalities. It is verified that the smallest correlation between the education enrolment rate and the other indicators in the Brazilian case enlarges such differences.
Keywords Human development indexDecision aidProbabilistic composition
Education
1 Introduction
Different forms of combining distinct indicators may lead to diverse combined evaluations. The United Nations Human Development Index (HDI) is formed by adding summands
A. P. Sant’Anna (&)R. O. de Arau´jo RibeiroS. Dutt-Ross
Universidade Federal Fluminense (UFF), Nitero´i-RJ, Brazil e-mail: [email protected]
R. O. de Arau´jo Ribeiro
e-mail: [email protected]
S. Dutt-Ross
Fundac¸a˜o Getulio Vargas (FGV), Rio de Janeiro-RJ, Brazil e-mail: [email protected]
which try to measure in equal scales the development in terms of education and health, besides economy. Some procedures are taken to standardize scales but such procedures do not take into account random errors that may affect the measurement of each parcel.
Another approach to combine the same basic measurements is here proposed. Taking such measurements as observations of random variables, this new approach allows for replacing the vector of evaluations according to each component of HDI by vectors of probabilities of being the best or the worst according to such component. The final scores are obtained by a probabilistic composition of such probabilities of preference according to each attribute into probabilities of being the best or the worst according to all of them.
In some countries a local version of HDI is computed to compare regions or districts of the nation. In Brazil, an index to compare the municipalities has been produced on the basis of 2000 National Census. This index has been used to select places with a deeper need of help, specially to drive allocation of resources to educational programs. In this paper, differences between the results of the diverse forms of composition are examined in the case of the HDI and in the case of the districts version of the HDI employed to compare Brazilian municipalities.
It is here verified that the smaller correlation between one of the components of the education indicator, the gross school enrolment rate, with the other components of the index in the Brazilian case enlarges such differences. It is also noticed that this component presents also a smaller correlation with the quality of the local educational system as measured by the gap between age and schooling than the other components of HDI. This suggests that an index that takes into account all components may be in fact more useful than the educational component alone to select districts in need of programs of help to their educational system.
The next section presents HDI and discusses its composition. Section3 studies the Brazilian version of HDI. Section4 describes the probabilistic composition. Section5
compares the results of application of the diverse composition approaches. Section6
concludes the paper.
2 The Human Development Index
Building an index is always arbitrary. A first choice involved in that is deciding whether it is going to be a combination of various dimensions and, in that case, which dimensions to consider. Reality does not dictate the dimensions to be chosen. Would such be the case, all researchers would always use the same indices (Santos2004).
HDI was created in 1990 by the United Nations Development Programme. It has been since then the basis of UN Human Development Report.
The primary goal of the Report and of the Index is calling attention to dimensions such as Health and Education that may not be correctly appraised in the ranking of the countries by traditional Production and Income indices.
HDI combines three dimensions: education, longevity as measured by life expectancy at birth (LE) and economic standard of life, measured by the natural logarithm of the Gross Domestic Product per capita (GDP/c) at Purchasing Power Parity (PPP). The use of the logarithmic transformation and the scaling by PPP reduces the evaluation of the distance between the more developed countries and the others.
Analogously the economic standard of life index is bounded between zero and 1 by subtracting in the numerator from the logarithm of the per capita gross domestic product observed in the country the logarithm of the minimum of 100 dollars and dividing by the difference between the logarithms of the maximum of 40,000 dollars and the minimum of 100 dollars.
The educational indicator is generated by a composition of an adult literacy index (ALI) and a gross enrolment rate (GER). In this composition, ALI is loaded with twice the weight of GER. ALI counts as illiterate that part of the population of ages 15 and older unable to write a simple note. GER is calculated by expressing the number of students enrolled in primary, secondary and tertiary levels of education, regardless of age, as a percentage of the population of official school age for the three levels. It may be larger than 1, as all people above school age enter the numerator. In Brazil only students in Adult Alphabet-ization classes do not enter this numerator and the denominator is the number of inhab-itants below 25 years old.
After two decades, better indications of quality of Health and Education systems would be welcome. For instance, a per capita National Health Budget might complete life expectancy to evaluate health levels. Besides, new dimensions have gained importance. A fourth and a fifth dimension seem now needed to be taken into account to add care with the environment, which might be measured, for instance, by the per capita volume of CO2emissions, and the
protection of civil rights, which might be measured, for instance, by the number of judges or the number of public defenders per habitant. Booysen (2002), Michalos (2004) and Mackeprang et al. (2009) develop evaluations of the effects of changes on these directions. Additive or weighted average indices are difficult to change. The introduction of new components forces an entirely new search for weights and results on conceptual incom-parability through time.
A stronger argument against a weighted average HDI is that the effort to produce a breakthrough has the same pay as an easy improvement in any component with a low score. Suppose a country that develops a potion able to bring eternal youth to earth at the cost of not employing currency or alphabet. Its HDI would be 0.33, below the 2009 lowest HDI, of 0.34, for Niger. Even with a median value in the economic and educational components, its HDI would be 0.66, what would put that country in the class of countries of low HDI. On the other hand, Norway, with HDI of 0.97, might be thought to reach perfection if reduces its suicide rate to rise average lifetime from 80 to 85.
Additivity in the composition of the index results in giving the same importance to a crucial advancement at a frontier as to a banal step in the middle of the road.
The index should stimulate efforts for a breakthrough (or, on the other hand, to elim-inate any critical drawback) in any specific direction, instead of stimulating for just improving position in the easiest direction.
Another technical argument against weighted average is that it implicitly raises the weight of dimensions that are represented by highly correlated indicators, as any trait present in two indicators is counted twice. The correlations between the indicators com-bined in HDI are high, as shown by Table1.
3 Human Development Index of Brazilian Districts
employing the data of 2000 Census. In US, an American Human Development Report was published the first time in 2009 by Columbia University Press and The Social Science Research Council.
In Brazil, HDI-M has been used to select municipalities for programs of education. Education is a factor of change, critical to the reduction of inequality through the break-down of social barriers. Schooling has been found a main factor of economic opportunities and improvement in quality of life. Henriques (2002) based on data on living standards states that approximately 58% of the wage differential between blacks and whites in Brazil is associated with educational inequality. According to Henriques (2002), the study of the conditions of access, retention and performance in school provides basic elements for the analysis of the magnitude of inequality between the races.
It is important to notice the size of Brazil and the differences that emerge from regional features. Such differences go beyond social, economic and cultural traits. These speci-ficities are present substantially in aspects of education. Many digital inclusion programs in Brazil, like Paranavegar Telecenter, Petrobras Telecenters Brazil House, Brazil House Project and GESAC, use HDI-M as a criterion to decide on the allocation of resources.
New techniques for generating a new classification of Brazilian municipalities have already been applied previously by Bezerra (2002) and Cavassin (2004). The first used a Data Envelopment Analysis (DEA) model. The ranking generated was employed to explain the efficiency of the allocation of municipal resources, as the calculus of HDI does not take into account the resources used for actions that can ultimately improve the components of the index. In the work of Cavassin (2004), were applied AHP (Saaty1977), Electre (Roy1968) and Promethee (Brans et al. 1986) methods. In all these multiple criteria composition approaches, subjective intervention appears in the determination of the weights of the criteria. Inequalities in access to education in Brazil are identified by Soares and Alves (2003) using socioeconomic, racial, location and type of school (public, private) filters. Other aspects of the educational problem must be taken into account.
Ferraro (1999) analyses limitations of approaches to underdevelopment that are restricted to global data. He emphasizes that the return to the prospects for global or national analysis can not mean abandoning the regional perspective, for him the only way to cope with the inequalities and internal contradictions. Ferraro (1999) calls attention to the fact that asking why so many children are excluded from school is not the same as asking why so many children fail to attend school or evade it.
Repetition and school delay are analyzed in the works of Schiefelbein (1975), Ribeiro (1991), Bergmann (1996) and Vulliamy and Webb (2000) as relevant variables in the process of school evasion. Schiefelbein (1975) emphasizes that repeating means ineffi-ciency. The same place in the grid is used more than one year by the student in order to master some educational task. Vulliamy and Webb (2000) use the school gap and repetition rate as indicators for strategy analysis of state action to reduce school exclusion.
Table 1 Correlations of HDI Components in 2009
HDI LE Ln GDPc Education Literacy
LE 0.92
Ln GDPc 0.94 0.79
Education 0.92 0.78 0.79
Literacy 0.88 0.74 0.74 0.98
Ribeiro (1991) points out that the probability of a new student in a grade being approved is almost twice the probability of that student already repeating the series. This shows that repetition tends to cause new school failures, contrary to what the pedagogical culture in Brazil suggests, that repeating helps children progress in their studies. Thus, the educa-tional components in HDI, by failing to take into account repetition and lag, leave aside quality aspects of education that may need to be more precisely considered.
HDI was constructed under the assumption that each society is partially closed, i.e., enclosed in its economic dimension (the society’s members are the owners of all factors of production) and bounded in its population size (no temporary migration). This does not happen in the case of municipalities, which are relatively open geopolitical areas. Therefore, it does not make sense to compare absolute values of HDI-M with HDI of countries, nor the HDI for municipalities in a region with those of other municipalities in which the economic autonomy or geographical mobility are different.
On the other hand, by taking into account the objectives, dimensions and some of the limitations of HDI and HDI-M, it becomes possible to question whether this is the ideal index to evaluate the situation of the education level of a municipality. This question can be solved objectively by comparing different approaches.
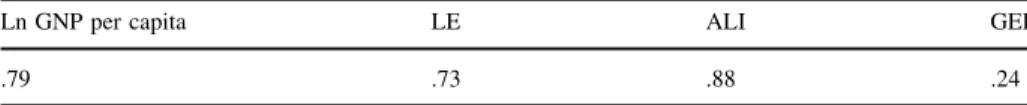
A measure that is used to measure the quality of teaching is the average schooling gap, the lag between the series in which the student should be and where he or she is. This lag does not affect the enrolment rate because for this rate what matters is the number of student registered (Vianna2005). Table2presents the correlation coefficients between the components of HDI and the average schooling gap. It shows that enrolment and school success are considerably different traits.
In Brazil, the correlation between the educational components is not as strong as in the HDI for countries, as shown by Table3. This suggests that, given the high correlation of the other two components with the education indicator, it may be better to use the full HDI index than the education indicator to select districts for education programs.
4 Probabilistic Composition
In the probabilistic composition the score according to each criterion is the probability of being the best in a sample according to that criterion. It avoids weighted averages by composing the preferences by joint probabilities, like the probability of being the best according to every criterion. The computation of these probabilities may assume
Table 2 Correlation of IDH-M components with schooling gap
Ln GNP per capita LE ALI GER
.79 .73 .88 .24
Table 3 Inner Correlation of HDI-M Components
Ln of GNP per capita ALI GERt
Life expectancy .79 .89 .21
Ln of GNPc .78 .15
independence or take into account the correlations. Weighted averages may still be used in the probabilistic composition, by taking the preferences according to each criterion as conditional probabilities. The weights will then be given by the probabilities of each criterion prevailing.
From any kind of measurement a ranking of the competing options can be derived. On the other hand, a ranking with possible ties and empty spaces may represent every distance between the different options that one may have in mind. To compute the probabilities of being the best option all we need, besides such a ranking, is a statistical measure of the uncertainty affecting each position in that ranking. To take uncertainty into account, the rank of each option, or any other numerical indication of its position, may be seen as a location parameter of a statistical distribution.
How to obtain the probabilities of choice according to each criterion? Probabilistic composition as here applied uses the idea of membership functions of fuzzy sets: instead of a measure x, a distribution of probabilities with mode at x and extremes at a lowest and a highest admissible value. Then it computes the probability of an observation taken from this distribution be larger (or smaller) than values taken from all the other distributions or from a few selected distributions.
Once the observed measurements, thought at the beginning as deterministic, are seen as estimates of location parameters, estimates of other parameters can be derived from the same set of observations. For instance, the observed range, i.e., the range of observed values for the criterion in the whole set of examined options, may be used as an estimate for a common range for these distributions. This implies assuming that the inner variation in the measurement of each option is the source of the variation between the measurements of the different options, what is reasonable in principle.
Different assumptions on the form of the distribution may be taken to complete their modelling. To compensate for the lack of empirical information, simplifying and equal-izing assumptions similar in the essence to those of Fuzzy Sets Theory (Zadeh1965) and assumptions of independence between the disturbances affecting the different observations will provide a precise framework. The distributions may be assumed, for instance, normal with identical variance, or uniform with identical range, or triangular distributions with the same maximum and minimum points.
To make easier the comparisons, the probabilities of being the most preferred option may be computed with respect to a sample of fixed size, drawn in fixed percentiles of the set of observed values. In the application discussed below, this sample is formed by the nine deciles. This sample size has the advantage of presenting evaluations always dis-tributed around the value of one tenth. This is the value that would be given to all options if they were indiscernible. In general, with n options being evaluated by the ordered values x(1),…, x(n), the k-th decile will be given by
dk¼x i kðð ÞÞwith i kð Þ ¼ kn=10 ifthisisanintegeror dk¼½x kð n=101=2Þ þx kð n=10þ1=2Þ=2 otherwise:
To set the dispersion, maximum and minimum values for each distribution may be derived from the maximum and minimum observed values. In the present application, a triangular continuous distribution with constant minimum and maximum is assumed, as is usual for membership functions of fuzzy sets theory (Petrovic et al.2008; Liang and Cheng
Instead of asymmetric triangular distributions, symmetric distributions may be assumed, with standard deviation derived from the observed range. Uniform distributions are assumed in Sant’Anna (2002) and normal distributions in Sant’Anna (2005). In this last case, to follow again a common practice, the sample range may be used as the starting point and an estimate for the standard deviation be derived dividing it by the normal relative range (Montgomery2009).
The probability of an option being evaluated as the first can be computed by integrating with respect to the joint density the probability of such option presenting a value better than that of each other option. After computing the probabilities of being the preferred option according to each criterion, it is easy to combine them into a unique measure of global preference.
When computing joint preferences according to multiple criteria, the dependence between the criteria may be directly taken into account. In Sant’Anna and Ribeiro (2009), it was pointed out that the composition of fuzzy logic (Zadeh1978) by the necessity and possibility concepts, that is equivalent to take, respectively, the minimum and the maxi-mum of the membership probabilities, corresponds to assuming an extreme value for the correlation between indicators of preference. This follows from the trivial fact that the highest correlation is that making the probability of the intersection equal to the lowest probability among those of the events intercepted.
A practical advantage of the probabilistic composition, besides treating realistically the imprecision, is that it allows for paying less attention to small variations and pay more attention to gross mistakes and frauds. It also allows for taking approaches proper to produce scores for specific uses.
5 Application of Probabilistic Composition to the Evaluation of Human Development
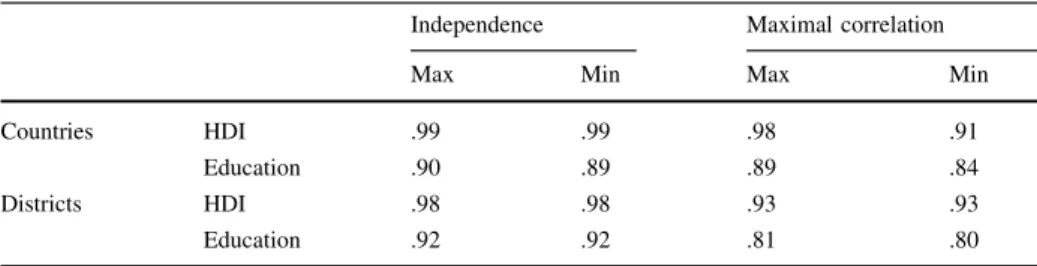
Four probabilistic compositions of the three components of the HDI are here performed. Two of them ordering by the probability of being the best according to all the three components and two of them ordering by the probability of being the worst, two of them assuming independence between the components and two of them assuming maximal correlation—what corresponds to the fuzzy necessity approach and leads to take as the global score the minimum among the scores for each component.
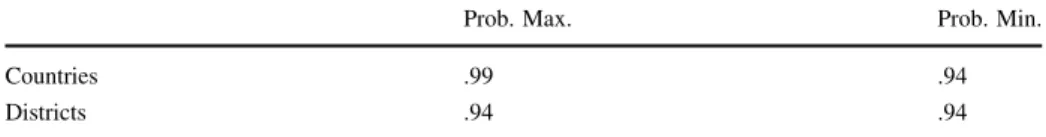
Table4 shows the Spearman correlation coefficients of the scores resulting from the application of these four distinct composition approaches with the values of HDI and Table5 the Spearman correlation coefficients between the vectors of probabilistic pref-erences assuming independence and assuming maximal dependence between the compo-nents. The Spearman correlation coefficients are employed instead of the Pearson
Table 4 Correlation of Probabilistic Composition Scores with HDI
Independence Maximal correlation
Max Min Max Min
Countries HDI .99 .99 .98 .91
Education .90 .89 .89 .84
Districts HDI .98 .98 .93 .93
correlation coefficients to avoid the influence of the changes in scales due to the proba-bilistic transformation. These ranks correlations are computed for the applications to the data of countries and to the data of Brazilian districts.
These tables consistently reveal larger correlations under independence. This may be explained by the hypothesis of independence between the criteria allowing for taking into account more information.
The correlations are also higher in the countries context, specially under the dependence assumption. This may be attributed to the smaller dependence between the criteria mea-sured at district level allowing for different criteria compositions raising different vectors of scores.
Finally, the correlations of the probabilistic indices with HDI-M as well as with its educational component are high as was to be expected. The differences in the kind of frontier approached must substantially affect the set of units selected at the extreme positions but not necessarily produce large changes of order along the classification.
The analysis of the extreme positions in the ranking is enlightening. Manari-PE, the district with the lowest HDI-M, loses to Centro do Guilherme-MA, which has the 5th lowest HDI-M, the position of worst when applied the composition by the probability of being the worst according to the three criteria simultaneously, assuming maximal depen-dence. Decisive for that is the score on income, due to this component higher homogeneity. Centro do Guilherme is also the district with the lowest expectancy of life. Assuming independence, Manari comes to the fourth place, losing to, in this order, Guaribas-PI, Traipu-Al and Araioses-MA, which are those districts presenting the third, fourth and sixth lowest HDI.
To provide a basis for assigning resources for improving education, another computa-tion was performed, raising the importance of educacomputa-tion by taking the four components of IDH in an equal standing. Assuming independence, the maximization of the probability of being the worst, as well as the minimization of the probability of being the best, places in the first place Jordao-AC, which was the second lowest by the IDH-M. The other five districts presenting the lowest IDH-M are then no longer between the six worst.
These results show that varying the approach to combine the same features considered in HDI in a local level may lead to the selection of different districts. The differences seem to be less relevant in an international level, where the components of the index are more correlated. Among the countries, Niger, the country with the lowest HDI, presents also the smallest probabilistic global score, whatever the assumptions taken for the composition.
6 Conclusion
This article explored the possibility of using alternative forms of composing the indicators employed in HDI and HDI-M. The availability of ratings according to different points of view can guide the decision for various purposes.
Table 5 Correlation between dependent and independent compositions
Prob. Max. Prob. Min.
Countries .99 .94
The ability to raise data on specific features of a given territory has become important piece to measure their development. This measurement is essential when public authorities want to build a more equitable way to drive the action of public power for different priorities. For instance, to ensure that all citizens have access to education, it is necessary to construct indicators and criteria employed to evaluate projects and programs of public policy for this purpose.
The analysis here performed reveals that, although there is strong correlation between the indicators of quality of life now used, the form of construction of the index, in the case of evaluating Brazilian districts, will lead to significantly diverse rankings. In fact, we found that although the various global indices proposed lead to highly correlated rankings, varying the importance they assign to the frequency to school classes will change con-siderably the results of the selection of extreme cases.
The ordering and selection of the municipalities whose population is going to be subject to a certain action should if possible provide also information on the possible outcomes of such action. The different probabilistic composition indices studied here are shown to provide information that may be useful in the selection of municipalities to be object of specific actions and the effect o such actions may be evaluated by changes in probabilities. This occurs, for instance, when ordering according to the probability of being the worst in some indicator to select municipalities in which projects of equalization of opportunities in certain directions of the educational system can be more efficient.
One last feature to be highlighted concerns the analysis of correlations with the variable measuring the schooling delay. The analysis here developed led to the hypothesis that the longevity and income components of the HDI can be utilized as better proxies for the quality of education offered in the Brazilian municipalities than the educational compo-nents themselves. This, by one side, justifies employing the HDI instead of its compocompo-nents alone. On the other hand, it emphasizes the need for developing specific indicators.
References
Bergmann, H. (1996). Quality of education and the demand for education: evidence from developing countries.International Review of Education, 42(6), 581–604.
Bezerra, E. P. G. (2002). Uso de DEA como alternativa ao IDH na mensurac¸a˜o do desenvolvimento humano nos maiores municı´pios brasileiros.XXII Encontro Nacional de Engenharia de Produc¸a˜o.Curitiba. Booysen, F. (2002). Na overview and evaluation of composite indices of development.Social Indicators
Research, 59(2), 115–151.
Brans, J. P., Vincke, Ph., & Mareschal, B. (1986). How to select and how to rank projects: The PROM-ETHEE method.European Journal of Operational Research, 24, 228–238.
Cavassin, S. A. (2004). Uso de metodologias multicrite´rio na avaliac¸a˜o de municı´pios do Parana´ com base no ı´ndice de desenvolvimento humano municipal,Dissertac¸a˜o de Mestrado em Me´todos Nume´ricos em Engenharia. Universidade Federal do Parana´.
Ferraro, A. R. (1999). Diagno´stico da Escolarizac¸a˜o no Brasil.Revista Brasileira de Educac¸a˜o, Sa˜o Paulo, 12, 22–47.
Henriques, R. (2002). Rac¸a e geˆnero no sistema de ensino: os limites das polı´ticas universalistas na educac¸a˜o. Brası´lia: UNESCO.
Liang, T. F., & Cheng, H. W. (2009). Application of fuzzy sets to manufacturing/distribution planning decisions with multi-product and multi-time period in supply chains.Expert Systems with Applications, 36, 3367–3377.
Michalos, A. (2004). Social indicators research and health related quality of life research.Social Indicators Research, 65(1), 27–72.
Montgomery, D. C. (2009).Introduction to statistical quality control(6th ed.). N. York: Wiley. Petrovic, S., Fayad, C., & Petrovic, D. (2008). Sensitivity analysis of a fuzzy multiobjective scheduling
problem.International Journal of Production Research, 46, 3327–3344.
Ribeiro, S. C. (1991). A pedagogia da repeteˆncia.Sa˜o Paulo, Estudos Avanc¸ados, 5(12), 7–21.
Roy, B. (1968). Classement et choix en pre´sence de points de vue multiples (la me´thode ELECTRE).Revue Franc¸aise d0Informatique et de Recherche Ope´rationnelle, 8, 57–75.
Saaty, T. L. (1977). A scaling method for priorities in hierarchical structures.Journal of Mathematical Psychology, 15, 234–281.
Sant’Anna, A. P. (2002). Data envelopment analysis of randomized ranks.Pesquisa Operacional, 22(2), 203–215.
Sant’Anna, A. P. (2005). Composic¸a˜o Probabilı´stica de Crite´rios na Avaliac¸a˜o de Cursos.Revista Brasileira de Po´s-Graduac¸a˜o, 02, 40–54.
Sant’Anna, A. P., & Ribeiro, R. (2009). Statistical modeling and probabilistic composition in the prediction of the customer lifetime value.Benchmarking International Journal (BIJ), 16(3), 335–350. Santos, W. G. (2004).Censos, Ca´lculos, I´ndices e Gustave Flaubert. Rio de Janeiro: Jornal do Brasil. Schiefelbein, E. (1975). Repeating: an overlooked problem of Latin American education. Comparative
Education Review, 19(3), 468–487.
Soares, J. F., & Alves, M. T. G. (2003). Desigualdades Raciais no Sistema Brasileiro de Educac¸a˜o Ba´sica.
Educac¸a˜o e Pesquisa, Sa˜o Paulo, 29(1), 147–165.
Vianna, S. B. (2005). I´ndice de Desenvolvimento Humano na Cidade do Rio de Janeiro.Cadernos de Controladoria, ano V, n83, Prefeitura do Rio de Janeiro.
Vulliamy, G., & Webb, R. (2000). Stemming the tide of rising school exclusions: problems and possibilities.
British Journal of Educational Studies, 48(2), 119–133.
Zadeh, L. A. (1965). Fuzzy sets.Information and Control, 8, 338–353.