www.atmos-chem-phys.net/9/4185/2009/ © Author(s) 2009. This work is distributed under the Creative Commons Attribution 3.0 License.
Chemistry
and Physics
A daytime climatological distribution of high opaque ice cloud
classes over the Indian summer monsoon region observed from
25-year AVHRR data
A. Devasthale1,*and H. Grassl1,2
1Meteorological Institute, University of Hamburg, Hamburg, Germany 2Max Planck Institute for Meteorology, Hamburg, Germany
*now at: Swedish Meteorological and Hydrological Institute, Norrkoping, Sweden
Received: 8 August 2008 – Published in Atmos. Chem. Phys. Discuss.: 5 January 2009 Revised: 17 June 2009 – Accepted: 17 June 2009 – Published: 24 June 2009
Abstract. A daytime climatological spatio-temporal distri-bution of high opaque ice cloud (HOIC) classes over the In-dian subcontinent (0–40◦N, 60◦E–100◦E) is presented us-ing 25-year data from the Advanced Very High Resolution Radiometers (AVHRRs) for the summer monsoon months. The HOICs are important for regional radiative balance, pre-cipitation and troposphere-stratosphere exchange. In this study, HOICs are sub-divided into three classes based on their cloud top brightness temperatures (BT). Class I rep-resents very deep convection (BT <220 K). Class II repre-sents deep convection (220 K<=BT <233 K) and Class III
background convection (233 K<=BT <253 K). Apart from
presenting finest spatial resolution (0.1×0.1 degrees) and
long-term climatology of such cloud classes from AVHRRs to date, this study for the first time illustrates on (1) how these three cloud classes are climatologically distributed dur-ing monsoon months, and (2) how their distribution changes during active and break monsoon conditions. It is also in-vestigated that how many deep convective clouds reach the tropopause layer during individual monsoon months. It is seen that Class I and Class II clouds dominate the Indian subcontinent during monsoon. The movement of monsoon over continent is very well reflected in these cloud classes. During monsoon breaks strong suppression of convective ac-tivity is observed over the Arabian Sea and the western coast of India. On the other hand, the presence of such convective activity is crucial for active monsoon conditions and all-India
Correspondence to:A. Devasthale (abhay.devasthale@smhi.se)
rainfall. It is found that a significant fraction of HOICs (3– 5%) reach the tropopause layer over the Bay of Bengal dur-ing June and over the north and northeast India durdur-ing July and August. Many cases are observed when clouds pene-trate the tropopause layer and reach the lower stratosphere. Such cases mostly occur during June compared to the other months.
1 Introduction
4186 A. Devasthale and H. Grassl: Climatological distribution of convective clouds over India the cloud-precipitation interactions and to characterize the
hydrological cycle during the monsoon season.
The Indian summer monsoon also exhibits intraseasonal variability which is manifested through the active and break conditions and affects the total amount of rainfall received during the monsoon season (Webster et al., 1998; Goswami and Ajaya Mohan, 2001; Gadgil, 2003). The footprints of such active and break spells of monsoon can be seen in the way convective cloud classes are distributed during such pe-riods and help in understanding cloud-precipitation interac-tions during such contradicting condiinterac-tions. So far, there are few studies that investigate the climatology of deep convec-tive clouds from the satellite sensors, however they use only few years of satellite sensor data and/or have very coarse spatio-temporal resolution (Stubenrauch et al., 1999; Wylie and Menzel, 1999; Gettelman et al., 2002; Jiang et al., 2004; Liu and Zipser, 2005; Stubenrauch et al., 2006; Tang and Chen, 2006; Rossow and Pearl, 2007; Hong et al., 2008), and more importantly, do not explicitly examine the distri-bution of various convective cloud classes during individual monsoon months over India.
The data from satellite sensors provide unique indepen-dent view on the cloud systems from space and are very useful to study various aspects of monsoon (Srinivasan and Joshi, 2007). The Advanced Very High Resolution Radiome-ter (AVHRR) sensors onboard series of National Oceanic and Atmospheric Administration (NOAA) satellites offer the longest and continuous data to study clouds. These more than 25 years of data provide a wealth of information, which can be exploited to characterize clouds during monsoon. Us-ing these data, the present study for the first time attempts to investigate the following aspects over the Indian subcon-tinent (0–40◦N, 60◦E–100◦E). (1) How high opaque ice cloud (HOIC) classes are climatologically distributed dur-ing summer monsoon months? (2) How does their distri-bution change during active and break monsoon conditions? It is also investigated that how many overshooting convec-tive clouds reach the tropopause during individual mon-soon months. This study presents in finest spatial resolution (0.1×0.1 degrees) the long-term climatology of such cloud
classes from the AVHRRs to date over the Indian subconti-nent.
2 Data processing, cloud detection and typing
The data from the AVHRRs onboard five afternoon NOAA satellites, namely NOAA-7 (1982–1984), NOAA-9 (1985– 1988), NOAA-11 (1989–1994), NOAA-14 (1995–2000) and NOAA-16 (2001–2006) are used for the analysis. The Global Area Coverage (GAC) level 1b data with the approximate spatial resolution of 5 km×3 km are processed for May, June,
July, August and September months of each year from 1982 to 2006. The raw level 1b GAC data are calibrated and inter-calibrated to ensure homogenisation of the data across
differ-ent satellite platforms. The AVHRR is a five-channel instru-ment. Two channels are in the solar spectrum (0.58–0.68µm and 0.725–1.1µm) and two are in the thermal infrared spec-trum (10.3–11.3µm and 11.5–12.5µm). The third channel falls partly in the solar and in the thermal infrared spectrums (3.55–3.93µm). The solar channels are intercalibrated us-ing the methodology given in Rao and Chen (1995); Kid-well (1998); Goodrum et al. (2000); Devasthale and Grassl (2006). The thermal infrared channels are calibrated us-ing blackbody and space information embedded in the L1b data streams (Kidwell, 1998; Sullivan, 1999; Devasthale and Grassl, 2006). Since thresholds from the thermal channels of AVHHRs are heavily used in the cloud detection and typ-ing algorithms, it is imperative to validate the brightness temperatures derived from them and also assess the consis-tency of them across different satellite platforms. Devasthale and Grassl (2009) compared brightness temperatures derived from 11 and 12 micrometer channels of AVHRRs for June, July and August months (coldest months and minimal at-mospheric influence) of 25-year period from 1982–2006 at five stations in Antarctica with the insitu measurements and found very good correlation among them. They found no sig-nificant deviations in the derived surface temperatures due to the change of satellite platform suggesting consistent calibra-tion and intercalibracalibra-tion of the thermal channels.
The Clouds from AVHRR Phase 1 (CLAVR-1) algorithm developed by Stowe et al. (1999) is implemented to detect clouds. It is a hierarchical decision tree algorithm that uses thresholds based on spectral and spatial signatures of clouds and the underlying surface. It categorizes the 2×2 pixel
ma-trix into cloudy, clear or mixed. Only cloudy pixels are used for the analysis. Further details on the physical basis of the different tests, thresholds used and validation can be seen in Stowe et al. (1999). The algorithm developed by Pavolo-nis et al. (2005) is implemented to decide if the cloudy pixel represents the opaque ice cloud or any other type. The al-gorithm is quite robust and categorizes cloudy pixel into five broad classes, namely water clouds, thin ice clouds, opaque ice clouds, mixed phase/supercooled clouds, and cloud over-lap. The physical basis for cloud typing and validation can be seen in Pavolonis et al. (2005). In brief, using the com-bination of cloud detection and typing algorithms, the pixel is called high opaque ice cloud if; (1) detected as cloudy by CLAVR-1, and (2) channel 4 brightness temeperature is less than 253 K, and (3) no thin cirrus is detected, and (4) no cloud overlap is detected (avoids overlaying thin cirrus, based on Pavolonis et al. (2005), and (5) near-infrared re-flectance (channel 3b) is less than given threshold (6% in this case, ensures ice phase of opaque cloud, based on Pavolonis et al., 2005). Since cloud typing algorithm uses channel 1 and channel 3b reflectances, the application of the algorithm is limited to daytime.
deep convection (220 K<=BT <233 K) and Class III
back-ground convection (233 K<=BT <253 K). The Class II and Class III clouds may also contain stratiform clouds broken from convective elements and thick anvil cirrus. This cat-egorization is roughly adopted from Roca and Ramanathan (2000), where they used thresholds of 220 K, 235 K, and 255 K. The cloud classification algorithm also employs sim-ilar thresholds while classifying the cloudy pixels (233 K, 253 K). Thus, there is a physical basis (see Roca and Ra-manathan, 2000) as well as an algorithm constraint for adopt-ing these thresholds ofBTs to subdivide HOICs (see Pavolo-nis et al., 2005). In studies using thermal infrared mea-surements, it is quite common approach to apply the bright-ness temperature threshold (around 11 micrometers) to de-fine convective clouds. However, it is to be noted here that with five channels of the AVHRR, it is difficult to separate convective core from associated stratiform clouds and op-tically thick anvil cirrus (without the knowledge of optical depth). Therefore in this study, to be technically accurate, these clouds are referred to as HOICs rather than convec-tive clouds (but nonetheless, they represent convecconvec-tive clouds at various stages of their life and therefore can at least be viewed as tracers of convection). The cloud amount is calcu-lated as the ratio of number of pixels qualifying criteria for the particular cloud class to the total number of pixels in a scene.
3 Results and discussions
3.1 Spatio-temporal distribution of HOICs
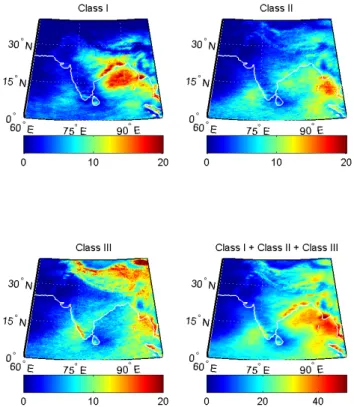
Broadly speaking, summer monsoon approaches the Indian subcontinent in two main branches. The western branch moving over the Arabian sea approaches the western coast of India, while the other branch moves over the Bay of Ben-gal approaching eastern, northeastern and central India. The Eastern and Western Ghats are the two mountain barriers across the approaching direction of monsoon along the two coasts of Indian Peninsula. The great Himalayan mountains and the Tibetan Plateau act as barriers for the north, eastern and northeastern approach of monsoon. The bulk of the pre-cipitation occurs over the Bay of Bengal, eastern, northeast-ern and the central India, and along the Eastnortheast-ern and Westnortheast-ern Ghats. Since most of the monsoonal rainfall occurs through convective (and associated stratiform) clouds, the footprints of the movement of monsoon over the Indian subcontinent could be seen in the HOIC classes. Figure 1 shows 25-year mean cloud amount for three classes of HOICs. Class I clouds are predominantly present over the Bay of Bengal, while they are less frequent over the Arabian Sea (especially over the northern Arabian Sea). They are also frequently seen along the Eastern Ghats (the states of Orissa and West Ben-gal), over the eastern and northeastern India. Class II clouds are frequent over the eastern Bay of Bengal and the
south-Fig. 1. Climatological spatial distribution of cloud amount (in %) for three classes of HOICs averaged over the monsoon months of May, June, July, August and September for 1982–2006 period.
west coast of India along the Western Ghats. Class III clouds show similar spatial pattern as Class II clouds over India and adjacent oceans, however, there is very high frequency of these clouds over the Tibetan Plateau. Over the Bay of Ben-gal and the north and northeast India, Class I clouds dominate other cloud types, thus indicating that the overshooting con-vection over these areas is very likely possible. The Bay of Bengal is, in fact, considered as an important region where convection is often very deep and intense during monsoon (Bhat et al., 2001; Zuidema, 2003).
4188 A. Devasthale and H. Grassl: Climatological distribution of convective clouds over India
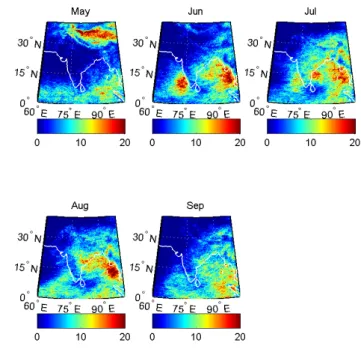
Fig. 2.Class I cloud amount (in %) for individual monsoon months averaged over years from 1982 to 2006.
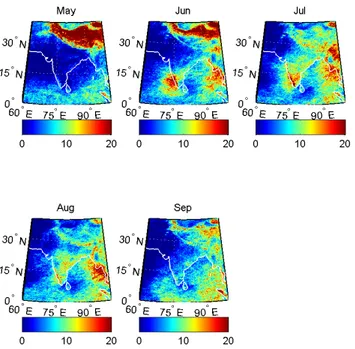
(around 30◦N) covering the central, northern and northeast-ern India. In September as the monsoon weakens, very deep convection is reduced and starts receding equatorwards. The very deep convection over the Arabian Sea and along West-ern Ghats peaks during June and is considerably weaker dur-ing other months compared to the Bay of Bengal. The Ara-bian Sea near the southwest coast of India distinctly shows high Class II clouds (Fig. 3) compared to Class I in June. The Class II and Class III clouds are widespread over the southern Indian peninsula compared to Class I clouds. The Tibetan Plateau experiences very high cloud fraction of Class II clouds in May and Class III clouds in May and June. The Tibetan Plateau is argued to be one of the major pathways for transporting moisture to the upper troposphere (Fu et al., 2006). In general, the northwestern part of India experiences extremely low HOIC amount.
There is a continuing debate on what mechanism may be the main driver of monsoon (Chao and Chen, 2001; Gadgil, 2003; Srinivasan and Joshi, 2007). One hypothesis is that the monsoon is a giant land-sea breeze system occurring ev-ery year due to the strong thermal contrast between land and ocean during the pre-monsoon months (April, May). An-other hypothesis argues that the monsoon is nothing but the seasonal migration of the Intertropical Convergence Zone (ITCZ) (Chao and Chen, 2001; Gadgil, 2003). Some of the arguments given against the land-sea breeze system hypoth-esis are (a) how monsoon sustains in July, August, Septem-ber months when the thermal contrast is not strong anymore; (b) why the northwestern Indian continent (one of the hottest parts) does not receive rainfall; (c) the monsoon arrives over
Fig. 3.Same as Fig. 2, but for Class II clouds.
the southern Indian coasts in June, while the hottest months are April and May. Although this dataset in itself is not enough to corroborate or refute any mechanism, it could be a useful tool in investigating some of the aspects in this con-text. Figure 5 shows the vertical distribution of HOICs and their intraseasonal migration in the 2-D histograms of rel-ative cloud amounts of HOICs with the brightness temper-ature on y-axis and the latitude on x-axis for the monsoon months (each bin size is 1 K by 0.1 degrees). TheBT range on y-axis is from 253 K (bottom) to 173 K (top). The cloud amount is zonally averaged from 60◦E to 100◦E. The rela-tive cloud fraction at eachBT-Latitude bin is calculated by dividing the cloud amount at that particularBT-Latitude bin by the total cloud amount accumulated over the entire his-togram. This gives a clear idea of not only the amount but also where the bulk of clouds occur as a function of height and latitude. It is evident from this figure that the bulk of clouds (in red and yellow shades) move northwards up to 10◦N in May, up to 20◦N in June, up to 25◦N in July and August, and then start receding equatorwards in September. Only five months during the monsoon season are not enough to study the ITCZ migration, nonetheless, it gives a hint that the HOICs follow the sun (i.e. the incident solar radiation). The Tibetan Plateau contributes to the very high cloud frac-tion seen in the 30–40◦N latitude belt in May and June. 3.2 Active and break spells of the rainfall
Fig. 4.Same as Fig. 2, but for Class III clouds.
break monsoon conditions are associated with the fluctua-tions of the tropical convergence zone (Goswami and Ajaya Mohan, 2001). So far three main parameters, namely the outgoing longwave radiation (OLR), 850 hPa wind, and the rainfall or combination thereof, are used to define active and break monsoon conditions (Webster et al., 1998; Goswami and Ajaya Mohan, 2001; Gadgil, 2003; Ramesh Kumar and Uma, 2004). In the present study, we used the most recent definition given by Ramesh Kumar and Uma (2004) to de-fine active and break conditions. Break spells are days when all-India daily rainfall is less than 9 mm/day and persists for a minimum of 3 days and occurs in July and August. Active conditions are defined as days when all-India daily rainfall is more than 15 mm/day and lasts for a minimum of 3 days and occurs in July and August. There are total 138 active days and 633 break days based on these criteria from 1982 to 2006.
Class I clouds dominate the northern and north-central In-dia during active monsoon conditions (Fig. 6). They occur quite frequently over the northern Bay of Bengal. On the other hand during break conditions (Fig. 7), Class I clouds are mainly observed over the Bay of Bengal and the east-ern parts of India. They are not as widespread over the land as during active conditions. There is a noticeable suppres-sion of these clouds over the western coast of India. The most pronounced changes are observed in the case of Class II and Class III clouds. Their frequency of occurrence is very high over the western coast of India and along the West-ern Ghats, while distinct suppression of these clouds is seen during break conditions. In general, it is observed that the strong convective activity is crucial over the western coast
May
0 10N 20N 30N 40N 200
250
0 5 10
x 10−5
Jun
0 10N 20N 30N 40N 200
250
0 5 10
x 10−5
Brightness Temperature (K)
Jul
0 10N 20N 30N 40N 200
250
0 5 10
x 10−5
Aug
0 10N 20N 30N 40N 200
250
0 5 10
x 10−5
Sep
0 10N 20N 30N 40N 200
250
0 5 10
x 10−5
Fig. 5. 2-D histogram (latitude vs. brightness temepratures (in k)) of cloud fraction showing intraseasonal migration of the monsoon.
TheBTs on y-axis range from 253K (bottom) to 173 K (top). The
bin size is 0.1 degrees by 1 K.
of India and Western Ghats for the active monsoon condi-tions (thus for “climatologically” normal all-India rainfall). There are two favoured locations of the tropical convergence zone during the summer monsoon (Sikka and Gadgil, 1980; Goswami, 1994; Goswami and Ajaya Mohan, 2001). First major zone is along the monsoon trough extending north of the Bay of Bengal, while the second zone is between equator and 10 S. During active conditions the northern tropical con-vergence zone is strong and the southern one is weaker, while the opposite is observed during break conditions. The results in Fig. 6 show very high amount of HOICs over the north-ern tropical convergence zone during active conditions which support earlier studies (Sikka and Gadgil, 1980; Goswami, 1994; Goswami and Ajaya Mohan, 2001). However during break conditions, since we have data only up to the equa-tor, the presence of secondary zone cannot be seen. Though there is some convective activity around the eastern equato-rial Indian Ocean during break conditions compared to active conditions.
3.3 Convection reaching the tropical tropopause layer (TTL)
4190 A. Devasthale and H. Grassl: Climatological distribution of convective clouds over India
Fig. 6. Distribution of cloud amount (in %) of three classes of HOICs during active monsoon conditions averaged over years from 1982 to 2006.
conditioning of the TTL region and in the troposphere-stratosphere exchange (Fueglistaler et al., 2009). Very deep and overshooting convective clouds bring moisture to the up-per troposphere lower stratosphere region. The critical issues like possible mechanisms/pathways of moistening or dry-ing of the lower stratosphere are still undergodry-ing research (Danielsen, 1982; Highwood and Hoskins, 1998; Sherwood and Dessler, 2000; Dessler, 2002; Gettelman et al., 2002; Sherwood and Dessler, 2003; Jain et al., 2006; Jensen et al., 2007; Lelieveld et al., 2007; Rossow and Pearl, 2007; Hor-vath and Soden, 2008; James et al., 2008). But the first step in investigating these issues further is to pinpoint the locations and frequency of the events when convection reaches and/or penetrates the TTL (Rossow and Pearl, 2007). There are al-ready studies in the past that investigate convection reaching or penetrating the TTL (Alcala and Dessler, 2002; Dessler et al., 2006; Rossow and Pearl, 2007; Hong et al., 2008), how-ever, the aim of the present evaluation is to exploit high reso-lution and long-term data during individual monsoon months to add further piece of information on this aspect. In order to do this, the brightness temperature threshold of 200 K is used to define convective clouds that reach the TTL (Rossow and Pearl, 2007). Figure 8 shows the distribution of HOICs colder than 200 K during the months of May, June, July, Au-gust and September averaged over 25-year period. In the Bay of Bengal a small fraction of the overshooting
convec-Fig. 7. Distribution of cloud amount (in %) of three classes of HOICs during monsoon breaks averaged over years from 1982 to 2006.
Fig. 8.Distribution of cloud amount (in %) HOICs reaching tropical tropopause layer during individual monsoon months averaged over years from 1982 to 2006.
180 185 190 195 0
2 4 6 8 10 12 14x 10
4
Cloud top brightness temperature (K)
Number of pixels
May Jun Jul Aug Sep
Fig. 9. Frequency distribution of pixels having brightness temper-ature less than 195 K (indicating penetration to the lower strato-sphere) over the area 13◦N–30◦N, 75◦E–92◦E. The data for
in-dividual monsoon months from 1982 to 2006 are used. The number of events in June are high compared to other months.
the TTL. In months of July and August, convective activity reaching the TTL strengthens over the land (the north and northeast India), while weakening over the Bay of Bengal. In September, the overall occurrences are weakened again as the monsoon subsides.
Since the northern and northeastern India and the Bay of Bengal show maximum occurrences reaching the tropopause layer, the area (13◦N–30◦N, 75◦E–92◦E) is selected over this region in order to further examine convection penetrat-ing the TTL and reachpenetrat-ing the lower stratosphere. The low-ermost end of histogram showing frequency distribution of clouds withBTs less than 195 K is plotted in Fig. 9. The x-axis showsBTs and y-axis number of HOIC pixels with BT <195 K for the months of May, June, July, August and September (for 25-year period). Most likely, these are events when convective overshoots penetrated into the TTL. High occurrence of such events stands out clearly for June com-pared to other months, which mainly comes from the Bay of Bengal region. It would indeed be very interesting to inves-tigate these events separately in the context of troposphere-stratosphere exchange. The July and August months experi-ence similar occurrexperi-ences, while in September they start de-creasing again. There are many events whenBTs are lower than the 185 K. Considering very accurate calibration of the thermal channels (Devasthale and Grassl, 2009), these events contain some realistic information on the cases where deep penetration into stratosphere occurs, and are not the result of coarse calibration of the thermal channels at very low tem-peratures. To examine the distribution of events reaching and penetrating the TTL even more closely, a zoom-in of the part of 2-D histogram shown in Fig. 5 is plotted separately
May
0 10N 20N 30N 40N 180
190
200
0 0.5 1
x 10−5
Jun
0 10N 20N 30N 40N 180
190
200
0 0.5 1
x 10−5
Brightness Temperature (K)
Jul
0 10N 20N 30N 40N 180
190
200
0 0.5 1
x 10−5
Aug
0 10N 20N 30N 40N 180
190
200
0 0.5 1
x 10−5
Sep
0 10N 20N 30N 40N 180
190
200
0 0.5 1
x 10−5
Fig. 10.2-D histogram (latitude vs. brightness temepratures (in k)) of cloud fraction showing intraseasonal migration of the penetrating
clouds. This is a zoom-in of Fig. 5. TheBTs on y-axis range from
200 K (bottom) to 180 K (top). The bin size is 0.1 degrees by 1 K.
Fig. 11.The location of four small chosen areas for analysis. The topography of the entire study area is shown in this figure. The digital elevation data (GTOPO30) is used for plotting. The elevation is in meters.
4192 A. Devasthale and H. Grassl: Climatological distribution of convective clouds over India
Fig. 12.The total amount of HOICs (i.e. Class I + Class II + Class III) for the areas A and B (right column) and their corrosponding topography (elevation in meters) is shown in left column. The cloud amount is in percent.
belt of 15◦N–25◦N (i.e. mainly over the northern Bay of Bengal and the north and northeastern India) during June, July, August and September months, while during the same period penetration is weaker in the 0–5◦N and 35◦N–40◦N bands. These results highlight the importance and the need to better characterize and quantify the penetrating convec-tion over the Indian monsoon region in order to fully assess its role in the stratosphere-troposphere exchange.
3.4 Finer scale features of orographic convection The topography plays a crucial role in structuring the mon-soon (Chakraborty et al., 2002; Barros et al., 2004). The great Himalayan mountains and the Tibetan Plaeau are the biggest barriers for advected moist air from the ocean. The Eastern Ghats and Western Ghats also act as barriers on ei-ther coast of the Indian Peninsula. The aim here is raei-ther to bring out the importance and the role of small mountains compared to the Himalayas. With the high resolution and long-term dataset, it is possible to closely look at the cli-matological distribution of HOICs along these mountains. These small scale features need to be resolved as
realisti-Fig. 13.Same is Fig. 12, but for areas C and D.
cally as possible in numerical models in order to achieve an accurate precipitation simulations at finer scales. Four ar-eas are selected (Fig. 11) and the total HOIC amount (Class I + Class II + Class III) for them is shown in Figs. 12 and 13. Area A is a part of the western coast of Indian Penin-sula along the Western Ghats, where most of the Class II and Class III clouds are predominantly seen. These clouds precipitate heavily along the Ghats. Previous studies show that Area B experiences intense precipitation echoes and very high lightning frequency (Houze Jr. et al., 2007). The con-cave part of the Afghan Plateau in Area B provides suitable conditions for moisture-laden air from ocean passing over the hot desert to rise. The Area C reveals very finer-scale pat-tern of convective cloudiness influenced by the topography. High cloud amount is seen over the mountains in Meghalaya (areas where the wettest place of the earth is located), the Naga Hills and Chin Hills. Also the northern Myanmar show high cloudiness due to concave topography similar to Area B. The area D shows the part of Eastern Ghats where the eastern branch of monsoon moves over this mountain chain and precipitate heavily. Thus, the Figs. 12 and 13 show how the finer-scale topography plays very important role in regu-lating the distribution of HOICs and precipitation.
3.5 Limitations
Fig. 14. Spatial pattern of the first three modes of EOFs for three classes of HOICs. The data are not detrended. June, July, August and September months of each year from 1982 to 2006 are used for the analysis.
afternoon (local time) and over ocean during the early morn-ing. Therefore, the maximum in the cloud fraction is missed (so is the minimum). This bias introduced due to time sam-pling is an inherent limitation of the data from polar orbiting satellites. However, it is to be noted that the main aim of the paper is to study the geographic distribution of HOICs and their spatial variability, and not to investigate long-term trends in absolute cloud amount. Another constraint comes from the fact that the NOAA polar orbiting afternoon satel-lites have drifted in orbit during their lifespan, thus resulting into delay in the observational time (Ignatov et al., 2004). The rate of drift is not same for every satellite. NOAA-7 has drifted only by one hour from 1982 till 1984, while NOAA-14 has drifted by about two hours from 1995 till 2000. Since convective clouds have a stronger diurnal cycle than other clouds, a noticeable spurious trend can be observed in the time series of absolute convective cloud amount (Devasthale and Grassl, 2007). The biases due to orbital drift of the NOAA satellites in the outgoing longwave radiation dataset have been reported previously and there have been few at-tempts to correct them (Waliser and Zhou, 1997; Lucas et al., 2001). In order to investigate whether up to three hours observational delay can influence the spatial distribution of HOICs, the empirical orthogonal functions (EOF) analysis
Fig. 15. Same as in Fig. 14, but for the case when the data are detrended to remove effect of orbital drift of satellites.
4194 A. Devasthale and H. Grassl: Climatological distribution of convective clouds over India a possibility that the interannual and intraseasonal variability
in monsoon is higher than the variability introduced by the drift of up to three hours. These factors may have contributed to the similar spatial patterns of variability in both cases for Class II and Class III clouds. Another approach to investigate the influence of orbital drift on spatial distribution of HOICs would be to prepare composites of cloud cover by selecting months with equal drift from each satellite and compare them with climatological distribution, but interannual variability in the monsoon (and even more so in the convective systems) is likely to be high and may raise other uncertainties while in-terpreting such comparisons.
4 Conclusions
A very high resolution climatological distribution of three high opaque ice cloud classes is presented using 25 years of AVHRR data over the Indian subcontinent during mon-soon months of May, June, July, August and September. The present study demonstrates the potential applications of this dataset in studying various aspects of monsoon over the In-dian region. It is seen that very deep and deep convective clouds dominate the Indian subcontinent during monsoon. The movement of the monsoon over continent is very well reflected in these cloud classes. One of important aspects of this study is that it reveals the distribution of HOIC classes during break and active monsoon conditions using long-term data. During break monsoon conditions the strong suppres-sion of convective activity is observed over the Arabian Sea and western coast of India. On the other hand, the presence of such convective activity is crucial for active monsoon con-ditions and thus for all-India rainfall. It is also seen that the significant fraction of convective clouds (3–5%) reach the tropical tropopause layer during monsoon over the study area. Clouds reaching the tropopause layer are mainly ob-served over the Bay of Bengal during June and over the north and northeast India during July and August. Many cases are observed when these clouds even penetrate the tropopause layer and reach the lower stratosphere. Such cases mostly occur during June compared to other months. These cases will be investigated in future in the context of tropospere-stratosphere exchange. One of the main characteristics of Indian monsoon is intraseasonal variability of the rainfall. This dataset due to its longest record along with high spatio-temporal resolution could be very useful to analyse intrasea-sonal oscillations in the three classes of HOICs. Furthermore this dataset is quite useful in characterizing the HOICs dur-ing El Nino years, contrastdur-ing monsoon months and also in investigating intraseasonal oscillations in cloud classes dur-ing such cases. Since the orbital drift of satellites can in-troduce spurious trend in cloud amount, the trends in these cloud classes should be treated very cautiously. Radar and/or microwave measurements (e.g. Alcala and Dessler, 2002; Liu and Zipser, 2005; Houze Jr. et al., 2007; Liu et al., 2007;
Hong et al., 2008) certainly add a new dimension to the re-mote sensing of convective systems, however the emphasis should be on the synthesis of measurements made at differ-ent spectral ranges and the synergistic use of them to ex-ploit their strengths in improving our understanding of cloud-precipitation interactions.
Acknowledgements. AD is very thankful to Jerry Sullivan (NOAA, USA) for discussions on the thermal channel calibration and to K. Ramesh Kumar (NIO, India) for providing data on active and break days of monsoon. The availability of AVHRR GAC data from NOAA CLASS is gratefully acknowledged. This work was partly supported by the EU project QUANTIFY.
Edited by: R. MacKenzie
References
Alcala, C. M. and Dessler, A. E.: Observations of deep convec-tion in the tropics using the Tropical Rainfall Measuring Mission (TRMM) precipitation radar, J. Geophys. Res., 107(D24), 4792, doi:10.1029/2002JD002457, 2002.
Barros, A. P., Kim, G., Williams, E., and Nesbitt, S. W.: Probing orographic controls in the Himalayas during the monsoon using satellite imagery, Nat. Hazards Earth Syst. Sci., 4, 29–51, 2004, http://www.nat-hazards-earth-syst-sci.net/4/29/2004/.
Bhat, G. S, Gadgil, S., Harish Kumar, P. V., Kalsi, S. R., Mad-husoodanan, V. S. Murty, N., Prasada Rao, C. V. K., Ramesh Babu, V., Rao, L. V. G., Rao, R. R., Ravichandran, M., Reddy, K. G., Sanjeeva Rao, P., Sengupta, D., Sikka, D. R., Swain, J., and Vinayachandran, P. N.: BOBMEX – the Bay of Bengal Mon-soon Experiment, B. Am. Meteor. Soc., 82, 2217–2243, 2001. Chakraborty, A., Nanjundiah, R. S., and Srinivasan, J.: Role of
Asian and African Orography in Indian Summer Monsoon, Geo-phys. Res. Lett., 29, 1989, doi:10.1029/2002GL015522, 2002. Chao, W. C. and Chen, B.: The origin of monsoons, J. Atmos. Sci.,
58, 3497–3507, 2001.
Danielsen, P.: A dehydration mechanism for the stratosphere, Geo-phy. Res. Lett., 9(6), 605–608, 1982.
Dessler, A. E.: The effect of deep, tropical convection on the tropical tropopause layer, J. Geophys. Res., 107, D3, 4033, doi:10.1029/2001JD000511, 2002.
Dessler, A. E., Palm, S. P., and Spinhirne, J. D.:
Tropi-cal cloud-top height distributions revealed by the Ice, Cloud, and Land Elevation Satellite (ICESat)/Geoscience Laser Al-timeter System (GLAS), J. Geophys. Res., 111, D12215, doi:10.1029/2005JD006705, 2006.
Devasthale, A. and Grassl, H.: Calibration and inter-calibration of the solar channels of AVHRRs onboard NOAA-7, -9, -11, -14 and 16 satellites, and thermal channel stability analysis, Techni-cal Report prepared by University of Hamburg (in the framework of EU Project QUANTIFY), 2006.
Devasthale, A. and Grassl, H.: Dependence of frequency of con-vective cloud occurrence on the orbital drift of satellites, Int. J. Remote Sens., 28(16), doi:10.1080/01431160701294646, 2007. Devasthale, A., and Grassl, H.: Comparison of low brightness
Fischer, H., de Reus, M., Traub, M., Williams, J., Lelieveld, J., de Gouw, J., Warneke, C., Schlager, H., Minikin, A., Scheele, R., and Siegmund, P.: Deep convective injection of boundary layer air into the lowermost stratosphere at midlatitudes, Atmos. Chem. Phys., 3, 739–745, 2003,
http://www.atmos-chem-phys.net/3/739/2003/.
Fu, R., Hu, Y., Wright, J. S., Jiang, J. S., Dickinson, R. E., Chen, M., Filipiak, M., Read, W. G., Waters, J. W., and Wu, D. L.: Short circuit of water vapor and polluted air to the global stratosphere by convective transport over the Tibetan Plateau, P. Natl. A. Sci., 103(15), 5664–5669, 2006.
Fueglistaler, S., Dessler, A. E., Dunkerton, T. J., Folkins, I., Fu, Q., and Mote, P. W.: Tropical tropopause layer, Rev. Geophys., 47, RG1004, doi:10.1029/2008RG000267, 2009.
Gadgil, S.: The Indian Monsoon and its variability, Annu. Rev. Earth Planet. Sci., 31, 429–467, 2003.
Gettelman, A., Salby, M. L., and Sassi, F.: Distribution and influ-ence of convection in the tropical tropopause region, J. Geophys. Res., 107, D10, doi:10.1029/2001JD001048, 2002.
Goodrum, G., Kidwell, K. B., and Winston, W.: NOAA KLM Users Guide (with NOAA-N, -N’ supplement, September 2000 Revi-sion), available online at http://www2.ncdc.noaa.gov/docs/klm/ (last accessed on 5 July 2008), 2000.
Goswami, B. N.: Dynamical predictability of seasonal monsoon rainfall: problems and prospects, Proceedings of the Indian Na-tional Science Academy, Part-A 60(1), 101–120, 1994. Goswami, B. N. and Ajaya Mohan, R. S.: Intraseasonal
oscilla-tions and interannual variability of the Indian summer monsoon, J. Climate, 14, 1180–1198, 2001.
Highwood, E. J. and Hoskins, B. J.: The tropical tropopause, Q. J. Roy. Meteor. Soc., 124, 1579–1604, 1998.
Hong, G., Heygster, G., Notholt, J., and Buehler, S. A.: Interan-nual to diurnal variations in tropical and subtropical deep con-vective clouds and concon-vective overshooting from seven years of AMSU-B measurements, J. Climate, 21(17), 4168–4189, doi:10.1175/2008JCLI1911.1, 2008.
Horvath, A. and Soden, B. J.: Lagrangian diagnostics of tropical deep convection and its effect upon upper tropospheric humidity, J. Climate, 21, 1013–1028, 2008.
Houze, Jr. R. A., Wilton, D. C., and Smull, B. F.: Monsoon convec-tion in the Himalayan region as seen by the TRMM precipitaconvec-tion radar, Q. J. Roy. Meteor. Soc., 133, 1389–1411, 2007.
Ignatov, A., Laszlo, I., Harrod, E. D., Kidwell, K. B., and Goodrum, G. P.: Equator crossing times for NOAA, ERS and EOS sun-synchronous satellites, Int. J. Remote Sens., 25, 5255–5266, 2004.
Jain, A. R., Das, S. S., Mandal, T. K., and Mitra, A. P.: Observations of extremely low tropopause temperature over the Indian tropical region during monsoon and postmonsoon months: Possible implications, J. Geophy. Res., 111, D07106, doi:10.1029/2005JD005850, 2006.
James, R., Bonazzola, M., Legras, B., Surbled, K., and Fueglistaler,
S.: Water vapor transport and dehydration above the
con-vective outflow during Asian monsoon, Geophys. Res. Lett., doi:10.1029/2008GL035441, 2008.
Jensen, E. J., Ackerman, A. S., and Smith, J. A.: Can overshooting convection dehydrate the tropical tropopause layer?, J. Geophys. Res., 112, D11209, doi:10.1029/2006JD007943, 2007.
Jiang, J. H., Wang, B., Goya, K., Hocke, K., Eckermann, S. D.,
Ma, J., Wu, D. L., and Read, W. G.: Geographical distribution and interseasonal variability of tropical deep convection: UARS MLS observations and analyses, J. Geophys. Res., 109, D03111, doi:10.1029/2003JD003756, 2004.
Kidwell, K. B.: NOAA Polar Orbiter Data Users Guide, available online at http://www2.ncdc.noaa.gov/docs/podug/ (last accessed on 5 July 2008), 1998.
Lelieveld, J., Bruehl, C., Joeckel, P., Steil, P., Crutzen, P. J., Fischer, H., Giorgetta, M. A., Hoor, P., Lawrence, M. G., Sausen R., and Tost, H.: Stratospheric dryness: model simulations and satellite observations, Atmos. Chem. Phys., 7, 1313–1332, 2007, http://www.atmos-chem-phys.net/7/1313/2007/.
Liu, C. and Zipser, E. J.: Global distribution of convection pene-trating the tropical tropopause, J. Geophys. Res., 110, D23104, doi:10.1029/2005JD006063, 2005.
Liu, C., Zipser, E. J., and Nesbitt, S. W.: Global distribution of tropical deep convection: Different perspectives from TRMM in-frared and radar data, J. Climate, 20, 489–503, 2007.
Lucas, L. E., Waliser, D. E., Xie, P., Janowiak, J. E., and Liebman, B.: Estimating the satellite equatorial crossing time biases in the daily, global outgoing longwave radiation dataset, J. Climate, 14, 2583–2605, 2001.
Pavolonis, M. J., Heidinger, A. K., and Uttal, T.: Daytime global cloud typing from AVHRR and VIIRS: Algorithm description, validation, and comparisons, J. Appl. Meteorol., 44, 804–826, 2005.
Ramesh Kumar, M. R. and Uma R. Prabhu Dessai: A new
criterion for identifying breaks in monsoon conditions over the Indian subcontinent, Geophys. Res. Lett., 31, L18201, doi:10.1029/2004GL020562, 2004.
Rao, C. R. N., and Chen, J.: Inter-satellite calibration linkages for the visible and near infrared channels of the Advanced Very High Resolution Radiometer on the NOAA-7, -9, and -11 spacecraft, Int. J. Remote Sens., 16, 1931–1942, 1995.
Roca, R. and Ramanathan, V,: Scale dependence of monsoonal con-vective systems over the Indian Ocean, J. Climate, 13, 1286, 2000.
Rossow, W. B. and Pearl, C.: 22-year survey of tropical convection penetrating into the lower stratosphere, Geophys. Res. Lett., 34, L04803, doi:10.1029/2006GL028635, 2007.
Sherwood, S. C. and Dessler, A. E.: On the control of stratospheric humidity, Geophys. Res. Lett., 27(16), 2513–2516, 2000. Sherwood, S. C. and Dessler, A. E.: Convective mixing near the
tropical tropopause: Insights from seasonal variations, J. Atmos. Sci., 60, 2674–2685, 2003.
Sikka, D. R. and Gadgil, S.: On the maximum cloud zone and the ITCZ over Indian longitudes during the southwest monsoon, Mon. Weather Rev., 108, 1840–1853, 1980.
Srinivasan, J. and Joshi, P. C.: What have we learned about the Indian monsoon from satellite data?, Curr. Sci., 93(2), 165–172, 2007.
Stowe, L. L., Davis, P. A., and McClain, E. P.: Scientific basis and initial evaluation of the CLAVR-1 global clear/cloud classifica-tion algorithm for the advanced very high resoluclassifica-tion radiometer, J. Atmos. Ocean. Tech., 16, 656–681, 1999.
4196 A. Devasthale and H. Grassl: Climatological distribution of convective clouds over India
Stubenrauch, C. J., Chedin, A., Radel, G., Scott, N. A., and Serrar, S.: Cloud properties and their seasonal and diurnal variability from TOVS path-B, J. Climate, 19, 5531–5553, 2006.
Sullivan, J.: A new radiance based method for AVHRR thermal channel nonlinearity corrections, Int. J. Remote Sens., 20, 3493– 3501, 1999.
Tang, X. and Chen, B.: Cloud types associated with the Asian summer monsoons as determined from MODIS/TERRA mea-surements and a comparison with surface observations, Geophys. Res. Lett., 33, doi:1029/2006GL026004, 2006.
Waliser, D. E. and Zhou, W.: Removing satellite equatorial cross-ing time biases from the OLR and HRC datasets, J. Climate, 10, 2125–2146, 1997.
Webster, P. J., Magana, V. O., Palmer, T. N., Shukla, J., Tomas, R. T., Yanai, M., and Yasunari, T.: Monsoons: Processes, predictability, and prospects for prediction, J. Geophys. Res., 103(C7), 14451–14510, 1998.
Wylie, D. P. and Menzel, W. P.: Eight years of high cloud statistics using HIRS, J. Climate, 12, 170–184, 1999.