AMTD
8, 623–687, 2015Aircraft measurements of BrO, IO, and glyoxal profiles in the tropics
R. Volkamer et al.
Title Page
Abstract Introduction
Conclusions References
Tables Figures
◭ ◮
◭ ◮
Back Close
Full Screen / Esc
Printer-friendly Version
Interactive Discussion
Discussion
P
a
per
|
Discussion
P
a
per
|
Discussion
P
a
per
|
Discussion
P
a
per
|
Atmos. Meas. Tech. Discuss., 8, 623–687, 2015 www.atmos-meas-tech-discuss.net/8/623/2015/ doi:10.5194/amtd-8-623-2015
© Author(s) 2015. CC Attribution 3.0 License.
This discussion paper is/has been under review for the journal Atmospheric Measurement Techniques (AMT). Please refer to the corresponding final paper in AMT if available.
Aircraft measurements of bromine
monoxide, iodine monoxide, and glyoxal
profiles in the tropics: comparison with
ship-based and in situ measurements
R. Volkamer1,2, S. Baidar1,2, T. L. Campos3, S. Coburn1,2, J. P. DiGangi4,*, B. Dix1, T. K. Koenig1,2, I. Ortega1,2, B. R. Pierce5, M. Reeves6, R. Sinreich1, S. Wang1,2,**, M. A. Zondlo4, and P. A. Romashkin6
1
Department of Chemistry & Biochemistry, University of Colorado, Boulder, CO, USA
2
Cooperative Institute for Research in Environmental Sciences (CIRES), University of Colorado, Boulder, CO, USA
3
National Center for Atmospheric Research (NCAR), Atmospheric Chemistry Division (ACD), Boulder, CO, USA
4
Department of Civil and Environmental Engineering, Princeton University, Princeton, NJ, USA
5
National Oceanic and Atmospheric Administration (NOAA), The National Environmental Satellite, Data, and Information Service (NESDIS), Madison, WI, USA
6
AMTD
8, 623–687, 2015Aircraft measurements of BrO, IO, and glyoxal profiles in the tropics
R. Volkamer et al.
Title Page
Abstract Introduction
Conclusions References
Tables Figures
◭ ◮
◭ ◮
Back Close
Full Screen / Esc
Printer-friendly Version
Interactive Discussion
Discussion
P
a
per
|
Discussion
P
a
per
|
Discussion
P
a
per
|
Discussion
P
a
per
|
*
now at: National Aeronautics and Space Administration (NASA) Langley Research Center, Hampton, VA, USA
**
now at: Department of Chemistry, Hong Kong University of Science and Technology, Hong Kong, China
Received: 18 December 2014 – Accepted: 5 January 2015 – Published: 19 January 2015
Correspondence to: R. Volkamer ([email protected])
AMTD
8, 623–687, 2015Aircraft measurements of BrO, IO, and glyoxal profiles in the tropics
R. Volkamer et al.
Title Page
Abstract Introduction
Conclusions References
Tables Figures
◭ ◮
◭ ◮
Back Close
Full Screen / Esc
Printer-friendly Version
Interactive Discussion
Discussion
P
a
per
|
Discussion
P
a
per
|
Discussion
P
a
per
|
Discussion
P
a
per
|
Abstract
Tropospheric chemistry of halogens and organic carbon over tropical oceans modifies ozone and atmospheric aerosols, yet atmospheric models remain largely untested for lack of vertically resolved measurements of bromine monoxide (BrO), iodine monoxide (IO), and small oxygenated hydrocarbons like glyoxal (CHOCHO) in the tropical
tropo-5
sphere. BrO, IO, glyoxal, nitrogen dioxide (NO2), water vapor (H2O) and O2-O2 colli-sion complexes (O4) were measured by the CU Airborne Multi AXis Differential Optical Absorption Spectroscopy (CU AMAX-DOAS) instrument, in situ aerosol size distribu-tions by an Ultra High Sensitivity Aerosol Spectrometer (UHSAS), and in situ H2O by Vertical-Cavity Surface-Emitting Laser hygrometer (VCSEL). Data are presented
10
from two research flights (RF12, RF17) aboard the NSF/NCAR GV aircraft over the tropical Eastern Pacific Ocean (tEPO) as part of the “Tropical Ocean tRoposphere Ex-change of Reactive halogens and Oxygenated hydrocarbons” (TORERO) project. We assess the accuracy of O4slant column density (SCD) measurements in the presence and absence of aerosols, and find O4-inferred aerosol extinction profiles at 477 nm
15
agree within 5 % with Mie calculations of extinction profiles constrained by UHSAS. CU AMAX-DOAS provides a flexible choice of geometry which we exploit to minimize the SCD in the reference spectrum (SCDREF, maximize signal-to-noise), and to test the robustness of BrO, IO, and glyoxal differential SCDs. The RF12 case study was conducted in pristine marine and free tropospheric air. The RF17 case study was
con-20
ducted above the NOAA RVKa’imimoana(TORERO cruise, KA-12-01), and provides independent validation data from ship-based in situ Cavity Enhanced- and MAX-DOAS. Inside the marine boundary layer (MBL) no BrO was detected (smaller than 0.5 pptv), and 0.2–0.55 pptv IO and 32–36 pptv glyoxal were observed. The near surface con-centrations agree within 20 % (IO) and 10 % (glyoxal) between ship and aircraft. The
25
AMTD
8, 623–687, 2015Aircraft measurements of BrO, IO, and glyoxal profiles in the tropics
R. Volkamer et al.
Title Page
Abstract Introduction
Conclusions References
Tables Figures
◭ ◮
◭ ◮
Back Close
Full Screen / Esc
Printer-friendly Version
Interactive Discussion
Discussion
P
a
per
|
Discussion
P
a
per
|
Discussion
P
a
per
|
Discussion
P
a
per
|
(NO2and BrO). Our profile retrievals have 12–20 degrees of freedom (DoF), and up to 500 m vertical resolution. The tropospheric BrO VCD was 1.5×10¹³molec cm−2(RF12), and at least 0.5×10¹³molec cm−2(RF17, 0–10 km, lower limit). Tropospheric IO VCDs correspond to 2.1×10¹²molec cm−2 (RF12) and 2.5×10¹²molec cm−2 (RF17), and glyoxal VCDs of 2.6×10¹⁴molec cm−2(RF12) and 2.7×10¹⁴molec cm−2(RF17).
Sur-5
prisingly, essentially all BrO, and the dominant IO and glyoxal VCD fraction was located above 2 km (IO: 58±5 %, 0.1–0.2 pptv; glyoxal: 52±5 %, 3–20 pptv). To our knowledge there are no previous vertically resolved measurements of BrO and glyoxal from aircraft in the tropical free troposphere.
1 Introduction
10
Tropospheric halogens, like bromine and iodine, destroy ozone, oxidize atmospheric mercury, and affect oxidative capacity (HOx=OH+HO2) (Parrella et al., 2012; Saiz-Lopez et al., 2012a). Glyoxal, the smallestα-dicarbonyl, is an indicator for hydrocarbon oxidation (Volkamer et al., 2005a) on global scales (Wittrock et al., 2006; Vrekoussis et al., 2009; Lerot et al., 2010) and precursor for the formation of secondary organic
15
aerosol (SOA) (Carlton et al., 2007; Fu et al., 2008; Kampf et al., 2013; Waxman et al., 2013; Knote et al., 2014; Kurtén et al., 2014). Atmospheric models currently remain largely untested for BrO, IO and glyoxal vertical distributions at tropical latitudes, largely due to the extreme scarcity of vertically resolved measurements. Such measurements are particularly important in the tropics, where about 75 % of the chemical removal of
20
the greenhouse gases methane (CH4) and ozone (O3) occurs (Lelieveld et al., 1998; Saiz-Lopez et al., 2012a), and where changes in O3 show a particular climate sensi-tivity (Mickley et al., 2004). Vertical profile measurements of BrO, IO and glyoxal in the tropical troposphere pose unique constraints to atmospheric models, and are further relevant for the interpretation of satellites data.
25
AMTD
8, 623–687, 2015Aircraft measurements of BrO, IO, and glyoxal profiles in the tropics
R. Volkamer et al.
Title Page
Abstract Introduction
Conclusions References
Tables Figures
◭ ◮
◭ ◮
Back Close
Full Screen / Esc
Printer-friendly Version
Interactive Discussion
Discussion
P
a
per
|
Discussion
P
a
per
|
Discussion
P
a
per
|
Discussion
P
a
per
|
sunlight spectra from aircraft. The AMAX-DOAS technique has been used to measure tropospheric NO2(Melamed et al., 2003; Heue et al., 2005; Wang et al., 2005; Bruns et al., 2006; Dix et al., 2009; Merlaud et al., 2011, 2012; Oetjen et al., 2013; Baidar et al., 2013a), sulfur dioxide (SO2) (Wang et al., 2006; Melamed et al., 2008; Heue et al., 2011), nitrous acid (Dix et al., 2009; Heue et al., 2014), BrO (Dix et al., 2009;
5
Heue et al., 2011; Prados-Roman et al., 2011), IO (Dix et al., 2013), formaldehyde (Dix et al., 2009; Baidar et al., 2013a; Heue et al., 2014), and glyoxal (Baidar et al., 2013a). However, no reports of BrO, IO and glyoxal currently exist by this technique at tropical latitudes. Furthermore, the AMAX-DOAS technique has not been extensively evaluated for gases other than NO2. Aerosol extinction profiles are pre-requisite to retrievals of
10
trace gas profiles, and can be inferred from observations of the oxygen collision com-plex, O2-O2 (O4) (Wagner et al., 2004) or radiance based retrievals (Prados-Roman et al., 2011). However, to our knowledge the evaluation of aerosol extinction profiles from AMAX-O4 limb-measurements by means of vertically resolved in situ measure-ments of aerosols has not been attempted before.
15
The CU AMAX-DOAS instrument is designed to maximize sensitivity and vertical resolution during limb observations from aircraft (Baidar et al., 2013a). The instrument has been compared with NO2vertical columns under polluted/semi-polluted conditions (Oetjen et al., 2013; Baidar et al., 2013a), and used to test NOxemission inventories in atmoshperic models (Baidar et al., 2013b). Further, the accuracy of O4measurements
20
has recently been assessed in a pure Rayleigh atmosphere (Spinei et al., 2014). How-ever, no previous evaluations have been performed using vertically resolved informa-tion. A series of research flights were conducted as part of the Tropical Ocean tRo-posphere Exchange of Reactive halogen species and Oxygenated VOC (TORERO) project (January/February 2012) using a comprehensive payload of chemical in situ
25
AMTD
8, 623–687, 2015Aircraft measurements of BrO, IO, and glyoxal profiles in the tropics
R. Volkamer et al.
Title Page
Abstract Introduction
Conclusions References
Tables Figures
◭ ◮
◭ ◮
Back Close
Full Screen / Esc
Printer-friendly Version
Interactive Discussion
Discussion
P
a
per
|
Discussion
P
a
per
|
Discussion
P
a
per
|
Discussion
P
a
per
|
from Hawai’i to Puntarenas, Costa Rica (KA-12-01 – TORERO cruise) (Coburn et al., 2014). The TORERO dataset provides an excellent opportunity to evaluate the robust-ness of DOAS retrievals, and compare with aerosol extinction profiles constrained from in situ measurements of aerosol size distributions, as well as in situ H2O profiles mea-sured on the NSF/NCAR GV. We also compare IO and glyoxal aircraft profiles with
5
a Ship MAX-DOAS instrument (Sinreich et al., 2010) aboard NOAA RVKa’imimoana, and near surface concentrations of glyoxal by the in situ Fast Light-Emitting-Diode Cavity-Enhanced DOAS (Fast LED-CE-DOAS) instrument (Coburn et al., 2014). Only selected case studies can be discussed here, but the methods for AMAX profile re-trievals are applicable for the evaluation of other TORERO flights (total of 17 research
10
flights). TORERO is a US contribution to the Surface Ocean Lower Atmosphere Study (SOLAS) project.
2 Experimental
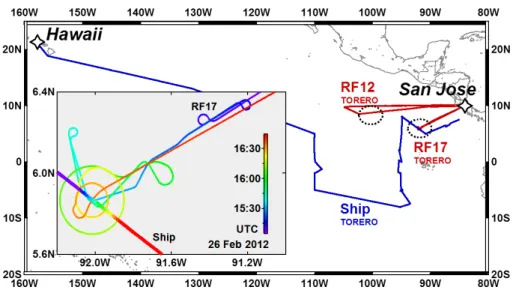
The TORERO cruise track of the RV Ka’imimoana, and flight tracks of TORERO re-search flights RF12 and RF17 are shown in Fig. 1. The objective of RF12 was to
15
measure BrO profiles in the upper tropical free troposphere (FT) under pristine condi-tions, and over the maximum accessible altitude range of the NSF/NCAR GV aircraft (0.1 to 14.5 km). RF17 was optimized to characterize the chemical and radiation state of the atmosphere above the ship. RF17 is used here to compare the data from in situ and remote sensing instruments in the lower atmosphere (up to 2 km). The GV aircraft
20
AMTD
8, 623–687, 2015Aircraft measurements of BrO, IO, and glyoxal profiles in the tropics
R. Volkamer et al.
Title Page
Abstract Introduction
Conclusions References
Tables Figures
◭ ◮
◭ ◮
Back Close
Full Screen / Esc
Printer-friendly Version
Interactive Discussion
Discussion
P
a
per
|
Discussion
P
a
per
|
Discussion
P
a
per
|
Discussion
P
a
per
|
2.1 CU AMAX-DOAS instrument
BrO, IO, glyoxal, NO2, H2O and O4 vertical profiles were measured by limb observa-tions, i.e. elevation angle (EA) 0, of scattered solar photons. The CU AMAX-DOAS instrument, its data analysis and profile retrieval methods have been described in de-tail elsewhere (Oetjen et al., 2013; Dix et al., 2013; Baidar et al., 2013a). Briefly, the
5
instrument measures scattered sunlight spectra from well-defined lines of sight (eleva-tion angles), which are defined above (positive EA), below (negative EA) and forward of the aircraft (zero EA=limb geometry). The limb scanning telescope has a vertical dispersion of 0.17◦ and is actively angle stabilized to better than 0.2◦ accuracy in real time. Two synchronized spectrograph-detector units (Acton SP2150/PIXIS400B CCD,
10
1340×400 pixels or 26.8×8 mm) simultaneously observed the spectral ranges from 330–470 nm (BrO, IO, glyoxal, NO2, H2O, and O4 at 360 nm; 0.7 nm full width half maximum (FWHM) optical resolution) and 440–700 nm (O4 at 477 nm; 1.2 nm FWHM optical resolution). During the profile case studies the aircraft was changing altitude at a rate of 457–914 m min−1 at constant heading between 0.1 and 14.5 km.
AMAX-15
DOAS was recording limb spectra with an integration time of 60 s for the BrO case study of RF12, and 30 s integration time was used for the ship comparison during RF17. Typical detection limits in the FT/MBL are: 0.3/0.6 pptv BrO, 0.04/0.1 pptv IO, 3/7 pptv glyoxal, 5/10 pptv NO2, and 50/120 ppmv H2O. 1 pptv=1 parts per trillion by volume≈2.46×10⁷molec cm−3(101 325 Pa, 298 K); 1 ppmv=103ppbv=106pptv.
20
2.2 Aerosol size distribution measurements aboard the GV and Mie calculations
Aerosol size distributions were measured in situ aboard the NSF/NCAR GV by an Ultra High Sensitivity Aerosol Spectrometer (UHSAS). We have calculated aerosol extinc-tion with a Mie Code that was constrained by these size distribuextinc-tions of accumulaextinc-tion mode sized particles (60 nm to 1.0 µm diameter), and used to estimate the aerosol
25
AMTD
8, 623–687, 2015Aircraft measurements of BrO, IO, and glyoxal profiles in the tropics
R. Volkamer et al.
Title Page
Abstract Introduction
Conclusions References
Tables Figures
◭ ◮
◭ ◮
Back Close
Full Screen / Esc
Printer-friendly Version
Interactive Discussion
Discussion
P
a
per
|
Discussion
P
a
per
|
Discussion
P
a
per
|
Discussion
P
a
per
|
all sizes, and wavelength dependencies as described in Massie and Hervig (2013). The average aerosol extinction values between 0–2 and 2–10 km were 0.144 and 0.027 km−1 (360 nm), 0.104 and 0.019 km−1 (477 nm) during RF12, and 0.159 and 0.014 km−1 (360 nm), 0.122 and 0.010 km−1 (477 nm) during RF17, respectively. The average aerosol size distribution over these altitude ranges had an effective radius,
5
Re=0.134±0.015 µm and 0.110±0.012 µm (RF12) and Re=0.148±0.022 µm and 0.126±0.014 µm (RF17).
2.3 Vertical-Cavity Surface-Emitting Laser hygrometer aboard the GV
In situ H2O was measured by the Vertical-Cavity Surface-Emitting Laser hygrometer, VCSEL, aboard the NSF/NCAR GV (Zondlo et al., 2010). The VCSEL hygrometer
em-10
ploys tunable diode laser absorption spectroscopy to determine the water vapor num-ber density over a dew-point range of−90 to+30◦C. It reports the water vapor number density and approximate dew-point at 25 samples per second. The hygrometer oper-ates in two absorption modes on two wavelengths: wavelength modulation on a weak absorption line (1853.3 nm, used for high mixing ratio conditions), direct absorption
15
on a strong line (1854.0 nm for moderately low mixing ratios), and wavelength modu-lation on the strong line (for low mixing ratios). The sample volume is an open-path Herriott cell, giving an absorption length of 375 cm in a volume approximately 20 cm long and 2 cm in diameter. The sensor was mounted on an adapter plate on top of the NSF/NCAR GV aircraft.
20
2.4 CU SMAX-DOAS instrument aboard RVKa’imimoana
The University of Colorado Ship MAX-DOAS (CU SMAX-DOAS) instrument consists of a telescope, spectrograph/detector units, and a laptop PC. The telescope collects scattered sunlight, and was mounted on the “experiment platform” in the back of the
Ka’imimoana. The telescope is comprised of a rotating quartz prism and a quartz lens
25
in-AMTD
8, 623–687, 2015Aircraft measurements of BrO, IO, and glyoxal profiles in the tropics
R. Volkamer et al.
Title Page
Abstract Introduction
Conclusions References
Tables Figures
◭ ◮
◭ ◮
Back Close
Full Screen / Esc
Printer-friendly Version
Interactive Discussion
Discussion
P
a
per
|
Discussion
P
a
per
|
Discussion
P
a
per
|
Discussion
P
a
per
|
clinometers are used to motion-control the telescope pointing, and keep EA constant during spectra acquisition. Spectra of scattered sunlight were acquired from the EA sequence+90,+0.25,+0.6,+1.5,+3.8,+10,+25,+90 portside and starboard of the ship. The instrument telescope was coupled to a Princeton Instruments Acton SP2300 Czerny–Turner imaging spectrometer with a PIXIS 400B CCD detector. The
spectrom-5
eter utilized a custom 500 g mm−1 grating blazed at 300 nm, and gives simultaneous coverage from 321.3–488.4 nm, with 0.74 nm FWHM resolution (Coburn et al., 2011). We use spectra recorded in the portside direction that was closer to the GV overpass for comparison with the AMAX-DOAS during RF17.
2.5 LED-CE-DOAS aboard RVKa’imimoana
10
The Fast Light Emitting Diode Cavity Enhanced DOAS (Fast LED-CE-DOAS) instru-ment is a multispectral sensor that selectively and simultaneously measures glyoxal, O4and other gases with 2 Hz time resolution (Coburn et al., 2014). It has a precision of 40 pptv Hz−0.5for glyoxal, which corresponds to a detection limit smaller than 2.5 pptv within one hour. The instrument is based on an earlier prototype (Thalman and
Volka-15
mer, 2010) in which a high-power blue LED (LedEngin model number LZ1-00B205; peak optical power 1.3 W, peak emission near 465 nm) is coupled into a confocal optical cavity equipped with custom coated mirrors (peak reflectivityR=0.999972, Advanced Thin Films). The cavity has a base length of 86 cm (74.45 cm sample path length) and was coupled to a Princeton Instruments Acton SP2156 Czerny–Turner imaging
spec-20
trometer with a PIXIS 400B CCD. The spectrometer utilized a custom 1000 g mm−1 grating blazed at 250 nm which covered the wavelength range of 390–530 nm with 0.75 nm FWHM resolution. For further details see Coburn et al. (2014).
2.6 DOAS analysis
The spectra from the AMAX and SMAX instruments were analysed using the DOAS
25
AMTD
8, 623–687, 2015Aircraft measurements of BrO, IO, and glyoxal profiles in the tropics
R. Volkamer et al.
Title Page
Abstract Introduction
Conclusions References
Tables Figures
◭ ◮
◭ ◮
Back Close
Full Screen / Esc
Printer-friendly Version
Interactive Discussion
Discussion
P
a
per
|
Discussion
P
a
per
|
Discussion
P
a
per
|
Discussion
P
a
per
|
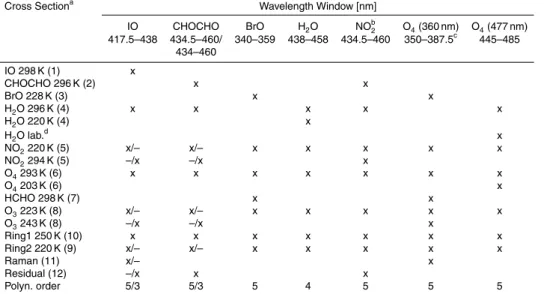
Roozendael, 2001). Trace gas absorption cross section spectra were adjusted for res-olution, and multiple gases are retrieved simultaneously using non-linear least-squares fitting routines in a finite wavelength window. The analysis settings and a list of simul-taneously fitted cross section reference spectra of atmospheric trace gases are listed in Table 1. Broad band extinction caused by Rayleigh- and Mie-scattering is accounted
5
for by a polynomial fitted simultaneously. For AMAX-DOAS a fixed reference spec-trum is used during analysis (see also below). For SMAX-DOAS a zenith specspec-trum serves as reference, which is updated for each angle scan sequence (see Table 2). The reference spectra eliminate Fraunhofer lines from the solar atmosphere, and cor-rect for stratospheric trace gases like NO2 and O3; the cross-sections of these two
10
gases wereI0 corrected. A linear intensity offset to correct for instrumental stray light and Ring spectra, modelled with the MFC software (Gomer et al., 1993) (AMAX, Ring 1, 2) or DOASIS software (Kraus, 2006) (SMAX, Ring1), as well as a Raman spectrum (Langford et al., 2007) for the AMAX IO were included to correct for inelastic scattering processes. Imperfections in the water cross-section spectra (HITEMP, Rothman et al.,
15
2010; HITRAN, Rothman et al., 2013) were explored in form of further sensitivity stud-ies that included/excluded a water residuum (Sect. 3.2.2, Supplement text). The output from the DOAS fit is the differential slant column density, dSCD, i.e., the concentration integral along the light path with respect to a reference spectrum. For information on the LED-CE-DOAS analysis refer to Coburn et al. (2014).
20
BrO dSCDs were evaluated using a 3 band analysis (Table 1), that is compared to the Aliwell settings (see Sect. 3.2.2). BrO is estimated conservatively in this study by using a “cold” (228 K) BrO cross section reference spectrum to evaluate our spectra for BrO. This cold spectrum is applied to BrO at warmer temperatures (typical of the lower FT) where the BrO cross section is lower (∼20 % between 298 and 228 K) (Wilmouth et al.,
25
AMTD
8, 623–687, 2015Aircraft measurements of BrO, IO, and glyoxal profiles in the tropics
R. Volkamer et al.
Title Page
Abstract Introduction
Conclusions References
Tables Figures
◭ ◮
◭ ◮
Back Close
Full Screen / Esc
Printer-friendly Version
Interactive Discussion
Discussion
P
a
per
|
Discussion
P
a
per
|
Discussion
P
a
per
|
Discussion
P
a
per
|
had used previously (Dix et al., 2013). The only difference is a slight change in the analysis window (Table 1) based on additional sensitivity studies (Supplement text).
Reference spectra and trace gas dSCDs
The CU AMAX-DOAS instrument provides a flexible choice of reference spectra. Sev-eral references were tested to investigate the sensitivity of the dSCD results with
re-5
spect to choice of reference and to optimize the resulting dSCDs (see Sect. 3.2.1). With the settings described in Table 1 we have derived BrO, IO, glyoxal, NO2, H2O and O4 dSCDs from limb-viewing spectra using reference spectra from EA−10, EA0 and EA+10 while the aircraft was near ceiling altitude, and from EA+90 and EA0 in the MBL (0.1 km altitude), as described in Table 2. For BrO we used an EA0 reference
10
spectrum recorded in the MBL for final analysis, because of the higher photon count in these spectra compared to the zenith and the lack of evidence for MBL-BrO in either the ship or aircraft data (see Sect. 4.4.1). Evaluations that used a MBL EA+90 resulted in slightly higher RMS, but identical BrO dSCDs within small error.
The final IO analysis used an EA0 spectrum recorded at 14.5 km as reference
spec-15
trum. This geometry has the lowest IO SCD in the reference spectrum (SCDREF), and reasonably high photon count such that the reference spectrum is not limiting the RMS (Coburn et al., 2011), when it is used for the analysis of limb-spectra. RF12 and RF17 IO dSCDs were evaluated using this same reference spectrum (Table 2). The IO dSCDs were found to be consistent for reference spectra from shallow angles recorded at
dif-20
ferent altitudes. The Supplement text further discusses SCDREFin the case of IO. Glyoxal dSCDs were derived using a reference spectrum in essentially glyoxal free air. During RF12 we used an EA0 reference spectrum recorded at 14.5 km for final analysis (no significant glyoxal above 10.5 km). During RF17 we used an EA+10 ref-erence spectrum at 10.9 km. At this altitude the sky is still sufficiently bright such that
25
AMTD
8, 623–687, 2015Aircraft measurements of BrO, IO, and glyoxal profiles in the tropics
R. Volkamer et al.
Title Page
Abstract Introduction
Conclusions References
Tables Figures
◭ ◮
◭ ◮
Back Close
Full Screen / Esc
Printer-friendly Version
Interactive Discussion
Discussion
P
a
per
|
Discussion
P
a
per
|
Discussion
P
a
per
|
Discussion
P
a
per
|
NO2dSCDs were derived using an EA+90 reference spectrum recorded in the MBL during both flights. For H2O and O4, a common EA+10 reference spectrum recorded near ceiling altitude were used for final dSCD analysis to minimize SCDREF (Table 2, and Sect. 2.7).
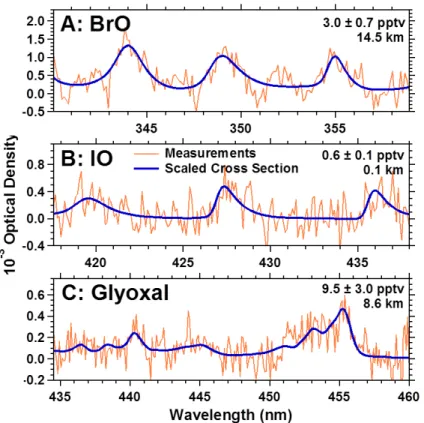
Figure 2 shows spectral proof for the detection of BrO, IO and glyoxal. The
5
spectra correspond to BrO, IO, and glyoxal dSCDs and RMS noise values as fol-lows. BrO: dSCD=14±1.8×10¹³molec cm−2, RMS=3.04×10⁻⁴. IO: dSCD=1.8± 0.3×10¹³molec cm−2, RMS=2.08×10⁻⁴. Glyoxal: dSCD=8.8±1.4×10¹⁴molec cm−2, RMS=1.91×10⁻⁴. The fit uncertainty is indicated by the dSCD error.
2.7 Profile retrieval from AMAX and SMAX-DOAS data
10
Concentration profiles of trace gases were retrieved using Optimal Estimation (Rodgers, 2000). We use the McArtim (Deutschmann et al., 2011) radiative transfer model (RTM) to interpret the MAX-DOAS measurements. McArtim is a fully spherical Monte Carlo RTM. The radiation fields were constrained by aircraft in situ pressure, temperature and water vapor measurements as well as by CU AMAX-DOAS
observa-15
tions of O4at 360 and 477 nm (aerosol extinction). The inference of aerosol extinction profiles from O4 exploits the fact that the O4 vertical profile scales with the square of the O2 concentration, and thus only depends on local pressure temperature and wa-ter vapor concentrations (Thalman and Volkamer, 2013; Spinei et al., 2014). We use the same aerosol extinction profiles for the inversion of AMAX- and SMAX-DOAS data
20
during RF17. As input to the inversion, we use tropospheric SCDs for AMAX data as calculated from Eq. (1).
SCD=dSCD+SCDREF (1)
For the AMAX-DOAS data the values of SCDREF were actively minimized. SCDREFis usually unknown for SMAX-DOAS retrievals, and – in absence of independent
mea-25
AMTD
8, 623–687, 2015Aircraft measurements of BrO, IO, and glyoxal profiles in the tropics
R. Volkamer et al.
Title Page
Abstract Introduction
Conclusions References
Tables Figures
◭ ◮
◭ ◮
Back Close
Full Screen / Esc
Printer-friendly Version
Interactive Discussion
Discussion
P
a
per
|
Discussion
P
a
per
|
Discussion
P
a
per
|
Discussion
P
a
per
|
et al., 2010; Irie et al., 2011; Wagner et al., 2011; Franco et al., 2014). Our retrievals are intended for the troposphere only, i.e. (1) stratospheric absorbers are corrected using nearby reference spectra (Table 2); the successful stratospheric correction is demon-strated (see Sects. 3.2.2 and 4.2). Furthermore, we use an equidistant tropospheric inversion grid that extends to 2–3 km above aircraft ceiling altitude (RF17: 0.5 km layer
5
thickness, 0–13.5 km altitude, RF12: 1 km, 0–16.5 km). A finer grid (0.2 km layer thick-ness) from 0–10 km is used for the inversion of the SMAX-DOAS data. The effect of uncertain SCDREF for SMAX-DOAS profiles is assessed in form of a sensitivity study in Sect. 3.4 “Sensitivity of MAX-DOAS profiles to SCDREF”.
The values of SCDREF during RF12 and RF17 were O4,360 nmSCDREF= 10
(0.83±0.25)×1043 and (1.50±0.25)×1043molec2cm−5; O4,477 nmSCDREF=(1.05± 0.20)×1043 and (1.28±0.20)×1043molec2cm−5; NO2SCDREF=0.42×10
15 and 0.92×10¹⁵molec cm−2; H2OSCDREF=0.81×10²³and 0.98×10²³molec cm−2; glyoxal SCDREF=0 (both flights); BrO=1×10¹³molec cm−2; IO=0.6×10¹²molec cm−2. For BrO, NO2 and H2O the values of SCDREF correspond to tropospheric SCDs for the
15
preferred reference geometry (Table 2). For IO SCDREF was estimated from sen-sitivity studies to assure accurate correction of the stratosphere (Supplement text). For glyoxal, no significant glyoxal was detected when comparing the EA+10 refer-ence from RF17 with the EA0 referrefer-ence from 14.5 km (RF12). SCDREF values for NO2, H2O and O4 were estimated using RAQMS NO2, in situ measurements of
20
temperature/pressure and VCSEL-H2O at aircraft altitude, and RAQMS profiles at higher altitudes. For comparison, typical dSCD fit errrors (∆dSCD) for EA0 spectra at 8 km are:∆dSCDO
4,360 =2.9×10 41
molec2cm−5;∆dSCDO
4,477=0.9×10 41
molec2cm−5;
∆dSCDNO2=0.13×10 15
molec cm−2;∆dSCDH2O=1.8×10 21
molec cm−2;∆dSCDBrO= 1.3×10¹³molec cm−2;∆dSCDIO=2.1×10
12
molec cm−2. For BrO, IO and glyoxal the
25
AMTD
8, 623–687, 2015Aircraft measurements of BrO, IO, and glyoxal profiles in the tropics
R. Volkamer et al.
Title Page
Abstract Introduction
Conclusions References
Tables Figures
◭ ◮
◭ ◮
Back Close
Full Screen / Esc
Printer-friendly Version
Interactive Discussion
Discussion
P
a
per
|
Discussion
P
a
per
|
Discussion
P
a
per
|
Discussion
P
a
per
|
Aerosols are represented in the RTM as described in Table 3. The aerosol extinc-tion profiles were obtained using the iterative forward model approach described in detail in Baidar et al. (2013a). Briefly, a set of measured O4 SCDs is related to the aerosol extinction vertical profile using a forward RTM calculation. The predicted O4 SCDs are then compared with the measured O4SCDs, and the aerosol extinction
pro-5
file is varied iteratively using an onion peeling from top to surface until the predicted and measured O4 SCDs agree (see Baidar et al., 2013a, for details). The O4 Box-Air Mass Factors (Box-AMF) closely resemble those shown in Fig. S1, i.e., the O4 mea-surement is almost entirely sensitive at meamea-surement altitude, and nearly all of the vertical information contained in the SCD comes from that particular altitude. Aerosol
10
extinction at other wavelengths was linearly interpolated between 360 and 477 nm to the wavelength used in the inversion (Table 3).
Box-AMFs are a measure of the instrument sensitivity, and characterize the ratio of the partial SCD to the partial VCD within one atmospheric layer (defined by the vertical grid resolution of the RTM). Box-AMFs are included for both AMAX-DOAS profile case
15
studies at the wavelengths used for the BrO (350 nm), IO (428 nm) and glyoxal (447 nm) profile retrievals in Fig. S1. The inversion errors are typically dominated by the mea-surement noise and are given by the retrieval noise covariance matrix. For a discussion on the error budget of the optimal estimation inversion, including the propagation of er-rors caused by smoothing, choice of a-priori and extinction erer-rors through the Optimal
20
Estimation retrieval, see Baidar et al. (2013a).
2.8 RAQMS model
Chemical and meteorological forecasts from theReal-time Air Quality Modeling Sys-tem (RAQMS)(Pierce et al., 2007) in conjunction with Reverse Domain Filling (RDF) techniques (Sutton et al., 1994) are used to provide information on air mass histories
25
AMTD
8, 623–687, 2015Aircraft measurements of BrO, IO, and glyoxal profiles in the tropics
R. Volkamer et al.
Title Page
Abstract Introduction
Conclusions References
Tables Figures
◭ ◮
◭ ◮
Back Close
Full Screen / Esc
Printer-friendly Version
Interactive Discussion
Discussion
P
a
per
|
Discussion
P
a
per
|
Discussion
P
a
per
|
Discussion
P
a
per
|
approximately 60 km. Meteorological forecasts are initialized with operational analyses from the National Centers for Environmental Prediction (NCEP) Global Data Assim-ilation System (GDAS). 6 h chemical and meteorological forecasts provide chemical and meteorological input for the RDF calculations. The RAQMS RDF calculations are based on analysis of back trajectories initialized along the aircraft flight track.
Three-5
dimensional 7 day back trajectory calculations were conducted using the Langley Tra-jectory Model (LTM) (Pierce and Fairlie, 1993), and initialized at model hybrid levels every 5 min along the TORERO flight tracks.
2.9 Atmospheric state during the RF12 and RF17 case studies
RF12 was conducted on 14 February 2012, and RF17 took place on 26 February 2012.
10
Both flights were from/to San Jose, Costa Rica and headed West over the Northern Hemisphere tEPO to probe mostly cloud free air. Times and locations of the two pro-file case studies are given in Table 2. Both propro-files probed pristine marine air below 2 km, and did not show signs of land influences inside the MBL, as indicated by chem-ical tracer measurements of hydrocarbons by the Trace Organic Gas Analyzer (TOGA)
15
(Apel et al., 2003, 2010) on the aircraft (not shown), and back-trajectory calculations by the RAQMS model. The MBL-CO below 2 km was 80–98 ppbv (RF12) and 96– 109 ppbv (RF17). Above 8 km measurements of CO ranged between 40–60 ppbv, and NO2near 10 pptv indicating mostly aged FT air. Some minor pollution influences were observed between 2 and 8 km (∼25 pptv NO2, both flights). Analysis of 7 day back
tra-20
jectories and tracer measurements on board consistently showed that the air above ∼10 km (RF12) and above 8 km (RF17) had spent more than 85 % of the time in the upper FT. RF12 trajectories further showed influences from tropical deep convection up to 11 km, which were generally more prominent in the lower and mid FT. During RF17 deep convection influences were more recent, and stronger below 5–6 km, and
25
AMTD
8, 623–687, 2015Aircraft measurements of BrO, IO, and glyoxal profiles in the tropics
R. Volkamer et al.
Title Page
Abstract Introduction
Conclusions References
Tables Figures
◭ ◮
◭ ◮
Back Close
Full Screen / Esc
Printer-friendly Version
Interactive Discussion
Discussion
P
a
per
|
Discussion
P
a
per
|
Discussion
P
a
per
|
Discussion
P
a
per
|
(MTP) measurements (Denning et al., 1989; Lim et al., 2013) aboard the aircraft (not shown).
3 Results
3.1 Aerosols and clouds
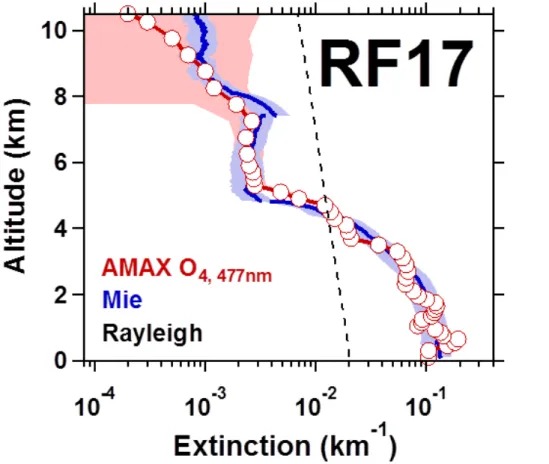
The aerosol extinction profile shown in Fig. 3 was derived using O4data from the EA0
5
measured at 477 nm during the RF17 ascent above the ship. To get a sense of the er-ror in AMAX extinction profiles, two additional extinction profiles were retrieved for each set of measured O4SCDs: one profile matched the positive error bars of the measured O4SCDs and another matched the negative error bars. The O4error bars are defined as the sum of the SCDREFuncertainty and the DOAS fit error. The SCDREFwas
deter-10
mined explicitly through RTM calculations (Sect. 2.7), and the uncertainty in SCDREF was estimated from trying to match a complete measured angle scan (EA0,+1,+2,
+3, +5, +10) in a near pure Rayleigh atmosphere. We estimate an SCDREF uncer-tainty of 2.5×1042molec2cm−5, and 2.0×1042molec2cm−5at 360 and 477 nm. These error bars are about 10–20 times higher than the O4fit error (Sect. 2.7), and estimated
15
conservatively. The comparison with Mie calculations in Fig. 3 show that particularly at 477 nm these numbers can be taken as upper limits. The resulting extinction error bars are shown as red background to the AMAX extinction in Fig. 3.
The O4,477 inferred aerosol extinction, ε477, is compared with Mie calculations of UHSAS size distributions in Fig. 3. The solid line corresponds to the average value
20
of extinction, and the light blue shading indicates the variability for different values ofn (see Sect. 2.2). A correlation plot of ε477 has R
2
of 0.90, and gives the follow-ing equation:ε477,DOAS=(−0.76±4)×10
−3
km−1+(1.01±0.05)×ε477,Mie; and under these conditions the measured and predicted O4 SCDs agree within 1 % (Fig. 4). To our knowledge the only assessment of the accuracy of O4 SCDs in the presence of
25
AMTD
8, 623–687, 2015Aircraft measurements of BrO, IO, and glyoxal profiles in the tropics
R. Volkamer et al.
Title Page
Abstract Introduction
Conclusions References
Tables Figures
◭ ◮
◭ ◮
Back Close
Full Screen / Esc
Printer-friendly Version
Interactive Discussion
Discussion
P
a
per
|
Discussion
P
a
per
|
Discussion
P
a
per
|
Discussion
P
a
per
|
laboratory (see their Fig. 8). These results extend upon previous assessments that O4 measurements by CU AMAX-DOAS agree with direct-sun DS DOAS, and RTM predictions in a Rayleigh atmosphere (agreement better 5 %) (Spinei et al., 2014; Thalman et al., 2014), and suggest that the O4 dSCDs can be regarded as accurate also in the presence of aerosols. The measured and predicted O4 SCDs are
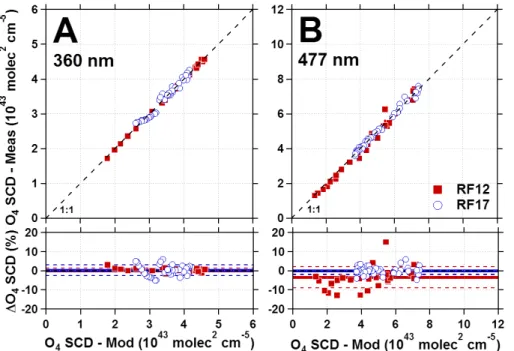
com-5
pared for RF12 and RF17 in Fig. 4. For both case studies the agreement is excellent (R2>0.96), with slopes of unity within error, and insignificant intercepts at both wave-lengths (<1.4×1042molec2cm−5at 360 nm, and<2.8×1042molec2cm−5at 477 nm). The average deviations ([O4,meas−O4,RTM]/O4,RTM) in the lower panels were typically ∼1 %. There is no obvious trend in the deviations.
10
In particular, the lack of a significant offset in Fig. 4 indicates the absence of ob-vious limitations from cloud effects, and reasonable knowledge of SCDREF. We have investigated the effect of clouds for RF17, where scattered clouds were visible from the aircraft to the South of the ship. A simulated cloud with optical depth 15 between 0.4– 1.1 km increased the predicted O4SCD at EA0 at 2 km by+3×10
42
molec2cm−5, and
15
by+10×1042molec2cm−5at 10 km (both wavelengths). For comparison, this is up to 13 times larger than the intercepts in Fig. 4 (RF17, 360 nm: 1.4±1.0×1042molec2cm−5; 477 nm: −0.02±0.79×1042molec2cm−5), and 4 times larger than the uncertainty in SCDREF. We can thus rule out significant cloud influences on RTM during our RF17 case study; RF12 was conducted in mostly cloud free air.
20
The O4inferred extinction profiles integrated over altitude correspond to aerosol op-tical depth (AOD) at 477 and 360 nm of 0.37±0.04 (Mie477: 0.41) and 0.53±0.26 (Mie360: 0.52) for RF17, and 0.32±0.07 (Mie477: 0.35) and 0.31±0.22 (Mie360: 0.49) for RF12. Reasonable error bars are only obtained using the O4 band at 477 nm. At 360 nm aerosol extinction measurements are less precise, and aerosol extinction is
25
AMTD
8, 623–687, 2015Aircraft measurements of BrO, IO, and glyoxal profiles in the tropics
R. Volkamer et al.
Title Page
Abstract Introduction
Conclusions References
Tables Figures
◭ ◮
◭ ◮
Back Close
Full Screen / Esc
Printer-friendly Version
Interactive Discussion
Discussion
P
a
per
|
Discussion
P
a
per
|
Discussion
P
a
per
|
Discussion
P
a
per
|
band, because of the larger O4 cross-section at 477 nm, larger O4 dSCDs (i.e., 3.1 times longer photon paths in Rayleigh conditions), more abundant photons (and thus smaller dSCD fit error); also if clouds are present the effect on O4is expected to be rel-atively smaller due to the larger O4dSCD at 477 nm. The minimum aerosol extinction was observed during RF12 at 10 km (∼2.8×10⁻⁴km−1, factor of 25 sub-Rayleigh), and
5
such small extinction was still measured as non-zero by the extinction retrieved from O4at 477 nm.
3.2 Uncertainties and sensitivity studies of dSCDs
The CU AMAX-DOAS instrument provides flexible choice of geometry to record refer-ence spectra. This flexibility is used here to assess the robustness of trace-gas dSCDs
10
by comparing results from reference spectra of different geometries. The final reference spectrum is optimized to minimize SCDREF thereby maximizing sensitivity (Sect. 2.7), and accurately cancel out stratospheric contributions of NO2and BrO. Details about all reference spectra tested are included in Table 2. In the following we focus on robust-ness of dSCDs for weak absorbers like BrO, IO and glyoxal – measurements of the
15
stronger absorbers NO2, H2O and O4follow the same rationale (Tables 1 and 2), and are more routine (see e.g. Baidar et al., 2013a).
3.2.1 References
BrO
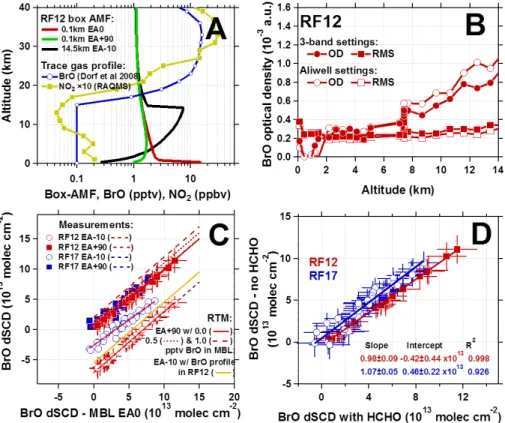
Fig. 5a shows the Box-AMFs for three reference geometries that we have tested for
20
BrO: MBL EA+90, MBL EA0, and EA−10 from ceiling altitude. The limb–zenith com-parison is most sensitive for detecting any BrO in the MBL; all three references as-sure proper stratospheric correction for BrO (see Sects. 3.2.2, 4.2 and Fig. 5a), and MBL references have lower SCDREF. EA−10 at altitude is chosen to test for the in-trinsic offset consistency between BrO dSCDs. A zenith spectrum at altitude – while
AMTD
8, 623–687, 2015Aircraft measurements of BrO, IO, and glyoxal profiles in the tropics
R. Volkamer et al.
Title Page
Abstract Introduction
Conclusions References
Tables Figures
◭ ◮
◭ ◮
Back Close
Full Screen / Esc
Printer-friendly Version
Interactive Discussion
Discussion
P
a
per
|
Discussion
P
a
per
|
Discussion
P
a
per
|
Discussion
P
a
per
|
desirable – is not practical, because the low photon count does not facilitate suffi -ciently good signal to noise for BrO analysis. Figure 5c compares the retrieved BrO dSCDs. For RF12 we find slopes of unity, and very strong correlations (R2≥0.99). The offset between BrO dSCDs was compared with that expected based on RTM for-ward calculations that represented our retrieved BrO inversion profiles. E.g. for RF12,
5
we find that the offsets for correlations of dSCDs of MBL EA0 and EA−10 at al-titude (−7.2±0.5×10¹³molec cm−2) and MBL EA+90 (0.1±0.6×10¹³molec cm−2) are consistent with that expected from our profiles (−5.6±1.2×10¹³molec cm−2 and 0.3±0.1×10¹³molec cm−2). A similar agreement is also observed for RF17. The limb spectra provide a particularly stable analysis, facilitate RMS that closely resembles
10
photon shot noise, and does not depend on altitude (see Fig. 5b); using the zenith spectra gives generally consistent results, but introduces some scatter (variations of ∼2×10¹³molec cm−2BrO dSCD) that is seen neither when using the limb reference, nor when using the EA−10 reference.
Glyoxal
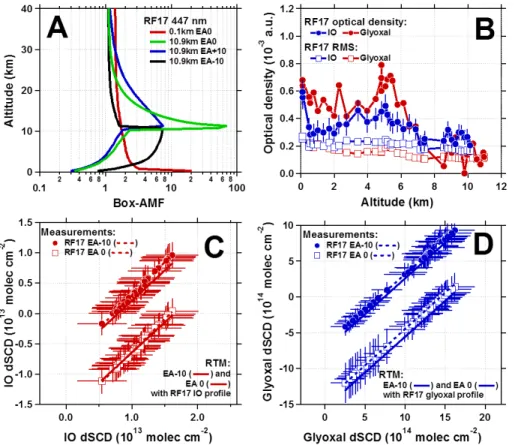
15
The Box-AMFs for four reference geometries are shown in Fig. 6a, and correspond to geometry MBL EA0, and EA−10, EA+10, and EA0 (all at 10.9 km). EA+10 is chosen to minimize SCDREF during RF17 (EA0 at altitude can also be used if taken in gly-oxal free air, like RF12, Table 2). SCDREFis minimized during both case studies, which maximizes the signal-to-noise for glyoxal detection in limb-spectra at any other altitude
20
(Fig. 6b). All references assure proper stratospheric correction (no glyoxal expected based on our data), but here we go one step further. The different Box-AMFs test the ro-bustness of glyoxal dSCDs with respect to the presence or absence of NO2(e.g., com-paring EA−10 and EA+10 at altitude), and provide a consistency check of our profiles (e.g., comparing MBL EA0 with EA+10 at altitude). Figure 6d compares these glyoxal
25
AMTD
8, 623–687, 2015Aircraft measurements of BrO, IO, and glyoxal profiles in the tropics
R. Volkamer et al.
Title Page
Abstract Introduction
Conclusions References
Tables Figures
◭ ◮
◭ ◮
Back Close
Full Screen / Esc
Printer-friendly Version
Interactive Discussion
Discussion
P
a
per
|
Discussion
P
a
per
|
Discussion
P
a
per
|
Discussion
P
a
per
|
and EA0 (−1.46±0.05×10¹⁵molec cm−2) are consistent with that expected from our profiles (−7±3×10¹⁴molec cm−2and 1.3±0.4×10¹⁵molec cm−2). Similar agreement is also observed for RF12. The EA+10 at altitude provides a stable analysis, facilitates RMS that closely resembles photon shot noise, and does not depend on altitude (see Fig. 6b).
5
IO
The offsets for IO dSCDs are compared for RF17 in Fig. 6c. The RF12 EA0 ref-erence at ceiling altitude was used to derive dSCDs plotted on the xaxis (see Sect. 2.6 “Reference spectra and trace gas dSCDs”, Table 2). The slopes differ by less than 10 % from unity, and correlations are very strong (R2≥0.94). The offset for
10
RF17 reference EA−10 at altitude (−7.9±0.2×10¹²molec cm−2) and RF17 MBL EA0 (−17.2±0.02×10¹²molec cm−2) are in very close agreement with that expected from our profiles (−8±4×10¹²molec cm−2 and −16±5×10¹²molec cm−2). Similar agree-ment is also observed for RF12. Notably, the effect of vibrational Raman scattering in the IO wavelength range is small (Coburn et al., 2011), and can be ruled as a potential
15
source of bias for our IO dSCDs. Our reference (Table 2) provides a stable analysis, facilitates RMS that closely resembles photon shot noise, and does not depend on alti-tude (see Fig. 6b). Furthermore, when the IO dSCDs derived from EA+10 and EA0 at ceiling altitude were compared, there was no significant difference.
3.2.2 Further sensitivity studies
20
BrO – quality of stratospheric correction
The tropopause was located 2–3 km above the ceiling altitude of the aircraft, where the Box-AMFs for the limb, zenith and EA−10 reference spectra have virtually identical sensitivity (Fig. 5a). The stratosphere is characterized equally well from using either of the different references. To further quantify the uncertainty due to stratospheric BrO
AMTD
8, 623–687, 2015Aircraft measurements of BrO, IO, and glyoxal profiles in the tropics
R. Volkamer et al.
Title Page
Abstract Introduction
Conclusions References
Tables Figures
◭ ◮
◭ ◮
Back Close
Full Screen / Esc
Printer-friendly Version
Interactive Discussion
Discussion
P
a
per
|
Discussion
P
a
per
|
Discussion
P
a
per
|
Discussion
P
a
per
|
for tropospheric BrO dSCDs we have simulated stratospheric SCDs (SCDstrat) for the three reference geometries shown in Fig. 5a, and for the EA0 spectra from the aircraft descent. The RTM forward calculations used a RAQMS BrO profile, setting all values below 16.5 km to 0. The simulated SCDstrat for the references are 1.09×10¹³, 1.09× 10¹³ and 1.1×10¹³ for the MBL limb, MBL zenith and EA−10 at altitude reference
5
spectra, respectively. The mean SCDstrat of forward looking spectra that add to the profile (RF12 geometries) is 1.12±0.05×10¹³molec cm−2. The agreement is within 1-sigma error, demonstrating that stratospheric contributions cancel out to better than 0.03×10¹³molec cm−2BrO dSCD for all three geometries. This is∼30 times smaller than the measurement error. Similar results are observed also for NO2(see Sect. 4.2)
10
BrO dSCD – robustness of fit window and HCHO sensitivity
We further tested the robustness of the BrO dSCDs by comparing with the 2-band analysis settings (Aliwell et al., 2002) that are widely used for BrO analysis of zenith-sky and direct-sun balloon DOAS. We use a wider BrO fitting window (3-band analysis) in this work, because limb-observations do not suffer from strong stratospheric ozone
15
interferences that needs to be actively avoided by fitting a smaller BrO window with zenith-sky and direct-sun balloon DOAS (Van Roozendael et al., 2002), as had pre-viously been noted for satellite and ground-based measurements of tropospheric BrO (Van Roozendael et al., 2002; Hendrick et al., 2007; Theys et al., 2007). Figure 5b com-pares the 3-band analysis with the 2-band analysis, and the noise level of the
instru-20
ment as a function of altitude. The BrO dSCD is expressed as optical density (dSCD times absorption cross-section) for this purpose. Both analysis settings agree within fit error. There is further no dependence of the RMS noise as a function of altitude with either analysis. The 3-band BrO fit window gave slightly smaller optical density, but also results in reduced error bars, confirming that BrO is conservatively estimated
25
AMTD
8, 623–687, 2015Aircraft measurements of BrO, IO, and glyoxal profiles in the tropics
R. Volkamer et al.
Title Page
Abstract Introduction
Conclusions References
Tables Figures
◭ ◮
◭ ◮
Back Close
Full Screen / Esc
Printer-friendly Version
Interactive Discussion
Discussion
P
a
per
|
Discussion
P
a
per
|
Discussion
P
a
per
|
Discussion
P
a
per
|
BrO dSCDs derived from evaluations that differed only in the fact that a HCHO cross section spectrum was included (Table 1) or excluded from the fit show slopes that are unity within 2–7 %. The intercepts are generally smaller than 0.5×10¹³molec cm−2, which is below fit-error. No significant sensitivity towards HCHO is observed for the 3-band analysis.
5
The glyoxal and IO dSCDs were robust within the indicated error bounds for vari-ations to the fit window and polynomial order (Supplement text). For IO and glyoxal a comparison of signal-to-noise as a function of altitude is shown in Fig. 6b. There is no altitude dependence in the RMS with either trace gas. The best signal-to-noise is observed for IO in the MBL, and for glyoxal in the mid-FT. For both gases the RMS
10
noise closely resembles the photon shot noise that is expected based on the number of photons collected (see Eq. 2 in Coburn et al., 2011) in our final analysis.
Sensitivity to H2O spectral line parameters
The IO dSCDs showed a slightly larger sensitivity (∼16 %) than glyoxal dSCDs (∼ 10 %) to the choice of H2O reference spectra (Fig. S2, Supplement text). This sensitivity
15
is due to missing water lines in spectral databases such as HITEMP and HITRAN. For IO no further action was taken to account for these lines, since no apparent structure was observed in the RMS residual of the IO fit. For glyoxal, the sensitivity in the dSCDs is generally smaller than for IO; it was found to be further reduced if a H2O residual spectrum was included in the fit (equivalent to the procedure by Sinreich et al., 2007,
20
2010). The residuum did not affect the glyoxal dSCDs if it was removed from the fit, i.e., the glyoxal dSCDs changed by∼4 % whether the residuum was included or ex-cluded in the fit for either spectral database (Fig. S2, Supplement text). We estimate the uncertainty in the glyoxal dSCDs due to choice of spectral parameters as 10 % in our final analysis. Interestingly, the residuum spectrum has a balancing effect towards
25
Corrob-AMTD
8, 623–687, 2015Aircraft measurements of BrO, IO, and glyoxal profiles in the tropics
R. Volkamer et al.
Title Page
Abstract Introduction
Conclusions References
Tables Figures
◭ ◮
◭ ◮
Back Close
Full Screen / Esc
Printer-friendly Version
Interactive Discussion
Discussion
P
a
per
|
Discussion
P
a
per
|
Discussion
P
a
per
|
Discussion
P
a
per
|
orating evidence comes from H2O measurements using CE-DOAS (Supplement text), intercomparison of CE-DOAS under simulated atmospheric conditions (Thalman et al., 2014a), and field measurements of Eddy Covariance (EC) fluxes of glyoxal and H2O (Coburn et al., 2014), as is discussed further in the Supplement text.
In light of the possibility of small IO amounts in the stratosphere (Wennberg et al.,
5
1997; Dix et al., 2013), an assessment of SCDREFis included for IO in the Supplement text.
3.3 Characterizing the AMAX-DOAS trace gas retrievals
Averaging Kernel (AVK) are a product of the Optimal Estimation Inversion. They indi-cate how the retrieved state is related to measurements and a-priori (see also Sect. 3.4
10
“Sensitivity of MAX-DOAS profiles to SCDREF”). Figure 7 shows AVK that peak at unity, which indicates that our trace-gas profiles retrievals for BrO, IO, glyoxal, H2O and NO2 are well constrained by measurements. An AVK peaks at unity if the information at this altitude is coming from the measurement and is independent of the a-priori profile as-sumption. The number of independent concentration points is quantified by the degrees
15
of freedom (DoF). Our limb-measurements have 12–13 DoF for tropospheric BrO, 14– 20 DoF for IO, 12–17 DoF for glyoxal, and 13–20 DoF for NO2. This corresponds to about 500 m vertical resolution (RF17), and 1 km vertical resolution for RF12. This dif-ference in resolution is due to longer averaging times for spectra during RF12, which reduces the number of dSCD values that enter the inversion. Measurements at higher
20
time resolution over a higher altitude range have potential to increase DoF for BrO, and also IO, glyoxal and NO2accordingly.
3.4 Characterizing the SMAX-DOAS trace gas retrievals
Figures 8b and d and 9b and d show in green the AVKs for glyoxal and IO from SMAX-DOAS. The AVK exhibit a well-defined peak only for the lowest layer (100 m altitude;
25
inver-AMTD
8, 623–687, 2015Aircraft measurements of BrO, IO, and glyoxal profiles in the tropics
R. Volkamer et al.
Title Page
Abstract Introduction
Conclusions References
Tables Figures
◭ ◮
◭ ◮
Back Close
Full Screen / Esc
Printer-friendly Version
Interactive Discussion
Discussion
P
a
per
|
Discussion
P
a
per
|
Discussion
P
a
per
|
Discussion
P
a
per
|
sion grid. Both glyoxal and IO have about 2 DoF in the SMAX-DOAS profiles, and near surface concentrations mark only about half of the information content from the SMAX profiles. SMAX thus can provide independent validation data for comparison with the lowest AMAX-DOAS profile data point, since the aircraft was located at about 100 m altitude above the ship during RF17. Figures 8 and 9 show the near surface VMR for
5
glyoxal and IO from optimal estimation. The dSCDs measured from EA+1.5 were fur-ther converted to glyoxal and IO VMR using the parameterization approach described in Sinreich et al. (2010), and are compared in Figs. 8 and 9.
The second DoF holds information about the atmospheric state aloft, and is typically taken to indicate a partial VCD. Indeed, the RF17 case study provides a unique
op-10
portunity to evaluate the information content of this DoF, since the atmospheric state above the ship has been characterized by the aircraft (see above), and the radiation state is well known (Figs. 3 and 4). To our knowledge there have been no previous pro-file comparisons using MAX-DOAS on ships and aircraft where the true state (chemical and radiation) can be justified as well known.
15
Sensitivity of MAX-DOAS profiles to SCDREF
The inverse problem to interpret ground-based MAX-DOAS data is ill-posed. A con-founding factor consists in the fact that the SCDREF is unknown (Eq. 1). Optimal esti-mation trace gas retrievals need to approximate the true atmospheric profile,xt, with an assumption about the a-priori trace-gas profile, xa (Rogers, 2000). The products
20
of the inversion are the retrieved profile,xr, and the averaging kernel matrix,A, which describes how thexris related toxaandxt.
xr=xa+A(xt−xa) (2)
MAX-DOAS profile retrievals have used atmospheric models to provide best estimates forxa, e.g., see Franco et al. (2014). However, to our knowledge there has been no
25
AMTD
8, 623–687, 2015Aircraft measurements of BrO, IO, and glyoxal profiles in the tropics
R. Volkamer et al.
Title Page
Abstract Introduction
Conclusions References
Tables Figures
◭ ◮
◭ ◮
Back Close
Full Screen / Esc
Printer-friendly Version
Interactive Discussion
Discussion
P
a
per
|
Discussion
P
a
per
|
Discussion
P
a
per
|
Discussion
P
a
per
|
profiles (see Figs. 7–10), which enables us to calculate SCDREFfor the SMAX view. We approximate AMAX-profiles asxtfor the purposes of assessing the altitude range over which SMAX data are meaningful to compare with AMAX-DOAS data. This discussion exploits knowledge ofxtin two ways: (1) we have conducted a set of sensitivity studies that varied SCDREFfor glyoxal and IO using Eq. (1), and (2) the SMAX-view is simulated
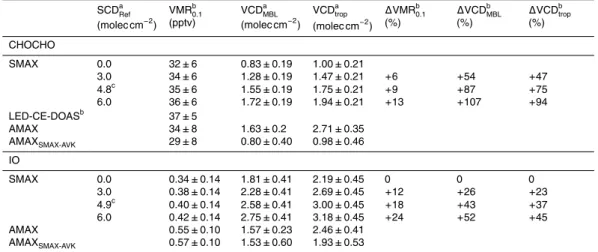
5
using Eq. (2) (dashed red line in Figs. 8a, c and 9a, c; AMAXSMAX-AVK in Table 4). The resulting trace gas profiles were analyzed, and the near surface VMR and partial tropospheric VCDs are compiled in Table 4. Table 4 shows that the near surface VMR varies by less than 10 % for glyoxal, and about 20 % for IO, independent of whether the dSCDs or SCDs are used during inversion. This result is expected, given that AVK
10
peak near 0.8 in SMAX profiles for both glyoxal and IO. The lack of sensitivity of VMR to SCDREFconfirms that SMAX-DOAS data provide for a meaningful comparison with AMAX-DOAS at the lowest altitudes probed by the aircraft.
However, the SMAX-VCD is very sensitive to the value of SCDREF. The retrieved VCD increases systematically if nonzero values of SCDREF are used to invert
SMAX-15
DOAS data based on SCDs. The SCDREF values for glyoxal and IO during RF17 are denoted in Table 4. For glyoxal the VCD in the lower 2 km almost doubles, and the agreement withxt is within error (15 %) only if the SCDREFis accounted for. Also 65 % (instead of 37 %) of the tropospheric VCD are observed from the ship. The IO VCD in-creased by 40 %, and are systematically higher thanxt (by up to 60 % below 2 km); the
20
agreement is surprisingly good, and marginally within error for tropospheric IO VCDs (within 20 %). Figure 8c (and 9c) shows that the SMAX simulated view of the AMAX glyoxal (and IO) profile closely resembles the SMAX measured view for glyoxal (AMAX measured view for IO). The VCD below 2 km agrees within better 4 % for glyoxal (and 15 % for IO). For comparison, the sensitivity studies show that the choice of the water
25
AMTD
8, 623–687, 2015Aircraft measurements of BrO, IO, and glyoxal profiles in the tropics
R. Volkamer et al.
Title Page
Abstract Introduction
Conclusions References
Tables Figures
◭ ◮
◭ ◮
Back Close
Full Screen / Esc
Printer-friendly Version
Interactive Discussion
Discussion
P
a
per
|
Discussion
P
a
per
|
Discussion
P
a
per
|
Discussion
P
a
per
|
For the purpose of AMAX-DOAS validation, we limit the use of SMAX data to the comparison of near surface VMR. No attempts have been made to optimize the xa or xa-error matrices, e.g., by using AMAX profiles as xa to avoid bias. However, it seems evident that the information content of MAX-DOAS retrievals increases towards higher altitudes if SCDREFis known. Maximizing knowledge about SCDREFis
system-5
atically exploited for AMAX-DOAS in this study, and requires independent information for ground-based MAX-DOAS. It is presently unclear whether our results that 50 % of the glyoxal and IO, and 95 % of tropospheric BrO VCD reside above 2 km apply also over other terrestrial and oceanic environments.
4 Discussion of AMAX-DOAS profiles
10
The independent validation data to assess AMAX-DOAS profiles of aerosol extinction from aerosol size distribution measurements aboard the aircraft has been discussed above (Sect. 3.1). The following sections discuss the validation of AMAX-DOAS trace gas-profiles by in situ glyoxal (Fast LED-CE-DOAS), near surface VMR of glyoxal and IO (Table 4, Sect. 4.1.1) and BrO (4.4.1) from SMAX-DOAS; NO2 predictions from
15
RAQMS (4.2), and in situ VCSEL-H2O on the aircraft and RAQMS-H2O (4.3). Given the novelty of glyoxal and BrO observations in the tropical FT, a brief discussion of literature context and atmospheric implications is further given.
4.1 Glyoxal and IO in the tropical marine atmosphere
4.1.1 Glyoxal in the MBL
20
AMTD
8, 623–687, 2015Aircraft measurements of BrO, IO, and glyoxal profiles in the tropics
R. Volkamer et al.
Title Page
Abstract Introduction
Conclusions References
Tables Figures
◭ ◮
◭ ◮
Back Close
Full Screen / Esc
Printer-friendly Version
Interactive Discussion
Discussion
P
a
per
|
Discussion
P
a
per
|
Discussion
P
a
per
|
Discussion
P
a
per
|
remote sensing instruments used a common source of calibration, i.e., the same UV-vis absorption cross-section spectrum (Volkamer et al., 2005b). Such agreement from measurements at different spatial scales is only possible in homogeneous air, such as the remote MBL. The homogeneity is corroborated from the time resolved in situ observations (Coburn et al., 2014).
5
Previous studies had measured∼80 pptv glyoxal over the Sargasso Sea by DNPH-derivatization/mass spectrometry detection (Zhou and Mopper, 1990); 40–80 pptv over the tEPO by SMAX-DOAS (Sinreich et al., 2010); 20–40 pptv during various cruises by SMAX-DOAS (Mahajan et al., 2014); 32±6 pptv (average Northern Hemisphere, NH, tropics), and 47±9 pptv (average Southern Hemisphere, SH, tropics) during the
10
TORERO cruise by LED-CE-DOAS (Coburn et al., 2014); 24 pptv over the South-ern Ocean, and 7 pptv at Cape Grim by DNPH-derivatization/high performance liquid chromatography (HPLC) detection (Lawson et al., 2014). Previous SMAX-DOAS mea-surements likely provide lower limits for the VCD, because of uncertainties regarding SCDREF(see Table 4). Notably, hemispheric gradients in the near surface VMR of
gly-15
oxal in the tropics do not show a close resemblance with satellite VCDs (Coburn et al., 2014), nor do concentrations in the MBL by Lawson et al. (2014) explain the satellite VCDs near Cape Grim. Assuming the satellite measurements are correct, this could possibly suggest that our findings that most of the glyoxal VCD is located aloft could be more broadly applicable.
20
4.1.2 Glyoxal in the tropical FT
The highest glyoxal VMR is observed in the AMAX-profile at 750 m altitude (45±7 pptv). Our measurements further show 3–20 pptv also in the tropical free troposphere. In-deed, more than 50 % of the glyoxal VCD are located above 2 km altitude. The atmo-spheric lifetime of glyoxal at tropical latitudes is only a few hours. A significant
pres-25
AMTD
8, 623–687, 2015Aircraft measurements of BrO, IO, and glyoxal profiles in the tropics
R. Volkamer et al.
Title Page
Abstract Introduction
Conclusions References
Tables Figures
◭ ◮
◭ ◮
Back Close
Full Screen / Esc
Printer-friendly Version
Interactive Discussion
Discussion
P
a
per
|
Discussion
P
a
per
|
Discussion
P
a
per
|
Discussion
P
a
per
|
Measurements of glyoxal vertical profiles are extremely scarce, and limited to terres-trial environments (Lee et al., 1998; Baidar et al., 2013a). Lee et al. (1998) detected a mean of 26 pptv glyoxal in the FT (minimum: 10 pptv; maximum: 60 pptv) above areas with strong isoprene emissions over the South Eastern US. They also measured other small oxygenated VOC, like formaldehyde, methyl glyoxal and pyruvic acid. Baidar et al.
5
(2013a) observed 5–30 pptv glyoxal between 1–3 km over Los Angeles, CA. Previous measurements of acetaldehyde in the FT (Singh et al., 2001; 2004; Kwan et al., 2006) are not free of controversy (Staudt et al., 2003; Singh et al., 2004; Millet et al., 2010). Small OVOC form from the volatilization of organic aerosol by reaction with OH radi-cals (Molina et al., 2004) and ozone (Thornberry and Abbatt, 2004), and could provide
10
a source for acetaldehyde and its oxidation product peroxyacetic acid in the FT (Kwan et al., 2006). Heterogeneous reaction of ozone with polyunsaturated fatty acids are a source for OVOC, including small yields of glyoxal (Zhou et al., 2014). The particular physic-chemical properties of glyoxal (high solubility and short lifetime) distinguish the tracer properties of this molecule from other OVOC (Coburn et al., 2014). Recent EC
15
flux measurements of glyoxal during the TORERO cruise (Coburn et al., 2014) have detected positive fluxes that locate a glyoxal source inside the sea-surface micro layer. However, during most of the day the EC flux was directed from the atmosphere into the ocean, thus requiring an airborne glyoxal source.
The vertical profiles of glyoxal and aerosol extinction show some resemblance that
20
is currently under further investigation. Atmospheric models currently do not predict any appreciable concentrations of glyoxal over oceans (Fu et al., 2008; Myriokefalitakis et al., 2008), and some satellites detect glyoxal (Wittrock et al., 2006; Vrekoussis et al., 2009; Lerot et al., 2010; Alvarado et al., 2014) while others do not find significant en-hancements over oceans (Chan Miller et al., 2014). The fact that glyoxal is distributed
25