ACPD
9, 16331–16360, 2009Information-based methane derived from AIRS and its
validation
X. Xiong et al.
Title Page
Abstract Introduction
Conclusions References
Tables Figures
◭ ◮
◭ ◮
Back Close
Full Screen / Esc
Printer-friendly Version
Interactive Discussion Atmos. Chem. Phys. Discuss., 9, 16331–16360, 2009
www.atmos-chem-phys-discuss.net/9/16331/2009/ © Author(s) 2009. This work is distributed under the Creative Commons Attribution 3.0 License.
Atmospheric Chemistry and Physics Discussions
This discussion paper is/has been under review for the journalAtmospheric Chemistry and Physics (ACP). Please refer to the corresponding final paper inACPif available.
Information-based mid-upper
tropospheric methane derived from
Atmospheric Infrared Sounder (AIRS) and
its validation
X. Xiong1,2, C. Barnet1, J. Wei1,2, and E. Maddy1,2
1
NOAA/NESDIS/Center for Satellite Applications and Research, Camp Springs, Maryland, USA
2
Perot Systems Government Services, Fairfax, Virginia, USA
Received: 24 June 2009 – Accepted: 6 July 2009 – Published: 31 July 2009
Correspondence to: X. Xiong ([email protected])
ACPD
9, 16331–16360, 2009Information-based methane derived from AIRS and its
validation
X. Xiong et al.
Title Page
Abstract Introduction
Conclusions References
Tables Figures
◭ ◮
◭ ◮
Back Close
Full Screen / Esc
Printer-friendly Version
Interactive Discussion
Abstract
Atmospheric Infrared Sounder (AIRS) measurements of methane (CH4) generally
con-tain about 1.0 degree of freedom and are therefore dependent on a priori assumptions about the vertical methane distribution as well as the temperature lapse rate and the amount of moisture. Thus it requires that interpretation and/or analysis of the CH4
5
spatial and temporal variation based on the AIRS retrievals need to use the averaging kernels (AK). To simplify the use of satellite retrieved products for scientific analysis, a method based on the information content of the retrievals is developed, in which the AIRS retrieved CH4 in the layer from 50 to 250 hPa below the tropopause is used to
characterize the mid-upper tropospheric CH4in the mid-high latitude regions. The ba-10
sis of this method is that in the mid-high latitude regions the maximum sensitive layers of AIRS to CH4 have a good correlation with the tropopause heights, and these
lay-ers are usually between 50 and 250 hPa below the tropopause. Validation using the aircraft measurements from NOAA/ESRL/GMD and the campaigns INTEX-A and -B indicated that the correlation of AIRS mid-upper tropospheric CH4 with aircraft
mea-15
surements is ∼0.6–0.7, and its the bias and rms difference are less than ±1% and 1.2%, respectively. Further comparison of the CH4 seasonal cycle indicated that the cycle from AIRS mid-upper tropospheric CH4is in a reasonable agreement with NOAA
aircraft measurements. This method provides a simple way to use the thermal infrared sounders data to approximately analyze the spatial and temporal variation CH4 in the 20
upper free tropospere without referring the AK. This method is applicable to derive tropospheric CH4as well as other trace gases for any thermal infrared sensors.
1 Introduction
As one of the most important greenhouse gases in the atmosphere, CH4has been
ob-served to rise dramatically since the preindustrial era. The increase rate was obob-served 25
sig-ACPD
9, 16331–16360, 2009Information-based methane derived from AIRS and its
validation
X. Xiong et al.
Title Page
Abstract Introduction
Conclusions References
Tables Figures
◭ ◮
◭ ◮
Back Close
Full Screen / Esc
Printer-friendly Version
Interactive Discussion nificant increase was found from 2006 to 2007 (for example, Rigby et al., 2008). The
quantification of global methane emissions still has large uncertainties (Zhuang et al., 2009), as the methane emissions have a large spatial and temporal variation and our observations are limited. For example, large CH4 emission from Arctic tundra during
the onset of freezing was found recently (Mastepanov et al., 2008); Arctic lakes have 5
recently been recognized as a major source (e.g. Walter et al., 2006); in the tropical region there are possibly some large emission from terrestrial plants (do Carmo et al., 2006; Keppler et al., 2006).
Space-borne measurements may be able to help us better understand the rela-tive strengths of the methane sources and sinks as they provide the large spatial 10
and temporal coverage. For example, from the comparison of model simulations with space-born observation using the SCanning Imaging Absorption spectroMeter for At-mospheric CHartographY (SCIAMACHY) instrument onboard ENVISAT, Frankenberg et al. (2005, 2008) pointed out the exist of some unknown CH4 sources in the trop-ical region. The Asian CH4 plume was observed during the monsoon season using
15
AIRS, and through the comparison of AIRS with model simulation, Xiong et al. (2009) suggested that the CH4emissions from rice paddies in Southeast Asia is possibly over-estimated.
Recent missions of space-borne observations of CH4 include the observation near
the tropopause to higher altitudes based on a limb viewing geometry, the observation of 20
CH4in the middle troposphere using thermal infrared spectrum, and the measurement
of total column using near infrared spectrum. The space-borne observations of CH4
based on a limb viewing geometry include the Atmospheric Chemistry Experiment-Fourier Transform Spectrometer (ACE-FTS) solar occultation instrument onboard the Canadian SCISAT-1 satellite (Nassar et al., 2005; DeMazi `ere et al., 2008), Halogen 25
ACPD
9, 16331–16360, 2009Information-based methane derived from AIRS and its
validation
X. Xiong et al.
Title Page
Abstract Introduction
Conclusions References
Tables Figures
◭ ◮
◭ ◮
Back Close
Full Screen / Esc
Printer-friendly Version
Interactive Discussion the Interferometric Monitor for Greenhouse Gases (IMG) on board the Japanese
Ad-vanced Earth Observing Satellite (ADEOS) (Clerbaux et al., 2003), Tropospheric Emis-sion Spectrometer (TES) on NASA/Aura (Payne et al., 2009 and references therein), AIRS on NASA/AQUA (Xiong et al., 2008), Infrared Atmospheric Sounding Interfer-ometer (IASI) space-borne instrument on METEOP-1 (Razavi et al., 2009; Crevoisier 5
et al., 2009). The measurement of total column using near infrared spectrum include SCIMACHY (Frankenberg et al., 2005 and 2008), and Greenhouse gases Observation SATellite (GOSAT), which carries both the Thermal And Near infrared Sensor for car-bon Observation (TANSO) (http://www.gosat.nies.go.jp/) and was launched by Japan Aerospace Exploration Agency (JAXA) on 23 January 2009.
10
However, due to limit of the information content of thermal infrared sounder, use of satellite retrieved products is complicated as we need to consider the sensitivity of the retrieval, which strongly depend on the temperature lapse rate and the amount of moisture in the atmosphere (Xiong et al., 2008). The degrees of freedom for CH4from thermal infrared sounders are 0.5–2.0 (Payne et al., 2009). Because these sounder 15
measurements are usually sensitive to a single piece of information (i.e., a vertically integrated column weighted toward the middle-to-upper troposphere), the satellite re-trieved CH4mixing ratio is not exactly equivalent to the CH4 mixing ratio in real
atmo-sphere. To better characterize the CH4mixing ratio in the atmosphere, we need to use
the averaging kernels and the a priori (or first-guess) information in the comparison of 20
AIRS retrievals with CH4 mixing ratio in the real atmosphere. For scientific analyses
of the satellite retrieved products it is desirable to use a representation in which mea-surement information is dominant and the influence of a priori information is minimal (Payne et al., 2009). To take advantage of the sensitivity characterization allowed by the retrieval on a fine grid and reduce the influence of the a priori information, Payne 25
ACPD
9, 16331–16360, 2009Information-based methane derived from AIRS and its
validation
X. Xiong et al.
Title Page
Abstract Introduction
Conclusions References
Tables Figures
◭ ◮
◭ ◮
Back Close
Full Screen / Esc
Printer-friendly Version
Interactive Discussion The aim of this paper is to develop another approach that uses the sensitivity
infor-mation of retrieval but without transforming the retrieved profile to a coarse grid (Payne et al., 2009). This approach is based on the correlation of tropopause height with the maximum sensitive layer of AIRS retrieval, and uses the retrieval of AIRS in its most sensitive layer to characterize the mid-upper tropospheric CH4 in the mid-high 5
latitude regions. Since atmospheric CH4 has a long life time of 8.7±1.3 years (IPCC,
2007) and is, in general, well-mixed in the troposphere, it should be possible to use the mid-upper tropospheric CH4 from AIRS to represent the variation of CH4 in the free troposphere atmosphere. We evaluate this method by comparing the derived tro-pospheric CH4from AIRS with in-situ aircraft measurements at 20 sites of the NOAA
10
Earth System Research Laboratory, Global Monitoring Division (NOAA/ESRL/GMD), and data from recent aircraft campaigns, i.e. Intercontinental Chemical Transport Ex-periment (INTEX) -A and -B. More evidence is provided by comparing the seasonal variation of AIRS derived tropospheric CH4 with that from aircraft measurements, in which aircraft data of multiple years in one site and data of multiple sites between 40– 15
50◦N in North America in the same year are binned separately to increase the number of samples to derive the seasonal cycle. This method provides a simple way to use the satellite retrieved products for scientific analysis, and is applicable to other long life time trace gases and for other thermal sounder instruments.
Section 2 is a brief introduction to the AIRS instrument and the retrieval of CH4. A 20
description of the method and the data used are present in Sect. 3. The validation to the AIRS mid-upper tropospheric CH4 with aircraft measurements as well as the
comparison of seasonal cycle are given in Sect. 4. A summary and conclusion are given in Sect. 5.
2 The AIRS instrument and its retrieval of atmospheric methane
25
ACPD
9, 16331–16360, 2009Information-based methane derived from AIRS and its
validation
X. Xiong et al.
Title Page
Abstract Introduction
Conclusions References
Tables Figures
◭ ◮
◭ ◮
Back Close
Full Screen / Esc
Printer-friendly Version
Interactive Discussion channels covering from 649–1136, 1217–1613 and 2169–2674 cm−1 at high spectral
resolution (λ/∆λ=1200) (Aumann et al., 2003), and the noise equivalent change in temperature (NE∆T), at 250 K reference temperature, ranges from 0.14 K in the critical 4.2µm lower tropospheric sounding wavelengths to 0.35 K in the 15µm upper tropo-spheric sounding region. The spatial resolution of AIRS is 13.5 km at nadir, and in 5
a 24-h period AIRS nominally acquires measurements over the complete globe twice daily. In order to retrieve CH4 in both clear and partially cloudy scenes, 9 AIRS pixels
in the footprint of an Advanced Microwave Sounding Unit (AMSU) pixel are used to de-rive the cloud-cleared radiance (CCR) in this field of regard. The CCR product is then used for sounding retrievals with the spatial resolution of about 45 km. The version 5 10
of AIRS product retrieval software has been put into operation at NASA Goddard Earth Sciences Data and Information Services Center (DISC), and these data are available at the Goddard DISC (http://disc.gsfc.nasa.gov/AIRS/index.shtml/). An “off-line” ver-sion of the AIRS product is run at NOAA National Environmental Satellite, Data, and Information Service (NESDIS), Center for Satellite Application and Research, where 15
the data are thinned to a 3◦×3◦spatial grid, and these data are used in this paper. The “off-line” version of the AIRS product differs from the operational version in that the “off-line” version does not use AMSU channel 4 in any of its microwave retrieval steps, regressions, or in product quality assurance, whereas the DAAC version uses a synthetic regression based on other AMSU channels to predict AMSU channel 4. Due 20
to the differences in retrieval state initialization regression operators, slight differences between the DAAC operational version and the “off-line” version will be apparent for all data after October 2007.
Different from SCIAMACHY which uses the absorption spectra of solar radiation in the near-infrared and is sensitive to the total methane column amount, AIRS is a nadir 25
cross-track scanning infrared spectrometer, and is most sensitive to CH4in the middle
to upper troposphere. As detailed by Xiong et al. (2008), 71 AIRS channels near 7.6µm are used for the CH4 retrieval in version 5, and the atmospheric temperature profile,
ACPD
9, 16331–16360, 2009Information-based methane derived from AIRS and its
validation
X. Xiong et al.
Title Page
Abstract Introduction
Conclusions References
Tables Figures
◭ ◮
◭ ◮
Back Close
Full Screen / Esc
Printer-friendly Version
Interactive Discussion from other AIRS channels. In the CH4 retrieval, the change of CH4 is derived using
a singular value decomposition (SVD) on the weighted covariance of the sensitivity matrix and damping the least significant eigenfunctions of the SVD to constrain the solution (Susskind et al., 2003). This retrieval methodology minimizes the dependence of the solution to the first-guess field and the first-guess error characteristics, and relies 5
exclusively on the signal to noise of the observation to indicate the degree to which the information contained in the radiances should be believed. The first-guess CH4 profile is a smooth function of latitude and altitude, but does not varies with time and longitude. It was generated by using a non-linear polynomial fitting to various data, including aircraft measurements and model data (Xiong et al., 2008).
10
3 Method and data
3.1 Relationship between the AIRS maximum sensitive layer and the tropopause in the mid-high latitude regions
AIRS is a thermal infrared sounder sensitive to CH4in the middle to upper troposphere.
From both the weighting function and the averaging kernels it is evident that the re-15
trieved CH4in different layers are not independent, and the sensitivity of the AIRS CH4
retrieval varies with time and location due to the variation of atmospheric state vari-ables (Xiong et al., 2008). An appropriate validation to the retrieval requires the use of the averaging kernels. However, it is no doubt that the retrieved CH4 in the maximum
sensitive layer of AIRS will better characterize the CH4in the atmosphere than any
oth-20
ers layers. Therefore when performing a comparison of the AIRS retrieved CH4profiles with measurements, it is better to compare CH4measurements with AIRS retrievals at
altitudes that correspond with the maximum sensitivity for AIRS. The problem is that the most sensitive layer, which is usually determined from the averaging kernels, varies with atmospheric temperature and moisture profiles. The main reason that the most 25
ACPD
9, 16331–16360, 2009Information-based methane derived from AIRS and its
validation
X. Xiong et al.
Title Page
Abstract Introduction
Conclusions References
Tables Figures
◭ ◮
◭ ◮
Back Close
Full Screen / Esc
Printer-friendly Version
Interactive Discussion that our algorithm relies on the vertical sensitivity of AIRS to CH4 (i.e., the sensitivity
covariance) to provide a smoothing constraint. Our retrieval product therefore moves relative to the CH4a priori in linear combinations of the eigenvectors of the sensitivity
covariance (Maddy and Barnet, 2008). On the other hand, use of a priori information (Rodgers, 2000) to constrain the inversion minimizes the vertical displacement of the 5
retrieval’s most sensitive layer by constraining the retrieval product to move in linear combinations of eigenvectors of the a priori covariance (see for instance, Pan et al., 1998).
Another difficulty is that the most sensitive layer is a quantity derived from the av-eraging kernels and currently not distributed within the V5 output data stream. This 10
complicates the use of this diagnostic level to compare retrieved data with in-situ mea-surement or model simulations in that both averaging kernels and retrieval products are required.
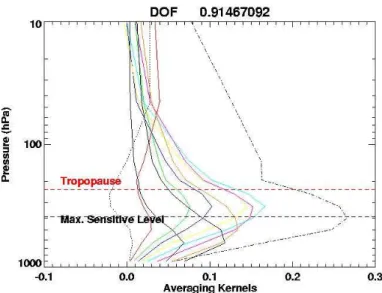
As an example, Fig. 1 shows the averaging kernels average of 3 days (1–3 August 2004) in Alaska (longitude=150◦W, latitude=66◦N). 11 trapezoid functions were used 15
in this retrieval. For convenience, the maximum sensitive level is used in this paper, which is defined as the pressure level where the maximum of averaging kernels area is located at the 100 level grid of the forward radiative transfer model (Strow et al., 2003). To obtain this, the area of averaging kernels (marked in black dash line in Fig. 1) in the effective pressure levels of the 11 trapezoid functions was interpolated to the 100 level 20
radiative transfer model grid. The tropopause for each profile was computed using temperature profile, which is retrieved from AIRS using 91 channels independent of the CH4 retrieval channels (Susskind et al., 2003), and the surface pressure, which was from the NCEP GFS model (Kanamitsu et al., 1991). The details of the algorithm to compute the thermal tropopause can be refereed to Reichler et al. (2003). In this 25
example, the tropopause is at 234.0 hPa, and the most sensitive level, 390.9 hPa, is 156.9 hPa below the tropopause.
ACPD
9, 16331–16360, 2009Information-based methane derived from AIRS and its
validation
X. Xiong et al.
Title Page
Abstract Introduction
Conclusions References
Tables Figures
◭ ◮
◭ ◮
Back Close
Full Screen / Esc
Printer-friendly Version
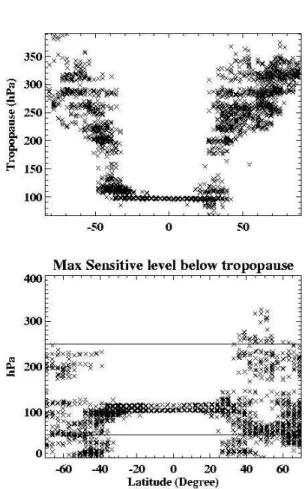
Interactive Discussion good correlation with the tropopause. As an example, Fig. 2 illustrates the variation of
tropopause and the maximum sensitive level with latitude using one day global data in 4 March 2006 (Fig. 2). In this example, the tropopause decreases from∼120 hPa at near tropics to∼300 hPa at high Northern Hemisphere with latitudes greater 45◦N. From the difference between the maximum sensitive level minus the tropopause (lower 5
panel of Fig. 2), we can see the maximum sensitive levels are mostly located between 50 and 250 hPa below tropopause.
3.2 The mid-upper tropospheric CH4derived from AIRS retrievals
based on tropopause
The finding of the correlation between AIRS’ retrieved tropopause and the maximum 10
sensitive level enables the use of the tropopause as an indicator of the most sensitive layer of the retrieval. Since the layer from 50 to 250 hPa below tropopause is a good approximation for the maximum sensitive layer of AIRS, in this paper we use the aver-age of AIRS retrieved CH4 in the layer starting from 50 to 250 hPa below tropopause
to represent the CH4 in the corresponding layer in the real atmosphere. In the mid-15
high latitude regions, this layer is mostly at 300–500 hPa, and 400–600 hPa in the high latitude in the winter. In the summer the maximum sensitive level is higher due to the increase of water amount in the atmosphere, thus it is closer to the tropopause. For simplification, we referred CH4at this layer as mid-upper tropospheric CH4.
3.3 AIRS CH4and aircraft measurement data
20
AIRS retrieval products at 3◦×3◦ spatial grid, generated at NOAA/NESDIS/STAR, are used in this paper. To minimize the sampling bias requires enough match-up profiles from AIRS corresponding to each aircraft profile, so the match-up AIRS profiles are picked up if they are within the same day and 800 km of the measurement time and site location. The mean of all these match-up profiles will be compared to the corre-25
ACPD
9, 16331–16360, 2009Information-based methane derived from AIRS and its
validation
X. Xiong et al.
Title Page
Abstract Introduction
Conclusions References
Tables Figures
◭ ◮
◭ ◮
Back Close
Full Screen / Esc
Printer-friendly Version
Interactive Discussion Aircraft measurements of CH4 from NOAA /ESRL/GMD Carbon Cycle Group were
used for a preliminary validation to AIRS CH4(Xiong et al., 2008) for up to∼300 hPa. In
this paper we limit the comparison to data above 500–600 hPa. Aircraft measurements of CH4from INTEX -A and -B provide more profiles with measurements up to 200 hPa. These campaign data can be better used to validate AIRS CH4in the level where AIRS
5
has the largest sensitivity in the middle to upper troposphere. To convolve the “truth” of aircraft measurement using the averaging kernels and a priori profiles (Xiong et al., 2008), we need to extrapolate the in-situ aircraft data to higher altitudes, and this was done by using the monthly average of model simulated data from the TM3 (Houwelling et al., 2006).
10
Both the aircraft measurement and the convolved “truth” derived from aircraft mea-surement are used for comparison with the match-up data from AIRS. Only aircraft measurements whose latitudes are larger than 25◦N and have valid measurements in the layer of 50 to 250 hPa below the tropopause are used in this paper.
4 Validation of AIRS mid-upper tropospheric CH4using aircraft measurements
15
4.1 NOAA/ESRL/GMD aircraft measurements
These aircraft measurements of CH4are made by routinely collecting the air samples
using 0.7 L silicate glass flasks on biweekly to monthly aircraft flights at 22 sites, oper-ated by the NOAA/ESRL/GMD Carbon Cycle Group. Air samples were collected using turboprop aircraft with maximum altitude limits of 300–350 hPa. Individual flights re-20
quired about 1.5 h to complete. Measurements were made by collecting samples of air (approximately 0.7 liter volume at 40 psa) in glass containers. Twelve to twenty flasks are held in a suitcase-sized container, and collection of air in a single flask at a unique altitude allows a sampling vertical resolution up to 400 m in the boundary layer. After each flight the flask packages are shipped to the NOAA laboratory in Boulder, Colorado 25
ACPD
9, 16331–16360, 2009Information-based methane derived from AIRS and its
validation
X. Xiong et al.
Title Page
Abstract Introduction
Conclusions References
Tables Figures
◭ ◮
◭ ◮
Back Close
Full Screen / Esc
Printer-friendly Version
Interactive Discussion Xiong et al. (2008). However, data in Rarotonga, Cook Islands (RTA) and Molokai
Is-land, Hawaii, United States (HAA) are not used as they are in the tropics. For the rest 20 sites, the mean of the measured CH4mixing ratio in the layer of 50–250 hPa below
the tropopause is compared with AIRS.
Figure 3 shows the comparison of the mid-upper tropospheric CH4 from AIRS with
5
the aircraft measurements operated by NOAA/ESRL/GMD from August 2003 to Febru-ary 2006. Note that only those profiles that have measurement data at the layer of 50–250 hPa below the tropopause were used. Along the x-axis is the aircraft mea-surement not convolved (triangles) and the convolved one (diamonds) using averaging kernels (AK), and along the y-axis is the mean of AIRS retrieved profiles within 24 h and 10
800 km of the aircraft measurement time and site location. The correlation coefficient using the convolved truth, 0.64, is a little larger than using real aircraft measurement, 0.57. Compared to the previous validation on the layer 358–459 and 459–596 hPa by Xiong et al. (2008) (lower left and upper right panels of Fig. 9b), if we zoom in the mid-high latitude regions, the correlation between AIRS and aircraft measurements 15
has been significantly improved. The bias and rms error compared with the aircraft measurement (non-convolved) is−0.57% and 1.0%, respectively. However, the bias and rms errors using the convolved truth are a little larger than using the aircraft mea-surements directly. This is out of expectation but understandable as NOAA/ESRL/GMD aircraft data are mostly below 350 hPa. While applying to AK to convolve the aircraft 20
measurements, we need to extrapolate the aircraft data to upper altitudes using the monthly mean model data, which brings some uncertainties to the “convolved” truth.
4.2 INTEX-A
The INTEX-A field mission was conducted in the summer of 2004 (1 July to 15 August 2004) over North America (NA) and the Atlantic. This effort had a broad scope to inves-25
Euro-ACPD
9, 16331–16360, 2009Information-based methane derived from AIRS and its
validation
X. Xiong et al.
Title Page
Abstract Introduction
Conclusions References
Tables Figures
◭ ◮
◭ ◮
Back Close
Full Screen / Esc
Printer-friendly Version
Interactive Discussion pean and North American partners to explore the composition of the troposphere over
NA and the Atlantic as well as radiative properties and effects of clouds and aerosols in a coordinated manner (Singh et al., 2006). Air sample is collected into a conditioned, evacuated 2-L stainless steel canister equipped with a bellows valve, and is returned to our UC-Irvine laboratory for CH4analysis using gas chromatography (GC, HP-5890A) 5
with flame ionization detection (FID). The use of primary CH4 calibration standards
dating back to late 1977 ensures that our measurements are internally consistent. The measurement accuracy is±1% and the analytical precision at atmospheric mixing ra-tios is about 1 ppbv (Simpson et al., 2002, 2006).
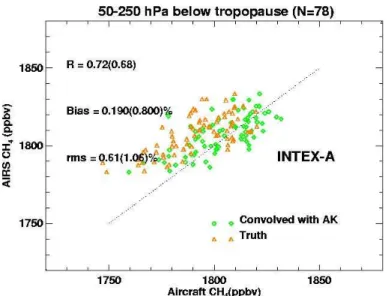
Comparison of the mid-upper tropospheric CH4derived AIRS with aircraft
measure-10
ment from INTEX-A is illustrated in Fig. 4. The number of aircraft profiles used is N=78. As expected, the correlation coefficient, bias and rms errors using the convolved truth is smaller than using non-convolved truth. The bias and rms error compared with the aircraft measurement (non-convolved) is 0.80% and 1.06%, respectively, and the correlation coefficient of the mid-upper tropospheric CH4 derived AIRS with aircraft
15
measurement (non-convolved) is 0.68.
4.3 INTEX-B
Intercontinental Chemical Transport Experiment-B (INTEX-B) was a major NASA led multi-partner atmospheric field campaign completed in the spring of 2006 (http://cloud1.arc.nasa.gov/intex-b/). INTEX-B was performed in two phases. In its 20
first phase (1–21 March), INTEX-B operated as part of the MILAGRO campaign with a focus on observations over Mexico and the Gulf of Mexico. In the second phase (17 April–15 May), the main INTEX-B focus was on trans-Pacific Asian pollution transport. Multiple airborne platforms carrying state of the art chemistry and radiation payloads were flown in concert with satellites and ground stations during the two phases of 25
INTEX-B (Singh et al., 2009).
ACPD
9, 16331–16360, 2009Information-based methane derived from AIRS and its
validation
X. Xiong et al.
Title Page
Abstract Introduction
Conclusions References
Tables Figures
◭ ◮
◭ ◮
Back Close
Full Screen / Esc
Printer-friendly Version
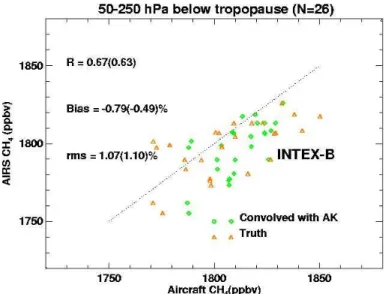
Interactive Discussion of AIRS CH4compared with aircraft measurements in INTEX-B (Fig. 5) are larger than
INTEX-A, and the bias of AIRS mid-upper tropospheric CH4 is−0.49%, and the rms
error is 1.10%. The large negative bias is mainly from the profiles near the tropical regions, which may be associated with the tuning of 2% increase in CH4 absorption coefficients for strong absorption channels (Xiong et al., 2008), indicating some ad-5
justment of the turning will be required for the future improvement of CH4 retrievals
from AIRS. The correlation coefficient of the mid-upper tropospheric CH4derived AIRS with aircraft measurement (non-convolved) is 0.63, which is just a little smaller than in INTEX-A.
Further comparison of the biases using three different aircraft data sets indicates that 10
INTEX-A shows a positive bias while NOAA and INTEX-B aircrafts show negative bias (Fig. 6). One reason is that measurements in INTEX-A were taken in the summer in the mid-high Northern Hemisphere. If we selected the profiles in July and August, there are 89 profiles among all the NOAA/ESRL/GMD profiles from August 2003 to February 2006, and retrieval bias of AIRS compared with the aircraft measurement (convolved) 15
becomes −0.11%. This indicates some dependence of the retrieval error with the season. From the biases for different months estimated from NOAA/ESRL/GMD data (Fig. 6), we can see that the bias in the summer is smaller than in other seasons. As discussed before, the moist air during the summer pushes the maximum sensitive layer of AIRS to a higher altitude region than other seasons, and the lapse rate and 20
the degree of freedom in the retrievals the summer is relatively larger (Xiong et al., 2008). In Fig. 6 we plotted the biases from INTEX-A and -B in the time corresponding to their own aircraft measurements. From Fig. 6 we can see that the bias using INTEX-B data is very close to that using NOAA aircraft data, but the bias using INTEX-A data is about 0.5% higher than that using NOAA aircraft data. We found that in INTEX-A, 25
match-ACPD
9, 16331–16360, 2009Information-based methane derived from AIRS and its
validation
X. Xiong et al.
Title Page
Abstract Introduction
Conclusions References
Tables Figures
◭ ◮
◭ ◮
Back Close
Full Screen / Esc
Printer-friendly Version
Interactive Discussion up. We noted that there is a large forest fires in Alaska during the campaign of
INTEX-A, this unusual event may bring some additional uncertainty.
4.4 Examples of seasonal variation of mid-upper tropospheric CH4from AIRS and its comparison with aircraft measurements
Another way to evaluate whether the mid-upper tropospheric CH4 derived from AIRS 5
can characterize the CH4in the real atmosphere is to check whether its seasonal cycle
is consistent with aircraft measurements of NOAA/ESRL/GMD. As an example, data from Poker Flat, Alaska is plotted in Fig. 7. Each point for the AIRS data is an average of the retrievals within 800 km around the Poker Flat, while the blue squares denote the average of aircraft measurements in layer from 50 to 250 hPa below the mean 10
tropopause of the corresponding AIRS match-up profiles. The solid line is the running mean in 30 days for AIRS derived tropospheric CH4.
Comparison of AIRS CH4 with aircraft measurements shows that overall their
sea-sonal cycles are in a good agreement (Fig. 7). Specifically, they both show the de-crease of CH4in April–May with the minimum occurring in late May to early June. It is 15
evident from AIRS that the CH4 increases significantly in the early summer from late
June to July. Although the large difference in the sampling interval between AIRS and aircraft measurement makes this comparison difficult, the early summer increase was sampled successfully by aircraft measurements. We found that for all the aircraft pro-files from May to July in 2004 and 2005, and the one with the largest CH4mixing ratio
20
occurs in 10 July 2004 and 29 June 2005, respectively. A slight decrease is evident in late July to August from both AIRS and aircraft measurement, but the decrease is more significant from aircraft measurement. The time of this decrease of CH4is
con-sistent with the occurring of the minimum of CH4 at the marine boundary layer, and is attributed to the photochemical loss of CH4. Increase of CH4in late August to
Septem-25
ACPD
9, 16331–16360, 2009Information-based methane derived from AIRS and its
validation
X. Xiong et al.
Title Page
Abstract Introduction
Conclusions References
Tables Figures
◭ ◮
◭ ◮
Back Close
Full Screen / Esc
Printer-friendly Version
Interactive Discussion Since the aircraft measurements are made only 1 or 2 times a month, a monthly
climatology of all aircraft measurements from 1999 to February 2006 with the annual mean in each year removed have been plotted in the lower panel. The number of aircraft sampling is increased significantly, so it is better to view the seasonal cycle from the running means in 30 days (blue dash line). Two years’ AIRS data within an 5
area of 800 km in 2004 and 2005 are used to derive the seasonal cycle (dark solid line). One obvious difference between them is the magnitudes of CH4 increase in the early summer and the decrease in the August from aircraft, which are larger from aircraft measurements than from AIRS. The spread of CH4from aircraft measurement among
different year is large, so the difference of the seasonal cycle from AIRS with that from 10
aircraft measurements is associated with the difference in the sampling time.
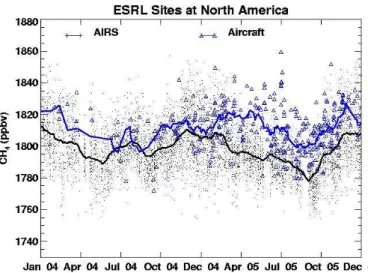
Another way to add the sampling of aircraft measurements is to combine measure-ments from different sites that are close to each other. This can be done by mixing all the measurements from 13 sites in the region from 40◦N to 50◦N and 70◦W to 127◦W
in the North America. The seasonal cycle illustrated from the 30 days’ running mean 15
of all these aircraft data is compared with the seasonal cycle of AIRS averaged in this region (Fig. 8). Considering the correlation between AIRS retrieval with aircraft mea-surements is mostly less than 0.7, which implies that the AIRS can detect the variation of CH4 in the real atmosphere less than ∼50% (R
2
=0.49), the seasonal cycle from aircraft is in reasonable agreement with AIRS. The agreement of the seasonal cycle 20
in 2005 is better than in 2004 as more aircraft measurements were available in 2005. The spread of aircraft measurements is partially due to the large latitudinal gradient between 40 and 50◦N. From Fig. 8 we can also see that AIRS CH
4is lower than
air-craft measurements, and the mean bias in these two years is – 16.5 ppbv, which is consistent with the bias of−0.9% (Fig. 3).
25
Due to the large difference in the sampling time and location, comparison between AIRS and aircraft measurement is difficult. Since the first guess of CH4 is a smooth
function of latitude and pressure and has no seasonal variation in the retrieval of CH4
agree-ACPD
9, 16331–16360, 2009Information-based methane derived from AIRS and its
validation
X. Xiong et al.
Title Page
Abstract Introduction
Conclusions References
Tables Figures
◭ ◮
◭ ◮
Back Close
Full Screen / Esc
Printer-friendly Version
Interactive Discussion ment with aircraft measurement, as illustrated in Figs. 7 and 8, indicate that the
mid-upper tropospheric CH4from AIRS provides valuable information of CH4 in the atmo-sphere.
5 Summary and conclusions
Our analysis shows that the tropopause correlates well with the maximum sensitive 5
level in the middle to high latitude regions. As the most sensitive levels is usually located between 50 to 250 hPa below the tropopause, a new approach was developed to use the AIRS CH4in this layer to characterize the variation of CH4in the mid-upper
troposphere. This method is only applicable in the mid-high latitude. The mean CH4
between 50 to 250 hPa below the tropopause using AIRS retrievals will be derived as 10
a new product of CH4from AIRS. This new product together with the current products will be available to the users.
Validation to this product has been made using aircraft data from NOAA/ESRL/GMD and the campaigns INTEX-A and -B. Comparison results show the rms error is less than 1.2%. The accuracy is less than ±1%, depending on different seasons. The 15
correlation coefficients are about 0.6–0.7. Another way to evaluate AIRS CH4 was
made by comparing the season cycle from AIRS mid-upper tropospheric CH4 with NOAA/ESRL/GMD aircraft measurements. Due to the fact that the aircraft measure-ments are sparse, we binned the aircraft samples to derive the seasonal cycle. In one approach the samples of multiple years from 1999–2006 at Poker Flat, Alaska were 20
binned into a single year, and in another approach the samples from multiple sites be-tween 40–50◦N in North America were combined. The comparison results indicated that the seasonal cycle of AIRS mid-upper tropospheric CH4is in a reasonable agree-ment with that from aircraft measureagree-ment, suggesting that this new information-based product provides some valuable information of CH4in the mid-upper troposphere. This
25
estima-ACPD
9, 16331–16360, 2009Information-based methane derived from AIRS and its
validation
X. Xiong et al.
Title Page
Abstract Introduction
Conclusions References
Tables Figures
◭ ◮
◭ ◮
Back Close
Full Screen / Esc
Printer-friendly Version
Interactive Discussion tions of CH4emissions from northern wetlands/permafrost in these regions have large
uncertainties (Zhuang et al., 2009). However, due to the limit of aircraft data, further validations using the upcoming aircraft measurements and ground-based remote sens-ing will be on-gosens-ing.
The uncertainties in AIRS retrievals include (1) the errors in atmospheric temperature 5
and moisture profiles, surface temperature and emissivity derived from other channels of AIRS, (2) the errors in cloud/clearing, and (3) the noise of the sensor. The errors in cloud/clearing could be the largest source of uncertainty and is hard to estimate, but no systematic bias has been found, and on average the difference between the AIRS retrieved CH4 between clear cases (with the cloud fraction less than 0.1) and 10
cloud cases (with the cloud fraction over 0.8) is usually less than 1.0%. Uncertainty in the temperature and surface pressure will impact the computation of tropopause, but the error in the tropopause height to this new product should be small because the layer of 50 to 250 hPa below the tropopause used is a broad layer with a thickness of about 3–3.5 km. However, the changing the trapezoid functions has some influence 15
on the maximum sensitive level, so for other thermal infrared sounders using different trapezoid functions, an optimized layer below the tropopause may be used. Difference in the calibration of aircraft measurement among these three sets will also contribute to some error in these validations, but this impact should be a small factor. On the contrary, a larger uncertainty can be from the aircraft sampling interval, altitude and 20
speed of flight, as well as the preprocessing of these in-situ data to obtain the profiles (as a mean profile corresponding to one time and location). The aircraft measurements from NOAA/ESRL/GMD have mostly not covered the whole altitude range of the layer from 50 to 250 hPa below the tropopause used by AIRS, while data from INTEX-A and -B have better coverage of these altitude ranges. This difference could be one reason 25
why the validation results from INTEX-A and -B are a little different from using NOAA data. Even though CH4is well-mixed in the troposphere, its temporal variation from the
ACPD
9, 16331–16360, 2009Information-based methane derived from AIRS and its
validation
X. Xiong et al.
Title Page
Abstract Introduction
Conclusions References
Tables Figures
◭ ◮
◭ ◮
Back Close
Full Screen / Esc
Printer-friendly Version
Interactive Discussion measurements were not carried out for the purpose to validate AIRS trace products,
so we have not other choices.
As an new product following the AIRS retrievals, this method to derive mid-upper tro-pospheric CH4based on the tropopause height makes it easy to analyze the seasonal variation of CH4 in the mid-upper troposphere without referring the averaging kernels.
5
However, the averaging kernels still need to be used in many situations, for example, if we want to assimilate the AIRS products into the models to improve the estimation of CH4sources/sinks.
This method as well as the validation to the satellite retrieved CH4 will be applied to
retrievals from the EUMETSAT Infrared Atmospheric Sounding Interferometer (IASI) at 10
NOAA/NESDIS/STAR. As more data becomes available, comparisons between AIRS and IASI will be made to extend our validation of these satellite products. This method is also applicable to other thermal infrared sounders, such as Cross-track Infrared Sounder (CrIS). It is also possible to use our method for other trace gas retrievals that use the NOAA AIRS/IASI/CrIS algorithm and thermal infrared sounder measurements, 15
such as CO2, N2O and possibly CO.
Acknowledgements. This research was supported by funding from NOAA Office of Applica-tion & Research climate program. The views, opinions, and findings contained in this pa-per are those of the authors and should not be construed as an official National Oceanic and Atmospheric Administration or US Government position, policy, or decision. The data 20
of INTEX-A and -B used in this publication was obtained from Aura Validation Data Center (AVDC) (http://avdc.gsfc.nasa.gov/index.php) and aircraft measurements were carried out by Donald R. Blake of Department of Chemistry, University of California, Irvine. We appreciate Colm Sweeney at NOAA Earth System Research Laboratory, Global Monitoring Division Car-bon Cycle Group for providing the NOAA/ESRL/GMD aircraft measurements and constructive 25
ACPD
9, 16331–16360, 2009Information-based methane derived from AIRS and its
validation
X. Xiong et al.
Title Page
Abstract Introduction
Conclusions References
Tables Figures
◭ ◮
◭ ◮
Back Close
Full Screen / Esc
Printer-friendly Version
Interactive Discussion
References
Aumann, H. H., Chahine, M. T., Gautier, C., Goldberg, M. D., Kalnay, E., McMillin, L. M., Revercomb, H., Rosenkranz, P. W., Smith, W. L., Staelin, D. H., Strow, L. L., and Susskind, J.: AIRS/AMSU/HSB on the aqua mission: Design, science objectives, data products, and processing systems, IEEE T. Geosci. Remote, 41, 253–264, 2003.
5
Clerbaux, C., Hadji-Lazaro, J., Turquety, S., M ´egie, G., and Coheur, P.-F.: Trace gas measure-ments from infrared satellite for chemistry and climate applications, Atmos. Chem. Phys., 3, 1495–1508, 2003,
http://www.atmos-chem-phys.net/3/1495/2003/.
Crevoisier, C., Nobileau, D., Fiore, A. M., Armante, R., Ch ´edin, A., and Scott, N. A.: A new 10
insight on tropospheric methane in the Tropics - first year from IASI hyperspectral infrared observations, Atmos. Chem. Phys. Discuss., 9, 6855–6887, 2009,
http://www.atmos-chem-phys-discuss.net/9/6855/2009/.
De Mazi `ere, M., Vigouroux, C., Bernath, P. F., Baron, P., Blumenstock, T., Boone, C., Brogniez, C., Catoire, V., Coffey, M., Duchatelet, P., Griffith, D., Hannigan, J., Kasai, Y., Kramer, I., 15
Jones, N., Mahieu, E., Manney, G. L., Piccolo, C., Randall, C., Robert, C., Senten, C., Strong, K., Taylor, J., T ´etard, C., Walker, K. A., and Wood, S.: Validation of ACE-FTS v2.2 methane profiles from the upper troposphere to the lower mesosphere, Atmos. Chem. Phys., 8, 2421–2435, 2008,
http://www.atmos-chem-phys.net/8/2421/2008/. 20
Dlugokencky, E. J., Houweling, S., Bruhwiler, L., Masarie, K. A., Lang, P. M., Miller, J. B., and Tans, P. P.: Atmospheric methane levels off: Temporary pause or a new steady-state?, Geophys. Res. Lett., 30(19), 1992, doi:10.1029/2003GL018126, 2003.
do Carmo, J. B., Keller, M., Dias, J. D., de Camargo, P. B., and Crill, P.: A source of methane from upland forests in the Brazilian Amazon, Geophys. Res. Lett., 33, L04809, 25
doi:10.1029/2005GL025436, 2006.
Frankenberg, C., Meirink, J. F., van Weele, M., Platt, U., and Wagner, T.: Assessing methane emissions from global space-borne observations, Science, 308, 1010–1014, 2005.
Frankenberg, C., Bergamaschi, P., Butz, A., Houweling, S., Meirink, J. F., Notholt, J., Pe-tersen, A. K., Schrijver, H., Warneke, T., and Aben, I.: Tropical methane emissions: 30
ACPD
9, 16331–16360, 2009Information-based methane derived from AIRS and its
validation
X. Xiong et al.
Title Page
Abstract Introduction
Conclusions References
Tables Figures
◭ ◮
◭ ◮
Back Close
Full Screen / Esc
Printer-friendly Version
Interactive Discussion Houweling, S., R ¨ockmann, T., Aben, I., Keppler, F., Krol, M., Meirink, J. F., Dlugokencky, E. J.,
and Frankenberg, C. : Atmospheric constraints on global emissions of methane from plants, Geophys. Res. Lett., 33, L15821, doi:10.1029/2006GL026162, 2006.
IPCC: Intergovernmental Panel on Climate Change, The Physical Science Basis, edited by: Solomon, S., Qin, D., Manning, M., Chen, Z., Marquis, M., Averyt, K. B., Tignor, M., and 5
Miller, H. L., Cambridge University Press, Cambridge, United Kingdom and New York, NY, USA, 500–590, 2007.
Kanamitsu, M., Alpert, J. C., Campana, K. A., Caplan, P. M., Deaven, D. G., Iredell, M., Katz, B., Pan, H.-L., Sela, J., and White, G. H.: Recent changes implemented into the global forecast system at NMC, Weather Forecast., 6, 425–435, 1991.
10
Keppler, F., Hamilton, J. T. G., Braß, M., and R ¨ockmann, T.: Methane emissions from terrestrial plants under aerobic conditions, Nature, 439, 187–191, 2006.
Maddy, E. S. and Barnet, C. D.: Vertical resolution estimates in Version 5 of AIRS operational retrievals, IEEE T. Geosci. Remote, 46(8), 2375–2384, 2008.
Mastepanov, M. and Christensen, T. R.: Large tundra methane burst during onset of freezing, 15
Nature, 456, p. 628, 2008.
Nassar, R., Bernath, P. F., Boone, C. D., Manney, G. L., McLeod, S. D., Rinsland, C. P., Skelton, R., and Walker, K. A.: Stratospheric abundances of water and methane based on ACE-FTS measurements, Geophys. Res. Lett., 32, L15S04, doi:10.1029/2005GL022383, 2005. Pan, L., Gille, J. C., Edwards, D. P., Bailey, P. L., and Rodgers, C. D.: Retrieval of tropospheric 20
carbon monoxide for the MOPITT experiment, J. Geophys. Res., 103(D24), 32 277–32 290, 1998.
Payan, S., Camy-Peyret, C., Oelhaf, H., Wetzel, G., Maucher, G., Keim, C., Pirre, M., Huret, N., Engel, A., Volk, M. C., Kuellmann, H., Kuttippurath, J., Cortesi, U., Bianchini, G., Men-caraglia, F., Raspollini, P., Redaelli, G., Vigouroux, C., De Mazi `ere, M., Mikuteit, S., Blumen-25
stock, T., Velazco, V., Notholt, J., Mahieu, E., Duchatelet, P., Smale, D., Wood, S., Jones, N., Piccolo, C., Payne, V., Bracher, A., Glatthor, N., Stiller, G., Grunow, K., Jeseck, P., Te, Y., and Butz, A.: Validation of version-4.61 methane and nitrous oxide observed by MIPAS, Atmos. Chem. Phys., 9, 413–442, 2009,
http://www.atmos-chem-phys.net/9/413/2009/. 30
ACPD
9, 16331–16360, 2009Information-based methane derived from AIRS and its
validation
X. Xiong et al.
Title Page
Abstract Introduction
Conclusions References
Tables Figures
◭ ◮
◭ ◮
Back Close
Full Screen / Esc
Printer-friendly Version
Interactive Discussion doi:10.1029/2008JD010155, 2009.
Razavi, A., Clerbaux, C., Wespes, C., Clarisse, L., Hurtmans, D., Payan, S., Camy-Peyret, C., and Coheur, P. F.: Characterization of methane retrievals from the IASI space-borne sounder, Atmos. Chem. Phys. Discuss., 9, 7615–7643, 2009,
http://www.atmos-chem-phys-discuss.net/9/7615/2009/. 5
Rigby, M., Prinn, R. G., Fraser, P. J., et al.: Renewed growth of atmospheric methane, Geophys. Res. Lett., 35, L22805, doi:10.1029/2008GL036037, 2008.
Park, M., Randel, W. J., Kinnison, D. E., Garcia, R. R., and Choi, W.: Seasonal variation of methane, water vapor, and nitrogen oxides near the tropopause: Satellite observations and model simulations, J. Geophys. Res.-Atmos., 109, D03302, doi:10.1029/2003JD003706, 10
2004.
Rodgers, C. D.: Inverse Methods for Atmospheric Sounding, edited by: Hackensack, N. J., World Scientific Publishing Company, 2000.
Simpson, I. J., Chen, T.-Y., Blake, D. R., and Rowland, F. S.: Implications of the recent fluc-tuations in the growth rate of tropospheric methane, Geophys. Res. Lett., 29(10), 1479, 15
doi:10.1029/2001GL014521, 2002.
Simpson, I. J., Rowland, F. S., Meinardi, S., and Blake, D. R.: Influence of biomass burning during recent fluctuations in the slow growth of global tropospheric methane, Geophys. Res. Lett., 33, L22808, doi:10.1029/2006GL027330, 2006.
Singh, H. B., Brune, W. H., Crawford, J. H., Flocke, F., and Jacob, D. J.: Chemistry and transport 20
of pollution over the Gulf of Mexico and the Pacific: spring 2006 INTEX-B campaign overview and first results, Atmos. Chem. Phys., 9, 2301–2318, 2009,
http://www.atmos-chem-phys.net/9/2301/2009/.
Singh, H. B., Brune, W. H., Crawford, J. H., Jacob, D. J., and Russell, P. B.: Overview of the summer 2004 Intercontinental Chemical Transport Experiment – North America (INTEX-A), 25
J. Geophys. Res., 111, D24S01, doi:10.1029/2006JD007905, 2006.
Strow, L. L., Hannon, S. E., De Souza-Machado, S., Motteler, H. E., and Tobin, D.: An overview of the airs radiative transfer model, IEEE T. Geosci. Remote, 41, 303–313, 2003.
Susskind, J., Barnet, C. D., and Blaisdell, J. M.: Retrieval of atmospheric and surface param-eters from AIRS/AMSU/HSB data in the presence of clouds, IEEE T. Geosci. Remote, 41, 30
390–409, 2003.
ACPD
9, 16331–16360, 2009Information-based methane derived from AIRS and its
validation
X. Xiong et al.
Title Page
Abstract Introduction
Conclusions References
Tables Figures
◭ ◮
◭ ◮
Back Close
Full Screen / Esc
Printer-friendly Version
Interactive Discussion 2006.
Walter, K. M., Smith, L. C., and Chapin III, F. S.: Methane bubbling from northern lakes: present and future contributions to the global methane budget, Philos. T. R. Soc. A, 365, 1856, 1657– 1676, 2007.
Xiong, X., Barnet, C. D., Maddy, E., Sweeney, C., Liu, X., Zhou, L., and Goldberg, M.: Char-5
acterization and Validation of Methane Products from the Atmospheric Infrared Sounder (AIRS), J. Geophys. Res., 113, G00A01, doi:10.1029/2007JG000500, 2008.
Xiong, X., Houweling, S., Wei, J., Maddy, E., Sun, F., and Barnet, C.: Methane plume over south Asia during the monsoon season: satellite observation and model simulation, Atmos. Chem. Phys., 9, 783–794, 2009,
10
http://www.atmos-chem-phys.net/9/783/2009/.
ACPD
9, 16331–16360, 2009Information-based methane derived from AIRS and its
validation
X. Xiong et al.
Title Page
Abstract Introduction
Conclusions References
Tables Figures
◭ ◮
◭ ◮
Back Close
Full Screen / Esc
Printer-friendly Version
Interactive Discussion
ACPD
9, 16331–16360, 2009Information-based methane derived from AIRS and its
validation
X. Xiong et al.
Title Page
Abstract Introduction
Conclusions References
Tables Figures
◭ ◮
◭ ◮
Back Close
Full Screen / Esc
Printer-friendly Version
Interactive Discussion
ACPD
9, 16331–16360, 2009Information-based methane derived from AIRS and its
validation
X. Xiong et al.
Title Page
Abstract Introduction
Conclusions References
Tables Figures
◭ ◮
◭ ◮
Back Close
Full Screen / Esc
Printer-friendly Version
Interactive Discussion
ACPD
9, 16331–16360, 2009Information-based methane derived from AIRS and its
validation
X. Xiong et al.
Title Page
Abstract Introduction
Conclusions References
Tables Figures
◭ ◮
◭ ◮
Back Close
Full Screen / Esc
Printer-friendly Version
Interactive Discussion
ACPD
9, 16331–16360, 2009Information-based methane derived from AIRS and its
validation
X. Xiong et al.
Title Page
Abstract Introduction
Conclusions References
Tables Figures
◭ ◮
◭ ◮
Back Close
Full Screen / Esc
Printer-friendly Version
Interactive Discussion
ACPD
9, 16331–16360, 2009Information-based methane derived from AIRS and its
validation
X. Xiong et al.
Title Page
Abstract Introduction
Conclusions References
Tables Figures
◭ ◮
◭ ◮
Back Close
Full Screen / Esc
Printer-friendly Version
Interactive Discussion
ACPD
9, 16331–16360, 2009Information-based methane derived from AIRS and its
validation
X. Xiong et al.
Title Page
Abstract Introduction
Conclusions References
Tables Figures
◭ ◮
◭ ◮
Back Close
Full Screen / Esc
Printer-friendly Version
Interactive Discussion
ACPD
9, 16331–16360, 2009Information-based methane derived from AIRS and its
validation
X. Xiong et al.
Title Page
Abstract Introduction
Conclusions References
Tables Figures
◭ ◮
◭ ◮
Back Close
Full Screen / Esc
Printer-friendly Version
Interactive Discussion