IJMGE
Int. J. Min. & Geo-Eng.
Vol.49, No.1, June 2015, pp.75-81.
Estimation of metallurgical parameters of flotation process from froth
visual features
Mohammad Massinaei
*Mining Engineering Department, University of Birjand, P.O. Box 97175-376, Birjand, Iran
Received 11 May 2015; Received in revised form 30 May 2015; Accepted 4 June 2015 *
Email address: [email protected] (M. Massinaei), Tel.: +98 56 3220 2133
Abstract
The estimation of metallurgical parameters of flotation process from froth visual features is the ultimate goal of a machine vision based control system. In this study, a batch flotation system was operated under different process conditions and metallurgical parameters and froth image data were determined simultaneously. Algorithms have been developed for measuring textural and physical froth features from the captured images. The correlation between the froth features and metallurgical parameters was successfully modeled, using artificial neural networks. It has been shown that the performance parameters of flotation process can be accurately estimated from the extracted image features, which is of great importance for developing automatic control systems.
Keywords: froth flotation, image analysis, metallurgical parameters, process control.
1. Introduction
Froth flotation is one of the most commonly used mineral separation methods in mineral processing plants [1]. The control of flotation circuits is a difficult task owing to several variables involved along with some unintentional disturbances caused by changes in mineral characteristics and operating conditions [2].
Continuous monitoring of the metallurgical parameters (that is recovery and concentrate grade) is of vital importance for automatic control of flotation plants. The on-line measurement and estimation of these variables usually requires sophisticated and expensive
instrumentation and on-line measurement of these variables requires sophisticated on-stream analyzers which are expensive to purchase and maintain [3, 4].
In this study, a machine vision system was developed and validated to estimate the metallurgical parameters of a batch flotation system at different process conditions from the froth textural and physical features.
2. Data acquisition
Batch flotation tests were conducted on a copper sulfide ore with d80=75 μm in a 2.5 L
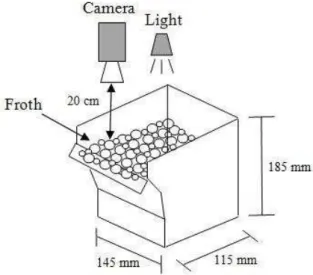
laboratory flotation cell equipped with a video camera and a lighting system, installed above the froth surface (Fig. 1). The camera was mounted on a metal structure at a distance of 20 cm from the froth surface and the lighting was provided by a single 50 W halogen lamp next to the camera.
The flotation experiments were conducted at different process conditions (that is gas flow rate, slurry solids %, frother/ collector dosage and pH) and the metallurgical parameters (that is copper recovery, concentrate copper grade,
mass recovery and water recovery) as well as the froth features (that is textural and physical features) were measured in each test (Table 1).
Fig. 1. Laboratory-scale batch flotation cell and video camera set-up
Table 1. Input and output variables of flotation experiments
Input variables Range Output variables
Gas flow rate (L/min) 5-10-15 Cu recovery (Rcu); Concentrate grade (Gcu); Mass recovery (Rm); Water recovery (Rw);
Slurry solids % 24-28-32 Froth bubble size (Db); Froth velocity (Vf); Froth color
(Cf); Bubble collapse rate (Crb)
Collector dosage (g/t) * 20-30-40
Frother dosage (ppm) ** 5-10-15 Energy (f1), Entropy (f2), Contrast (f3), Homogeneity
(f4), Correlation (f5)
pH 10.8-11.5-12.2
*
Collector: Potassium Amyl Xanthate; ** Frother: Aerofroth 65
The concentrate samples were collected at time intervals of 0.5, 2 and 5 min and analyzed for their water, mass recovery and copper content. The tailings were filtered and dried and their copper content was determined. The video and metallurgical data collected for 2 min were compared at different experiments. Twenty-five (25) frames per second and 3000 frames per each test were captured and analyzed individually and the mean value of each feature was reported for each run [5]. Overall, 81 flotation experiments were conducted at different conditions based on a fractional factorial design obtained with a statistical software.
2. Extraction of textural features
Gray Level Co-occurrence Matrix (GLCM) is a well-established technique for the estimation of second-order joint conditional probability
density functions of the pixel intensity values in the gray level image [10, 19, 20, 21]. In other words, spatial relationships of the pixel intensity in the image can be clearly represented by the GLCM created from the gray level image. The size of GLCM (L×L) is determined based on the number of gray levels of the image (L). Each element of the GLCM (i. e. p (i, j, d, θ)) is computed by counting the number of occurrences of two pixels with pixel intensity of i and jin the image when the distance and angle between two pixels ared and θ, respectively. Actually, a searching process is carried out to determine the number of occurrences of the pixels with gray levels i and j, respectively.
77 information when the distance offset is large. In fact, a pixel is closely related to its nearest pixels.
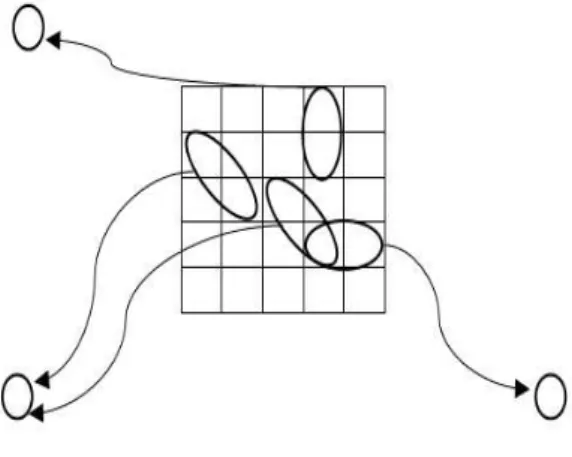
The angle between two pixels (θ) is another central factor which should be considered. Generally, each pixel is surrounded by eight neighboring pixels in different directions (θ= 0°, 45°, 90°, 135°, 180°, 225°, 270°, 315°). However, considering the definition of GLCM, the co-occurring pairs obtained by θ=0° would be similar to those obtained by θ=180° and similarly for θ=45°, 90° and 135°. Hence, is commonly set to four directions 0°, 45°, 90° and 135° [21]. An example of a gray image with its four GLCMs matrices in four directions with d = 1 is shown in Figure 2.
Fig. 2. A paradigm of GLCM.
After GLCM calculation, 14 features can be measured from this matrix. The most important features include energy, entropy, contrast, homogeneity and correlation [19, 20, 21].
(1) Energy
Homogeneity of an image can be measured by energy feature as
2 1,
, i j
f Energy
p i j (1)For an inhomogeneous image, the matrix has a large number of small entries with small energy values and vice versa. Energy values are in the range [0, 1].
(2) Entropy
The complexity or disordering of an image is quantified by entropy feature as
2
,
, log ,
i j
f Entropy
p i j p i j (2)The entropy value is high when the image includes uneven textural units (complex texture). Froth images with a wide range of bubble size, shape and color have high entropy values.
(3) Contrast
Contrast or inertia of an image measures the local variation of pixel intensity or intensity contrast between the pixel of interest and its neighboring pixels as
2 3,
, i j
f Contrast
p i j i j (3)Therefore, an image with large local variations will have a high value of inertia.
(4) Homogeneity
This is a direct measure of the local homogeneity of a digital image that is quantified as
4
,
,
( )
1 i j
p i j
f Homogeneity
i j
(4)Minimum and maximum homogeneity value is zero and one, respectively. Contrast and homogeneity features are highly correlated in an inverse manner.
(5) Correlation
This feature is a measure of the linear correlation between two neighboring pixels as
5
,
,
( i j )
i j i j
p i j i j
f Correlation
(5)where ( i, i) are the mean and standard deviation of the row sums of the matrix and ( i, i) are the mean and standard deviation of the column sums of the matrix.
It should be noted that the textural features were computed for each frame and the average values were reported for each experiment.
Table 2. Correlation matrix between froth textural features
Textural features
1.00 -0.92
-0.36 0.57
*
-0.40
1.00 0.63 -0.80
0.15
1.00 -0.95
-0.66 1.00 0.46 1.00
The correlation matrix between the metallurgical parameters and the froth textural features are listed in Table 3.
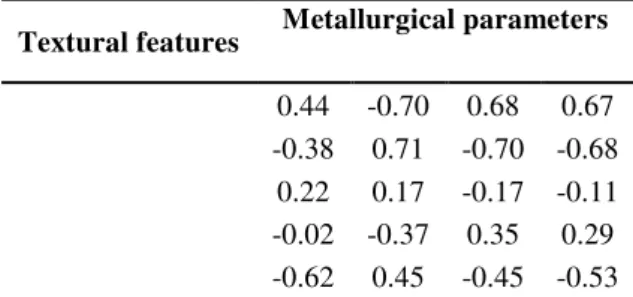
Table 3. Correlation matrix between metallurgical parameters and textural features
Textural features Metallurgical parameters
0.44 -0.70 0.68 0.67 -0.38 0.71 -0.70 -0.68 0.22 0.17 -0.17 -0.11 -0.02 -0.37 0.35 0.29 -0.62 0.45 -0.45 -0.53
As indicated in Table 3, there is a good correlation between energy ( )f1 , entropy (f2) and correlation ( )f5 with performance parameters while the influence of other features such as contrast ( )f3 , and homogeneity (f4) is not statistically significant. Hence, and features were not considered as the modeling variables.
3. Extraction of physical features
The most significant physical features include bubble size distribution, froth color, froth velocity and bubble collapse rate were also extracted from the froth images [18]. The bubble size distribution was measured by a marker-based watershed algorithm. The froth color was quantified through extraction of the red, green and blue (RGB) values from color images (the R channel was chosen because of its maximum correlation with the metallurgical parameters). The block matching algorithm was employed to estimate the froth velocity. The bubble collapse rate was determined from the difference between
reflectance and shadow created at the froth surface, as a result of bubble appearing and disappearing in successive frames, along with the froth velocity information. More details can be found in other studies [18].
The correlation between the metallurgical parameters and the froth physical features is shown in Table 4. The strong correlation between the metallurgical parameters and the froth physical properties indicate that the flotation performance is well reflected in the froth visual features, which is of great importance for control purposes. Among the froth visual features, the bubble collapse rate exhibits the least dependency with the performance factors, hence was excluded from the modeling variables.
Table 4. Correlation matrix between metallurgical parameters and physical features
Physical features Metallurgical parameters
-0.71 0.72 -0.69 -0.71 0.51 -0.76 0.88 0.89 0.48 -0.6 0.62 0.65 -0.23 0.39 -0.43 -0.43
4. Prediction of metallurgical parameters from froth features
The ultimate aim of an on-line machine vision based control system is to estimate the flotation metallurgical parameters from the froth visual features and adjust the process variables accordingly, to achieve optimum separation [3, 8, 11, 12]. In order to achieve these objectives, the correlation between the process performance and image data should be discovered and modeled.
79
Table 5. Input and output variables of neural network models
Input variables
Output
variables Rcu Gcu Rm Rw
Four individual neural networks were developed for predicting the metallurgical parameters via the characteristics of the froth. A simplified structure of the proposed neural network for mass recovery model is presented in Figure 3. It should be pointed out that 70% of data was randomly selected for training, 15% for checking and 15% for testing the network.
Fig. 3. Structure of developed neural network for mass recovery model
Determination of the number of hidden layer neurons is a critical stage in designing a neural network. Excessive neurons employed in the hidden layer may result in over-training and inadequate neurons can lead to insufficient training. In the current study, the optimum number of hidden layers was
determined by trial and error. In other words, the neural network with minimum prediction error was chosen.
The predictive capability of the models was evaluated by the correlation coefficient (R) and the root mean square error (RMSE) was calculated from the following expression:
2 2
2
2
n yy y y
R
n y y n y y
(6)
2 1/ 21
RMSE y y
n
(7)where y and are the measured and predicted values, respectively, and is the number of data element.
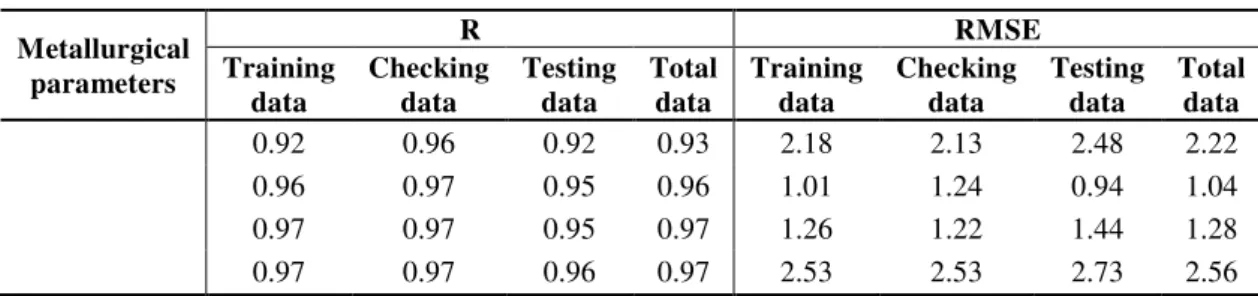
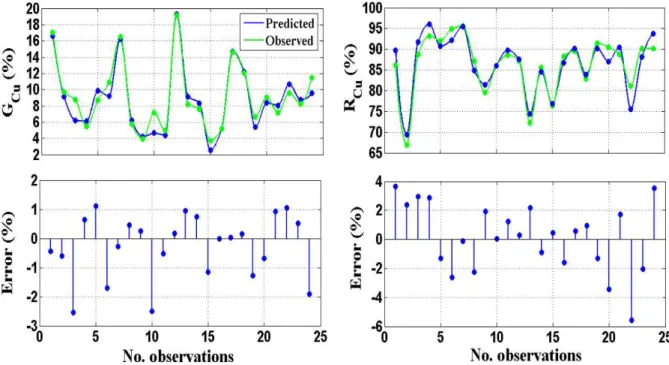
The prediction accuracy of the neural network models for estimating the flotation metallurgical parameters are presented in Table 6. The prediction error of the models on testing data is also shown in Figures 4 and 5.
The results show that the developed models can effectively simulate the correlation between the froth features and the metallurgical parameters. Furthermore, it seems that the prediction accuracy of the existing models (by textural and physical features) have slightly improved compared with the previously developed models (by only physical features) [18].
Thus, the performance parameters can be accurately predicted from the froth visual features and used as inputs to a feedback control system. This control system will manipulate the process variables in a predetermined order proportional to the deviation of the estimated performance parameters from the set points.
Table 6. Performance evaluation of developed neural network models
Metallurgical parameters
R RMSE
Training data
Checking data
Testing data
Total data
Training data
Checking data
Testing data
Total data
0.92 0.96 0.92 0.93 2.18 2.13 2.48 2.22
0.96 0.97 0.95 0.96 1.01 1.24 0.94 1.04
0.97 0.97 0.95 0.97 1.26 1.22 1.44 1.28
Fig. 4. Prediction error of concentrate grade and recovery models (testing data)
Fig. 5. Prediction error of mass recovery (Rm) and water recovery (Rw) models (testing data)
5. Conclusion
In this research work a machine vision was developed to predict the metallurgical parameters of a batch flotation system from the textural and physical features extracted from the froth images. For that purpose, a laboratory flotation cell was operated at different process conditions and the froth surface was filmed. The captured images were
81
References
[1] Wills, B.A., Napier-Munn, T.J. (2006). Mineral Processing Technology. Elsevier Science & Technology Books.
[2] Cubillos, F.A., Lima, E.L. (1997). Identification and optimizing control of rougher flotation circuit using an adaptable hybrid-neural model. Minerals Engineering, 10 (7), 707-721.
[3] Holtham P.N., Nguyen, L.K. (2002). On-line analysis of froth surface in coal and mineral flotation using JKFrothCam, International Journal of Mineral Processing, 64, 163-180. [4] Haavisto, O., Kaartinen, J. (2009).
Multichannel reflectance spectral assaying of zinc and copper flotation slurries. International Journal of Mineral Processing, 93 (2), 187-193.
[5] Moolman, D.M., Aldrich, C. and Van Deventer, J.S.J. (1995). The interpretation of flotation froth surfaces by using digital image analysis and neural networks. Chemical Engineering Science, 50, 3501-3513.
[6] Moolman, D.W., Eksteen, J.J., Aldrich, C. and Van Deventer, J.S.J. (1996a). The significance of flotation froth appearance for machine vision control. International Journal of Mineral Processing, 48(3-4), 135-158.
[7] Moolman, D.W., Aldrich, C., Schmitz, G.P.J. and Van Deventer, J.S.J. (1996b). The interrelationship between surface froth characteristics and industrial flotation performance. Minerals Engineering, 9 (8), 837-854.
[8] Kaartinen, J., Hatonen, J., Hyotyniemi, H. and Miettunen, J. (2006). Machine vision based control of zinc flotation-A case study. Control Engineering Practice, 14, 1455-1466.
[9] Vanegas, C. and Holtham, P. (2008). On-line froth acoustic emission measurements in industrial sites. Minerals Engineering, 21, 883-888.
[10] Aldrich, C., Marais, C., Shean, B.J. and Cilliers, J.J. (2010). On-line monitoring and control of froth flotation systems with machine vision: A review. International Journal of Mineral Processing, 96, 1-13.
[11] Morar, S.H., Harris, M.C. and Bradshaw, D.J. (2012). The use of machine vision to predict
flotation performance. Minerals Engineering, 36-38, 31-36.
[12] Mehrabi, A., Mehrshad, N., Massinaei, M. (2014). Machine vision based monitoring of an industrial flotation cell in an iron flotation plant. International Journal of Mineral Processing, 133, 60-66.
[13] Aldrich, C., Moolman, D.W., Bunkell S.-J., Harris, M.C. and Theron, D.A. (1997). Relationship between surface froth features and process conditions in the batch flotation of a sulphide ore. Minerals Engineering, 10 (11), 1207-1218.
[14] Banford, A., Aktas, Z., Woodburn, E. (1998). Interpretation of the effect of froth structure on the performance of froth flotation using image analysis. Powder Technology, 98, 61-73. [15] Bonifazi, G., Massacci, P. and Meloni, A.
(2000). Prediction of complex sulfide flotation performances by a combined 3D fractal and colour analysis of the froths. Minerals Engineering, 13 (7), 737-746, 2000.
[16] Hargrave, J., Hall, S. (1997). Diagnosis of concentrate grade and mass flowrate in tin flotation from colour and surface texture analysis. Minerals Engineering, 10, 613-621. [17] Hargrave, J., Miles, N., Hall, S. (1996). The
use of grey level measurement in predicting coal flotation performance. Minerals Engineering, 9, 667-674.
[18] Jahedsaravani, A., Marhaban, M.H., Massinaei, M. (2014). Prediction of the metallurgical performances of a batch flotation system by image analysis and neural networks, Minerals Engineering, 69, 137-145.
[19] Gadkari, D. (2004). Image Quality Analysis Using GLCM. MSc. Thesis in Modeling and Simulation in the College of Arts and Sciences, University of Central Florida, Orlando, Florida.
[20] Marais, C., Aldrich, C. (2011). Estimation of platinum flotation grades from froth image data. Minerals Engineering, 24, 433-441. [21] Gui, W., Liu, J., Yang, C., Chen, N., Liao, X.