Pacific Rocky Intertidal Community
Ryan P. Kelly*, Stephen R. Palumbi
Department of Biology, Hopkins Marine Station, Stanford University, Pacific Grove, California, United States of America
Abstract
Comparing many species’ population genetic patterns across the same seascape can identify species with different levels of structure, and suggest hypotheses about the processes that cause such variation for species in the same ecosystem. This comparative approach helps focus on geographic barriers and selective or demographic processes that define genetic connectivity on an ecosystem scale, the understanding of which is particularly important for large-scale management efforts. Moreover, a multispecies dataset has great statistical advantages over single-species studies, lending explanatory power in an effort to uncover the mechanisms driving population structure. Here, we analyze a 50-species dataset of Pacific nearshore invertebrates with the aim of discovering the most influential structuring factors along the Pacific coast of North America. We collected cytochromecoxidase I (COI) mtDNA data from populations of 34 species of marine invertebrates sampled coarsely at four coastal locations in California, Oregon, and Alaska, and added published data from 16 additional species. All nine species with non-pelagic development have strong genetic structure. For the 41 species with pelagic development, 13 show significant genetic differentiation, nine of which show striking FSTlevels of 0.1–0.6. Finer scale geographic investigations show unexpected regional patterns of genetic change near Cape Mendocino in northern California for five of the six species tested. The region between Oregon and Alaska is a second focus of intraspecific genetic change, showing differentiation in half the species tested. Across regions, strong genetic subdivision occurs more often than expected in mid-to-high intertidal species, a result that may reflect reduced gene flow due to natural selection along coastal environmental gradients. Finally, the results highlight the importance of making primary research accessible to policymakers, as unexpected barriers to marine dispersal break the coast into separate demographic zones that may require their own management plans.
Citation:Kelly RP, Palumbi SR (2010) Genetic Structure Among 50 Species of the Northeastern Pacific Rocky Intertidal Community. PLoS ONE 5(1): e8594. doi:10.1371/journal.pone.0008594
Editor:Stuart A. Sandin, University of California San Diego, United States of America
ReceivedAugust 3, 2009;AcceptedDecember 7, 2009;PublishedJanuary 7, 2010
Copyright:ß2010 Kelly, Palumbi. This is an open-access article distributed under the terms of the Creative Commons Attribution License, which permits unrestricted use, distribution, and reproduction in any medium, provided the original author and source are credited.
Funding:Partnership for Interdisciplinary Studies of Coastal Oceans (PISCO) and the Andrew W. Mellon Foundation (to S.R.P.). The funders had no role in study design, data collection and analysis, decision to publish, or preparation of the manuscript.
Competing Interests:The authors have declared that no competing interests exist.
* E-mail: [email protected]
Introduction
Uncovering mechanisms that determine gene flow is critical for understanding population ecology, the scale of natural selection across environmental gradients, and decisions about sustainable exploitation. This is especially true where conservation strategies emphasize the creation of management zones such as wildlife parks or marine protected areas [see 1]. The genetics of species across these management mosaics have long been a part of conservation biology and molecular ecology [2]. Recent emphasis, especially in the sea, on ecosystem-based management as a main goal for sustainable use of natural areas [3,4] indicates that knowing the population structure of single species is no longer enough. Instead, understanding the population genetic patterns and the processes that create them for a wide set of species within a habitat has become an important part of the goal [5].
Such data are particularly relevant in marine ecosystems because of the possibility that many species have wide dispersal [6], and the increasing focus on marine protected areas as a management strategy [1]. Because these areas are usually too small to contain self-seeding populations of most high dispersal marine species [7], networks of protected areas connected by dispersal are often required [8,9,10]. Planktonic duration of dispersing larvae is
often used as a proxy for dispersal potential [see, e.g., 10] and is used in management decisions about marine resources. Compar-ing population genetic patterns across the same seascape for many species can allow initial identification of species with different levels of structure, and test hypotheses about the processes that create dispersal variation for species in the same ecosystem.
Uncovering common causes of genetic subdivision across a shared landscape requires a synthesis of both genetic and ecological information from a diverse array of species [11]. Recent efforts have focused on fine scale landscape or seascape genetic tests of the importance of geographic features in determining gene flow patterns [see 12]. However, it is not necessarily the case that all species, even with similar life histories, will react the same way to the same geography. Landscape or seascape genetic studies, if conducted for many species in a controlled way with similar genetic tools, can have the statistical power to detect the impact of particular geographic features or life history traits on genetic structure.
brooding or viviparous species, or those with demersal egg sacs and no subsequent dispersal stage) tend be highly subdivided, suggesting very low gene flow among these populations [8]. This result has been often generalized to suggest that longer pelagic durations will have greater gene flow. Longer pelagic development is expected to result in greater dispersal, lower genetic differen-tiation and better-connected populations [18,19]. However, some striking exceptions have been well studied, such as the tide pool copepod Tigriopus californicus that has remarkably short scale population structure [20], and a suite of Caribbean marine fish for which larval duration explains little of the variation in mtDNA differentiation [21]. As a result, there remains a large and unexplained variability in levels of genetic structure among ecologically similar, pelagically-dispersing invertebrate species [16,17,22]
In some cases, genetic differentiation appears ruled by major biogeographic breaks rather than larval biology [23,24]. However, not all biogeographic breaks are associated with strong genetic differentiation [25]. The strong biogeographic break in California at Pt. Conception, for example, is home to a few well-known shifts in marine population genetics [26,27], but many species show little or no divergence in the region [see 25,28,29].
Here, we present original mtDNA data from 34 invertebrate species from the nearshore environment of the Pacific coast of North America. Combining this dataset with published data for 16 additional species across the same geographic area, we use a multiple lineage regression and ANOVA framework to ask whether levels of genetic differentiation vary significantly with pelagic duration and presence of biogeographic barriers. We find that, consistent with earlier work, species without pelagic larval dispersal have significantly more subdivision among populations. However our analysis of the relationship between genetic structure and a suite of species and habitat traits shows that increased pelagic duration has little power to explain genetic subdivision. Instead, significant variation in genetic structure among these 50 species is explained by adult habitat depth, with high-to-mid intertidal species of many taxonomic lineages showing strong genetic structure. In addition, we find that the upwelling center of Cape Mendocino, historically neglected by genetic sampling, houses a number of interesting genetic shifts even for high dispersal species.
Results
Genetic Structure among species
We sampled 34 nearshore invertebrate species across four locations on the Pacific coast of North America (Sitka, Alaska; Cape Blanco, Oregon; Monterey, California, and Santa Barbara, California), and added data from 16 species for which published data were available. Of these 16, 12 used COI data (Table 1). Forty-nine of 50 species (all but the sea anemoneA. elegantissima) showed intraspecific variation in COI sequence. Across this set, all nine species with non-pelagic development showed significant genetic structure (mean WST= 0.53, range = 0.2–1.0, Table 2, and
Supplementary Information). We included the harpactacoid tide-pool copepod Tigriopus californicusin this list because of its largely benthic habits. Among 41 species with pelagic larvae, we found genetic differentiation in 13 (32%). There was strong structure (WST= 0.11 – 0.6; p,0.001) in nine species, and moderate structure
(WST0.02 – 0.10; p,0.05) in four more (Figure 1).
Geography of genetic structure
A greater proportion of species had significant mtDNA differences in the northern and central regions than in the south.
Between Oregon and Sitka, Alaska 33% of species showed structure (Figure 1). Between Monterey and Oregon, 40% showed mtDNA differentiation. By contrast, only 15% of species sampled between Monterey and Santa Barbara had genetic differentiation, and this was not strong for any of the species we sampled (Figure 1). Central comparisons have a greater fraction of high, moderate and mildly differentiated species than do southern comparisons, and the northern comparisons have the highest fraction of species with strong genetic structure (Figure 1). These results were uncorrelated with the geographic distance between neighboring sampled populations. Normalizing FST values for different geographic
distances between sampling sites did not appreciably change their distribution.
Not every species occurs at each sampling site, resulting in a dataset with irregular sampling: only four species, for example, occur at all four sampling sites. However, the observed geographic trends are qualitatively evident in subsets of the data (species sampled at only two locations, for example, have a higher mean pairwise FSTbetween Monterey and Oregon (0.0366; n = 3 spp)
than between Santa Barbara and Monterey (2.0028; n = 11 spp). For six species that showed significant mtDNA differentiation across the central range (Balanus glandula, Pagurus granosimanus, P. hirsutiusculus, Lottia digitalis, Pollicipes polymerus, and Hemigrapsus nudus), we sampled intermediate locations to further determine the geographic pattern of genetic shifts. In five of six cases, Cape Mendocino emerges as an important phylogenetic feature, though several different patterns emerged for different species (Figure 2). The limpet L. digitalis and the barnacle B. glandula show broad genetic clines from Monterey to Cape Mendocino [see also 30], with strong isolation-by-distance signatures along the central California coast. For the hermit crabsPagurus hirsutiusculusandP. granosimanus, populations in Monterey are genetically similar to those in northern California, but are differentiated from populations to the north of Cape Mendocino. ForP. hirsutiusculus, this differentiation occurs abruptly between collections made in the Sinkyone Wilderness and at Patrick’s Point (Figure 2). Among populations of the shore crabHemigrapsus nudus, Sitka populations were the most differentiated. However, Oregon populations show a mtDNA haplotype shared with Alaska but not California, and populations are differentiated across Cape Mendocino. By contrast, the gooseneck barnaclePollicipes polymerusis the only of these species that does not show genetic differentiation across Cape Mendocino. Current data show mild differentiation only of the Monterey population from others in the data set.
Isolation-by-distance patterns along the central coast of California are significant in three of six species (Mantel tests, Figure 2) - further sampling may reveal significant patterns in two others. Slopes ranged from 661025km21 to 1.461023km21, a 20-fold range that indicates substantial difference in effective migration rate. The highest slopes were seen inLottia digitalis, a limpet with larvae that spend only 5–10 days in the pelagic phase. However, the slope of the line for the hermit crabP. hirsutiusculusis only two-fold less, even though this species has a pelagic period lasting 60 days or more. Though more data on multiple loci are needed to provide a high resolution view of gene flow, these comparisons suggest that larval period is not the dominant structuring agent in these species.
Correlates of genetic structure
In the whole data set, larval pelagic period was strongly associated with WST values (p = 0.011), but this correlation
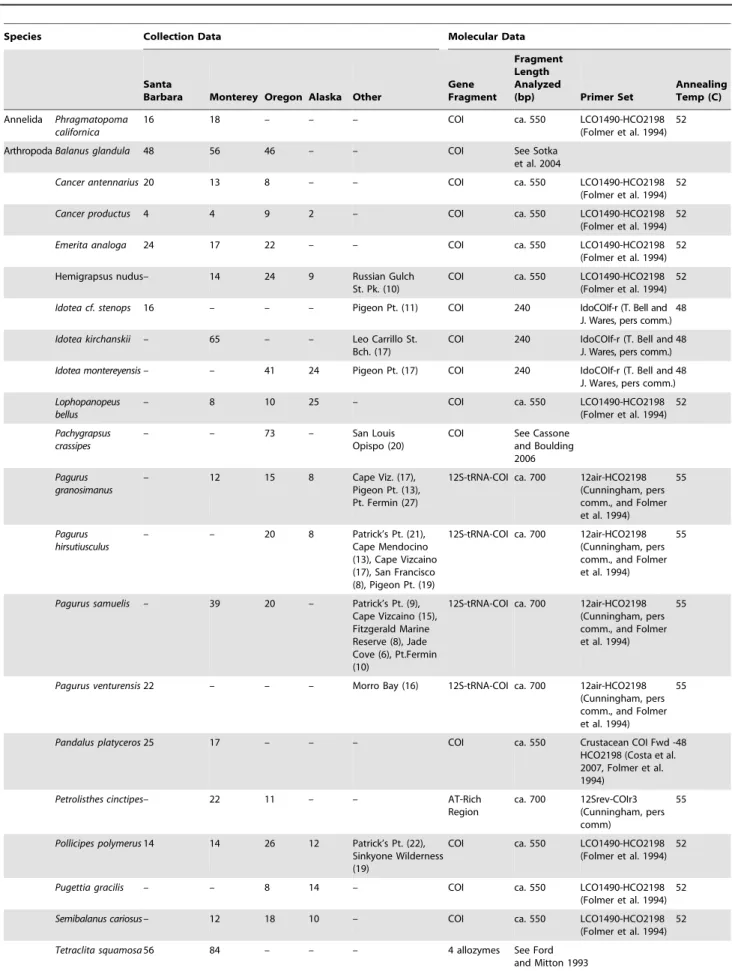
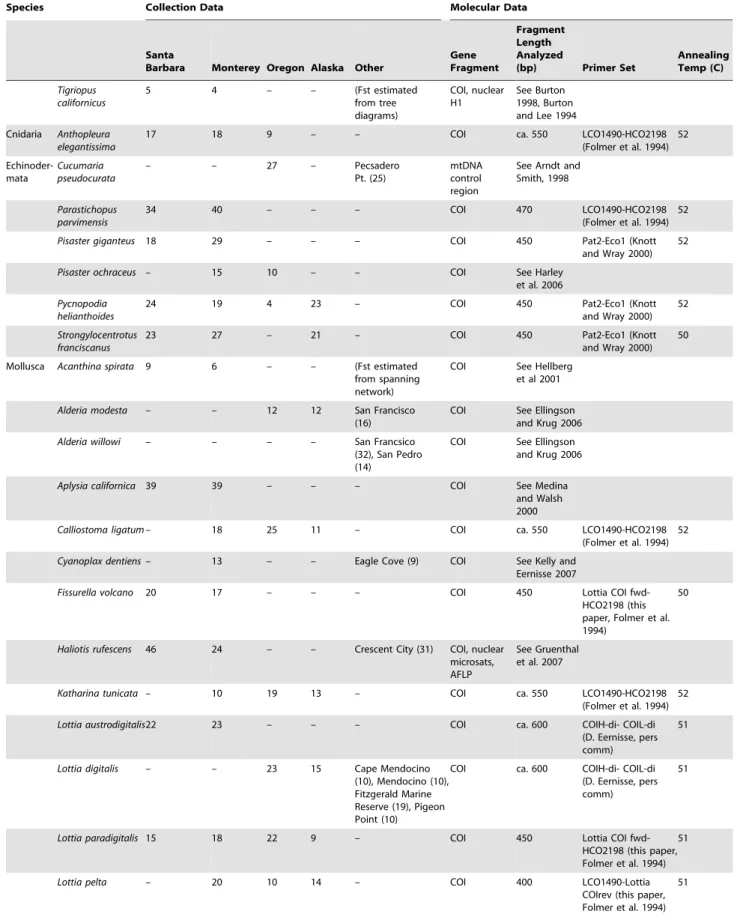
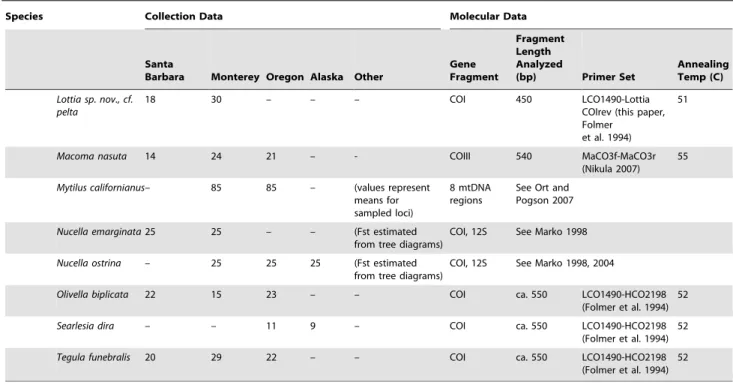
Table 1.Species, collection locations, and gene fragment information.
Species Collection Data Molecular Data
Santa
Barbara Monterey Oregon Alaska Other
Gene Fragment
Fragment Length Analyzed
(bp) Primer Set
Annealing Temp (C)
Annelida Phragmatopoma californica
16 18 – – – COI ca. 550 LCO1490-HCO2198
(Folmer et al. 1994) 52
ArthropodaBalanus glandula 48 56 46 – – COI See Sotka
et al. 2004
Cancer antennarius20 13 8 – – COI ca. 550 LCO1490-HCO2198
(Folmer et al. 1994) 52
Cancer productus 4 4 9 2 – COI ca. 550 LCO1490-HCO2198
(Folmer et al. 1994) 52
Emerita analoga 24 17 22 – – COI ca. 550 LCO1490-HCO2198
(Folmer et al. 1994) 52
Hemigrapsus nudus– 14 24 9 Russian Gulch
St. Pk. (10)
COI ca. 550 LCO1490-HCO2198 (Folmer et al. 1994)
52
Idotea cf. stenops 16 – – – Pigeon Pt. (11) COI 240 IdoCOIf-r (T. Bell and
J. Wares, pers comm.) 48
Idotea kirchanskii – 65 – – Leo Carrillo St.
Bch. (17)
COI 240 IdoCOIf-r (T. Bell and J. Wares, pers comm.)
48
Idotea montereyensis– – 41 24 Pigeon Pt. (17) COI 240 IdoCOIf-r (T. Bell and
J. Wares, pers comm.) 48
Lophopanopeus bellus
– 8 10 25 – COI ca. 550 LCO1490-HCO2198
(Folmer et al. 1994) 52
Pachygrapsus crassipes
– – 73 – San Louis
Opispo (20)
COI See Cassone and Boulding 2006
Pagurus granosimanus
– 12 15 8 Cape Viz. (17),
Pigeon Pt. (13), Pt. Fermin (27)
12S-tRNA-COI ca. 700 12air-HCO2198 (Cunningham, pers comm., and Folmer et al. 1994)
55
Pagurus hirsutiusculus
– – 20 8 Patrick’s Pt. (21),
Cape Mendocino (13), Cape Vizcaino (17), San Francisco (8), Pigeon Pt. (19)
12S-tRNA-COI ca. 700 12air-HCO2198 (Cunningham, pers comm., and Folmer et al. 1994)
55
Pagurus samuelis – 39 20 – Patrick’s Pt. (9),
Cape Vizcaino (15), Fitzgerald Marine Reserve (8), Jade Cove (6), Pt.Fermin (10)
12S-tRNA-COI ca. 700 12air-HCO2198 (Cunningham, pers comm., and Folmer et al. 1994)
55
Pagurus venturensis22 – – – Morro Bay (16) 12S-tRNA-COI ca. 700 12air-HCO2198
(Cunningham, pers comm., and Folmer et al. 1994)
55
Pandalus platyceros25 17 – – – COI ca. 550 Crustacean COI Fwd
-HCO2198 (Costa et al. 2007, Folmer et al. 1994)
48
Petrolisthes cinctipes– 22 11 – – AT-Rich
Region
ca. 700 12Srev-COIr3 (Cunningham, pers comm)
55
Pollicipes polymerus14 14 26 12 Patrick’s Pt. (22),
Sinkyone Wilderness (19)
COI ca. 550 LCO1490-HCO2198 (Folmer et al. 1994)
52
Pugettia gracilis – – 8 14 – COI ca. 550 LCO1490-HCO2198
(Folmer et al. 1994) 52
Semibalanus cariosus– 12 18 10 – COI ca. 550 LCO1490-HCO2198
(Folmer et al. 1994) 52
Tetraclita squamosa56 84 – – – 4 allozymes See Ford
Species Collection Data Molecular Data
Santa
Barbara Monterey Oregon Alaska Other
Gene Fragment
Fragment Length Analyzed
(bp) Primer Set
Annealing Temp (C)
Tigriopus californicus
5 4 – – (Fst estimated
from tree diagrams)
COI, nuclear H1
See Burton 1998, Burton and Lee 1994
Cnidaria Anthopleura elegantissima
17 18 9 – – COI ca. 550 LCO1490-HCO2198
(Folmer et al. 1994) 52
Echinoder-mata
Cucumaria pseudocurata
– – 27 – Pecsadero
Pt. (25)
mtDNA control region
See Arndt and Smith, 1998
Parastichopus parvimensis
34 40 – – – COI 470 LCO1490-HCO2198
(Folmer et al. 1994) 52
Pisaster giganteus 18 29 – – – COI 450 Pat2-Eco1 (Knott
and Wray 2000) 52
Pisaster ochraceus – 15 10 – – COI See Harley
et al. 2006
Pycnopodia helianthoides
24 19 4 23 – COI 450 Pat2-Eco1 (Knott
and Wray 2000) 52
Strongylocentrotus franciscanus
23 27 – 21 – COI 450 Pat2-Eco1 (Knott
and Wray 2000) 50
Mollusca Acanthina spirata 9 6 – – (Fst estimated
from spanning network)
COI See Hellberg et al 2001
Alderia modesta – – 12 12 San Francisco
(16)
COI See Ellingson and Krug 2006
Alderia willowi – – – – San Francsico
(32), San Pedro (14)
COI See Ellingson and Krug 2006
Aplysia californica 39 39 – – – COI See Medina
and Walsh 2000
Calliostoma ligatum– 18 25 11 – COI ca. 550 LCO1490-HCO2198
(Folmer et al. 1994) 52
Cyanoplax dentiens– 13 – – Eagle Cove (9) COI See Kelly and
Eernisse 2007
Fissurella volcano 20 17 – – – COI 450 Lottia COI
fwd-HCO2198 (this paper, Folmer et al. 1994)
50
Haliotis rufescens 46 24 – – Crescent City (31) COI, nuclear
microsats, AFLP
See Gruenthal et al. 2007
Katharina tunicata – 10 19 13 – COI ca. 550 LCO1490-HCO2198
(Folmer et al. 1994) 52
Lottia austrodigitalis22 23 – – – COI ca. 600 COIH-di- COIL-di
(D. Eernisse, pers comm)
51
Lottia digitalis – – 23 15 Cape Mendocino
(10), Mendocino (10), Fitzgerald Marine Reserve (19), Pigeon Point (10)
COI ca. 600 COIH-di- COIL-di (D. Eernisse, pers comm)
51
Lottia paradigitalis 15 18 22 9 – COI 450 Lottia COI
fwd-HCO2198 (this paper, Folmer et al. 1994)
51
Lottia pelta – 20 10 14 – COI 400 LCO1490-Lottia
COIrev (this paper, Folmer et al. 1994)
pelagic durations of 50–67 days were associated withWST values
as high as 0.1 – 0.36 (Table 1).
We examined further potential correlates of genetic structure with a multiple linear regression that includedWSTand pairwise population
FST as the dependent variables and 22 ecological, habitat, and
molecular traits as possible independent variables (Table 2, and Supplementary Information). The strongest result was significant differentiation among habitat depth categories (ANOVA, R2= 0.24; p = 0.02), with species occurring higher in the intertidal zone being significantly more subdivided than those at lower depths (Figure 4). This trend was robust to additional partitioning of habitat depth into different numbers of categories (four or seven), coded as either numeric or categorical variables (as shown in Figure 4). Strong taxonomic biases are present in the dataset as a result of nonrandom species sampling and the availability of data (see Table 2, and Supplementary Information). However the inverse relationship between genetic structure and habitat depth is not a product of taxonomic sampling bias. Subsampling the dataset to include a single species from either each taxonomic family (n=28) or each order (n = 15) demonstrated a high degree of phylogenetic independence, with the trend remaining significant in 91% (family) or 86% (order) of the subsampled dataset replicates. Neither nucleotide diversity nor Tajima’s D meaningfully correlated withWST, or with any pairwise FSTcalculation between sites.
Discussion
About one in three sampled west coast invertebrate species with pelagic larvae shows genetic differentiation between southern California and Alaska. Comparison of similar data sets among
many species in a similar geographic context allows tests of hypotheses about the factors associated with genetic structure and low gene flow. Our results highlight a little-studied area of the U.S. west coast as an important dispersal barrier and suggests a role for adult habitat in genetic differentiation.
Despite its importance as a site of environmental change and faunal turnover, we found little population genetic structure across Point Conception between Monterey and Santa Barbara. Genetic change in invertebrate species with pelagic larvae has been reported across Point Conception [25,27,29], and we add four invertebrate species to this list. Likewise, Sivasundar and Palumbi (submitted) in a meta-analysis of population structure of 15 species of west coast Sebastes rockfish report differentiation of five species at Point Conception. Yet, strong structure in these cases is rare [25,27] except for estuarine species [29] or species with low dispersal potential. Rather, upwelling relaxation and El Nin˜o events may transport pelagic larvae northward around Point Conception with some regularity [31,32], while the California current may successfully carry northern larvae southward [27]. Such bi-directional gene flow likely prevents large scale genetic differentiation in many taxa.
A larger fraction of populations are differentiated across Cape Mendocino in northern California, and between Oregon and Alaska. For northern comparisons, our data cannot pinpoint the area of genetic change between Oregon and Sitka Alaska. However, there is a major bifurcation in oceanic currents near the entrance to Puget Sound, with some flow moving northward, and some forming the California Current heading south. This major current shift has been suggested to be responsible for genetic differences in a number of fish
Species Collection Data Molecular Data
Santa
Barbara Monterey Oregon Alaska Other
Gene Fragment
Fragment Length Analyzed
(bp) Primer Set
Annealing Temp (C)
Lottia sp. nov., cf. pelta
18 30 – – – COI 450 LCO1490-Lottia
COIrev (this paper, Folmer
et al. 1994)
51
Macoma nasuta 14 24 21 – - COIII 540 MaCO3f-MaCO3r
(Nikula 2007) 55
Mytilus californianus– 85 85 – (values represent
means for sampled loci)
8 mtDNA regions
See Ort and Pogson 2007
Nucella emarginata25 25 – – (Fst estimated
from tree diagrams)
COI, 12S See Marko 1998
Nucella ostrina – 25 25 25 (Fst estimated
from tree diagrams)
COI, 12S See Marko 1998, 2004
Olivella biplicata 22 15 23 – – COI ca. 550 LCO1490-HCO2198
(Folmer et al. 1994) 52
Searlesia dira – – 11 9 – COI ca. 550 LCO1490-HCO2198
(Folmer et al. 1994) 52
Tegula funebralis 20 29 22 – – COI ca. 550 LCO1490-HCO2198
(Folmer et al. 1994) 52
The numbers of individuals collected for each species at each focal collection location (Sitka, Cape Blanco, Monterey, Santa Barbara; see text) are shown, along with collections made at alternative locations or for supplementary population-level analysis. We designed two novel primers to amplify and sequence cytochromecoxidase, subunit I (COI) in limpets; their sequences were as follows (59– 39): Lottia COI fwd: TTTATAGTNATGCCAGTATTAATTGG; Lottia COI rev: CTAGCGAARATNGAAGCAATTCC. Unpublished primers were provided courtesy of C. Cunningham (Duke University), T. Bell and J. Wares (University of Georgia), and D. Eernisse (California State University, Fullerton) as noted; published primer sources are cited. In most cases, the COI fragment was used for analysis; in some species amplification of this fragment was problematic due to the presence of pseudogenes or other complications. In these cases, we amplified a fragment that spanned one or more gene boundaries, resulting in a single fragment. DNA sequence data are available online in Genbank.
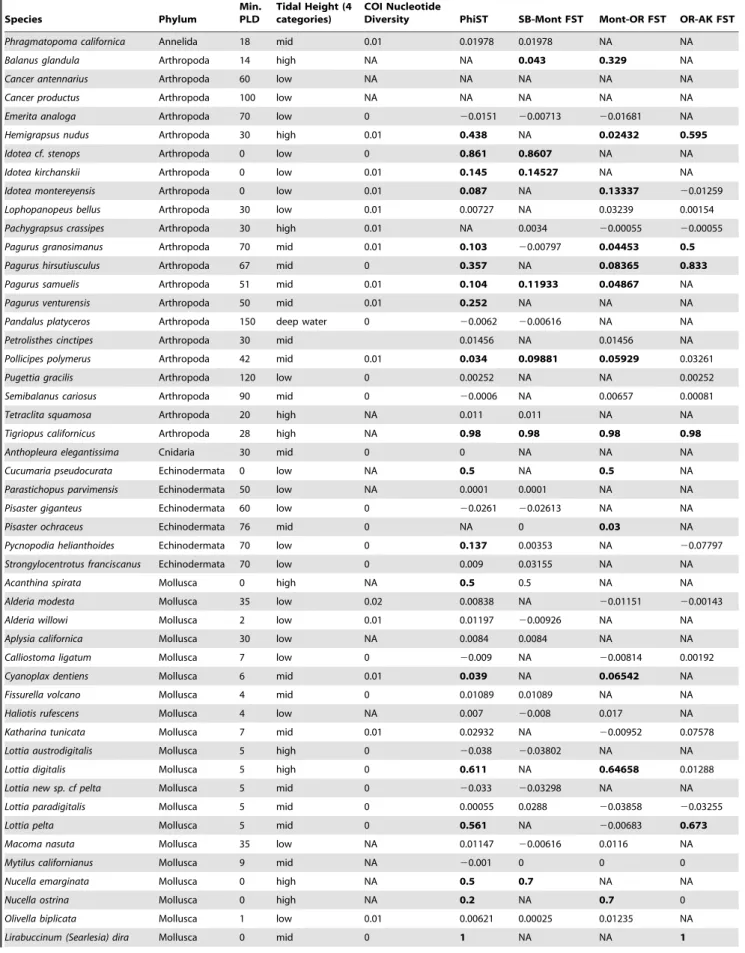
Table 2.A partial list of ecological and life history information used for analysis.
Species Phylum
Min. PLD
Tidal Height (4 categories)
COI Nucleotide
Diversity PhiST SB-Mont FST Mont-OR FST OR-AK FST
Phragmatopoma californica Annelida 18 mid 0.01 0.01978 0.01978 NA NA
Balanus glandula Arthropoda 14 high NA NA 0.043 0.329 NA
Cancer antennarius Arthropoda 60 low NA NA NA NA NA
Cancer productus Arthropoda 100 low NA NA NA NA NA
Emerita analoga Arthropoda 70 low 0 20.0151 20.00713 20.01681 NA
Hemigrapsus nudus Arthropoda 30 high 0.01 0.438 NA 0.02432 0.595
Idotea cf. stenops Arthropoda 0 low 0 0.861 0.8607 NA NA
Idotea kirchanskii Arthropoda 0 low 0.01 0.145 0.14527 NA NA
Idotea montereyensis Arthropoda 0 low 0.01 0.087 NA 0.13337 20.01259
Lophopanopeus bellus Arthropoda 30 low 0.01 0.00727 NA 0.03239 0.00154
Pachygrapsus crassipes Arthropoda 30 high 0.01 NA 0.0034 20.00055 20.00055
Pagurus granosimanus Arthropoda 70 mid 0.01 0.103 20.00797 0.04453 0.5
Pagurus hirsutiusculus Arthropoda 67 mid 0 0.357 NA 0.08365 0.833
Pagurus samuelis Arthropoda 51 mid 0.01 0.104 0.11933 0.04867 NA
Pagurus venturensis Arthropoda 50 mid 0.01 0.252 NA NA NA
Pandalus platyceros Arthropoda 150 deep water 0 20.0062 20.00616 NA NA
Petrolisthes cinctipes Arthropoda 30 mid 0.01456 NA 0.01456 NA
Pollicipes polymerus Arthropoda 42 mid 0.01 0.034 0.09881 0.05929 0.03261
Pugettia gracilis Arthropoda 120 low 0 0.00252 NA NA 0.00252
Semibalanus cariosus Arthropoda 90 mid 0 20.0006 NA 0.00657 0.00081
Tetraclita squamosa Arthropoda 20 high NA 0.011 0.011 NA NA
Tigriopus californicus Arthropoda 28 high NA 0.98 0.98 0.98 0.98
Anthopleura elegantissima Cnidaria 30 mid 0 0 NA NA NA
Cucumaria pseudocurata Echinodermata 0 low NA 0.5 NA 0.5 NA
Parastichopus parvimensis Echinodermata 50 low NA 0.0001 0.0001 NA NA
Pisaster giganteus Echinodermata 60 low 0 20.0261 20.02613 NA NA
Pisaster ochraceus Echinodermata 76 mid 0 NA 0 0.03 NA
Pycnopodia helianthoides Echinodermata 70 low 0 0.137 0.00353 NA 20.07797
Strongylocentrotus franciscanus Echinodermata 70 low 0 0.009 0.03155 NA NA
Acanthina spirata Mollusca 0 high NA 0.5 0.5 NA NA
Alderia modesta Mollusca 35 low 0.02 0.00838 NA 20.01151 20.00143
Alderia willowi Mollusca 2 low 0.01 0.01197 20.00926 NA NA
Aplysia californica Mollusca 30 low NA 0.0084 0.0084 NA NA
Calliostoma ligatum Mollusca 7 low 0 20.009 NA 20.00814 0.00192
Cyanoplax dentiens Mollusca 6 mid 0.01 0.039 NA 0.06542 NA
Fissurella volcano Mollusca 4 mid 0 0.01089 0.01089 NA NA
Haliotis rufescens Mollusca 4 low NA 0.007 20.008 0.017 NA
Katharina tunicata Mollusca 7 mid 0.01 0.02932 NA 20.00952 0.07578
Lottia austrodigitalis Mollusca 5 high 0 20.038 20.03802 NA NA
Lottia digitalis Mollusca 5 high 0 0.611 NA 0.64658 0.01288
Lottia new sp. cf pelta Mollusca 5 mid 0 20.033 20.03298 NA NA
Lottia paradigitalis Mollusca 5 mid 0 0.00055 0.0288 20.03858 20.03255
Lottia pelta Mollusca 5 mid 0 0.561 NA 20.00683 0.673
Macoma nasuta Mollusca 35 low NA 0.01147 20.00616 0.0116 NA
Mytilus californianus Mollusca 9 mid NA 20.001 0 0 0
Nucella emarginata Mollusca 0 high NA 0.5 0.7 NA NA
Nucella ostrina Mollusca 0 high NA 0.2 NA 0.7 0
Olivella biplicata Mollusca 1 low 0.01 0.00621 0.00025 0.01235 NA
and invertebrate species [e.g., 33]. We found reciprocally monophy-letic mtDNA clades or dramatic haplotype frequency differences in several species across the region (including Lottia pelta, Hemigrapsus nudus, Pagurus hirsutiusculus, P. granosimanus, and Searlesia dira); the resulting FSTvalues were much higher in the northern region than
elsewhere for the same species. These dramatic differences are in marked contrast to the mild differences at Point Conception, and
could be the focus of future study. It may be that clade-level differences in the north, as opposed to mere allele frequency differences, are primarily driven by glacial cycling [16].
Cape Mendocino as a barrier
Our data provide a finer look at the potential for genetic differentiation at Cape Mendocino. Among six species, five show
Species Phylum
Min. PLD
Tidal Height (4 categories)
COI Nucleotide
Diversity PhiST SB-Mont FST Mont-OR FST OR-AK FST
Tegula (Chlorostoma) funebralis Mollusca 5 mid 0.01 0.01674 20.00047 0.01276 NA
See Supplementary Information S1 for the complete dataset. Genetic results in bold are significantly different from zero. PLD = pelagic larval duration. Pairwise FST
calculations are shown for pairs of populations: ‘‘Mont-OR,’’ for example, is the pairwise FSTbetween Monterey and Oregon. SB = Santa Barbara, Mont = Monterey, OR =
Oregon, AK = Alaska.
doi:10.1371/journal.pone.0008594.t002 Table 2.Cont.
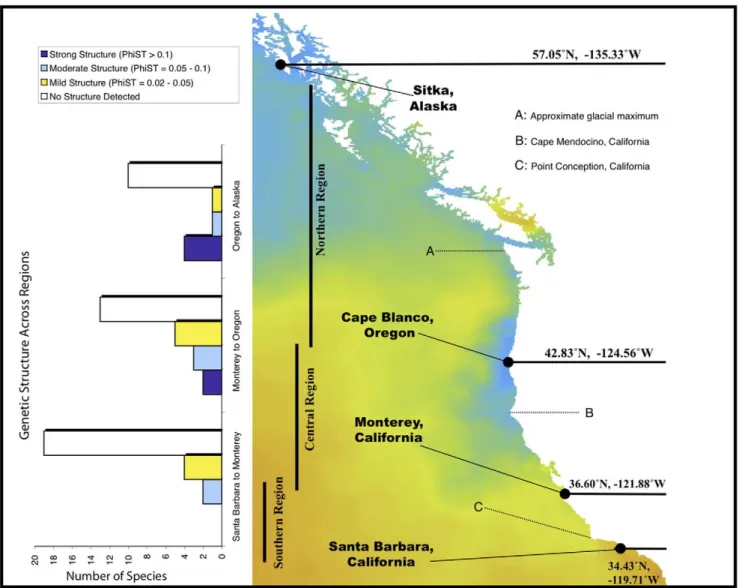
Figure 1. Map of primary collection locations, geographic regions, and major ecological features of the Pacific coast of North America.The background color represents sea surface temperature for a day in July, 2008. Bar graphs on the left-hand side of the figure show the number of species with strong, moderate and mild genetic structure in southern, central and northern comparisons. Structure categories are mild:
WST= 0.02 – 0.05, moderate: 0.05 – 0.10, strong:.0.1.
differences across the Cape (Figure 2). However, different species have different patterns of genetic differentiation, from broad genetic clines to sharper genetic breaks. Isolation-by-distance patterns are strong for several species, but the slopes of the lines relating genetic and geographic distance vary widely (Figure 2).
Sotka et al. [30] previously showed a shift in barnacle gene frequencies at mtDNA and nuclear loci from Monterey to Oregon, probably due to a combination of dispersal and selection [34]. Our data on the limpetLottia digitalisshow a similar strong genetic cline over several hundred km. Inspection of intraspecific haplotype networks shows that there are two sets of related haplotypes differing by two base pairs in this species, and that these clades shift in relative abundance from northern to southern populations. Southern Oregon is dominated by one clade (.90%) whereas populations south of San Francisco show .90% the alternative
clade. Further south, this limpet species is replaced by a cryptic species newly namedLottia austrodigitalis[35]. Shanks [36] showed that L. digitalis spawned during downwelling oceanographic conditions when offshore transport of larvae is likely to be limited. Such restricted realized larval dispersal may help to explain the strong genetic structure along the California coast in this species. Other species with structure do not appear to have these obvious limits to dispersal potential. The hermit crabs Pagurus hirsutiusculusandP. granosimanushave large eggs and larval periods of 9–10 weeks [37]. Several species of nearshore fish also show strong genetic breaks at Cape Mendocino [38]. Long planktonic durations are associated in these species with low differentiation along the California coast between Monterey and Cape Mendo-cino (Figure 2). In these cases, genetic differences occur closer to Cape Mendocino itself and may be driven by offshore movement
Figure 2. Genetic differentiation in the vicinity of Cape Mendocino, CA, for six invertebrate species.Squares represent sampling localities for each species (different habitat requirements precluded identical sampling sites). Squares with different shading are significantly different in Arlequin analyses based on COI haplotypes for each species. Sample sizes and exact collection locations are shown in Table 1. Inset is the correlation between geographic and genetic distance for the same six species, for collections made in the Cape Mendocino region. Asterisk denotes significance at the p = 0.05 level.
Figure 3. Overall genetic subdivision (WST) and pelagic larval duration (PLD).Brooding species (nonpelagic larvae) in black filled circles, nonbrooding species (pelagic larvae) in orange filled circles. Statistical results for the nonparametric Spearman Rank Correlation are shown. doi:10.1371/journal.pone.0008594.g003
Figure 4. Overall genetic subdivision (WST) and habitat depth for nonbrooding species for four habitat categories.Asterisk denotes significant the difference between the high intertidal depth category and both the mid-intertidal and low-subtidal categories (p,0.05). Box widths are 25thand 75thquartiles, respectively; bars are means, and whiskers are the extreme data points. WST values are significantly or marginally
significantly apportioned among depth categories (ANOVA R2= 0.24, p = 0.02). High and Mid-Intertidal species had significantly and marginally greaterWSTvalues than Low to Subtidal species, respectively (Wilcoxon, p = 0.03 and p = 0.07). Depth categories were sampled approximately equally in each geographic region (chi-square, all region pairs p.0.2).
at Cape Mendocino of the south-flowing California Current. Surface drifters released from Oregon tend to veer offshore at this point [30]: strong upwelling jets and seasonal offshore currents [39,40] may form a barrier that has a structuring effect on some marine populations in this area. This barrier is not impenetrable, however: many species, including some with low pelagic durations, have no discernable structure.
Broad geographic concordance of genetic structure among species has been used as a signal of the impact of geographically initiated dispersal boundaries on genetic differentiation [41]. For Cape Mendocino, our data show that multiple species exhibit genetic differentiation across this geographic feature. Unsurpris-ingly, patterns of genetic differentiation are not entirely concor-dant, suggesting that currents or other features of the Cape Mendocino region affects population structure on a species-by-species basis.
Our current analysis is limited by the unavailability of some species at some locations, and by our focus on a single mtDNA region for comparison. Further work on the fine scale geography of differentiation using COI and other loci is warranted in order to discern the causes of different levels of dispersal interruption among species.
Pelagic period and genetic structure
Across the 50 species studied here, we find that species without a pelagic period have the highest structure, in accord with many previous studies [13,14,15,16,17,42,43]. However, if only species with pelagic larvae are considered, duration is uncorrelated with overall population subdivision (Figure 3). Some previous multi-species studies also showed poor relationship between larval duration and genetic structure [21], and several striking genetic clines have been described for species that were expected to have high dispersal [20,44,45].
These inconsistencies have gone largely unexplained. Barber et al. [46] suggested that larval settlement behavior might explain the difference in the scale of population genetic differentiation among stomatopod crustacea. Cowen et al. [47] also focused on larval behavior as a major determinant of dispersal in Caribbean fishes. Sivasundar and Palumbi (submitted) showed thatSebastesrockfish that differed in settlement behavior had different scales of population structure. Shanks and Eckert [37] suggested that differences in breeding date could help explain dispersal patterns in California fish and crustaceans because of seasonal differences in current direction and strength. These results point to the importance of understanding details of the relevant larval ecology in explaining genetic change among populations. Because larvae are not passive particles, integrating behavioral data, seasonal information and oceanographic models with larval durations is likely to increase the explanatory power of larval life histories and genetic differentiation among species.
Habitat correlates of genetic structure
Though larval duration provides little explanatory power, we see a marked increase in genetic structure among high-to-mid intertidal species. The species with strong structure include acorn barnacles, intertidal limpets, and shore crabs, as well as several species of snails and a tide pool copepod with low larval dispersal potential (Table 2, and Supplementary Information). The association of habitat with structure is not perfect: many intertidal species have no structure and some subtidal species do.
Marko [16] noted an apparently contrasting trend, with a significantly greater proportion of genetically structured species occurring in the lower midlittoral zone than in the upper midlittoral and higher zones. He attributed this to the effects of
Pleistocene glaciation, which would have eliminated the habitat of the upper-intertidal species’ northern populations. However, we note several key differences between our results and Marko’s. First, the trend we report includes only species with planktonic development, minimizing developmental type as a potentially confounding variable. By contrast, half of the species that Marko considered do not disperse planktonically: looking at just those with planktonic development, his observed trend disappears. Secondly, our northern samples came from Sitka, Alaska, which was likely not glaciated in the latest Pleisocene given the genetic diversity (an in some cases, clade structure) present in those samples, and therefore not subject to the effect Marko identified. Finally, the increased number of species we sampled was designed to be a more robust test of precisely this kind of hypothesis, providing statistical power to discern general trends impacting a larger number of taxa. We included as many species from the published literature as the original authors’ geographic sampling would allow (including 3 of 8 species Marko analyzed), and did not observe the same trends in the larger dataset.
Candidate mechanisms for increased genetic structure of high intertidal species include differential larval movement and selection. High intertidal species, immersed for only part of the day, likely have fewer opportunities to launch larvae into the water column and fewer chances for larvae to settle. Alternatively, intertidal species may have larvae that behaviorally remain close to shore, thereby limiting along shore movement. This type of explanation has been offered in the case of west coast rockfish, for which shallow water species appear to have more structure than deeper water species [48]. This possibility is weakened by the observation of larvae of intertidal species such as acorn barnacles in offshore oceanic fronts [49,50], and the weak genetic differentiation of low intertidal species that are just as tied to shore-based habitats as are upper intertidal species (Figure 4).
It is also possible that greater aerial exposure in the high-mid intertidal zones subjects these species to a greater variety of environmental stresses that may generate selective gradients along latitudinal ranges. Previous work on allozyme variation has shown the power of selection to generate structure along environmental gradients in marine and terrestrial systems by acting on individual loci [51,52,53,54,55,56]. Intertidal exposure is tied in the barnacle
Semibalanus balanoidesto variation in allele frequencies at allozymes under strong selection, but does not alter mtDNA frequencies [54]. Along the west coast of North America, latitude, the time of exposure to low tide and the probability of coastal fog all combine to create a patchwork of physiological stresses for high intertidal species [57]. The strongest current tests of selection focus on the tidepool copepod Tigriopus californicus [58], where large genetic differences across Point Conception are the exception to the geographic patterns we show here. In this case, mtDNA variation is linked to adaptive interactions between nuclear and mitochon-drial gene products. Testing selection in other species with striking genetic differentiation (Balanus glandula, Lottia digitalis, Lottia pelta, Pagurus spp.) could reveal important mechanisms of evolution in continuous populations with high dispersal potential across environmental gradients.
Genetics and dispersal
differ by just a few base pairs in general, and it would be unusual if strong selection was acting across species in the same ways. Nevertheless, if the rocky intertidal species studied here show this type of strong selection at COI, then the genetic clines we describe may not reflect dispersal limits but rather a balance between selection and dispersal [34].
Explaining the lack of structure for species with seemingly modest dispersal requires similar caution. The snailTegula funebralis
has a 5-day larval period yet shows practically no structure from Oregon to southern California. Populations of this snail are extremely abundant in low intertidal habitats, and as a result very low per capita migration rates might result in moderate or high levels of total gene flow (typically measured as the population size times the per capita migration, Nm). In other cases, ecologically rare dispersal may nevertheless be large enough to be evolution-arily important, resulting in genetic differentiation that is indistinguishable from zero because of sampling error [60]. Third, populations may not be at drift-migration equilibrium [61]: recent shifts in populations due to glacial cycles may have obscured genetic differentiation and give the impression of high contempo-rary larval exchange. These various reasons urge caution in interpreting lack of genetic structure in low dispersal marine species.
Management implications
The 1999 California Marine Life Protection Act mandates a system of marine protected areas along the California coast to support marine ecosystem diversity and stability. Over the past several years, a statewide process for designing and implementing protected area networks has been based on four broad biotic zones based on the biogeographic boundary at Pt. Conception and three other practical socio-political borders. Cape Mendocino sits squarely within Zone 4 of the MLPA process, yet our data suggest that this area may be a fence that limits larval dispersal and population connectivity (see http://mlpa.dfg.ca.gov).
Such fences may disrupt the connections among protected areas, and greatly reduce their ability of the network to stabilize marine populations [62,63,but see 64, suggesting that such regions may be valuable as MPAs because they agglomerate alleles from either side of the metaphorical fence]. A break in dispersal along a coastline could indicate that California MPAs will have only limited influence on marine populations to the north of Cape Mendicino, in Oregon and Washington. These suggestions do not apply to all marine species, because the influence of Cape Mendocino appears to vary from species to species in our data set, but the effects of such cryptic marine barriers are notable for their direct policy implications in California and elsewhere.
Taken together, our findings contribute to a view of marine populations as existing in a complex patchwork of habitats that is often obscured by the habitats’ superficial similarity. Rather than a process driven primarily by differences in pelagic larval duration, genetic structure may be also often driven by differences in selection across environmental gradients, and by complex larval adaptations that reduce effective dispersal.
Methods
Specimens were collected live from the field between 2006 and 2008 and preserved in 95% ethanol at 4uC until they could be processed. The four focal collection locations were chosen to span regions of ecological or geographic interest (Figure 1). The southern region (between Monterey and Santa Barbara, Califor-nia) spanned Point Conception, a focal point for biogeography and phylogeography because of its associated faunal turnover and
an abrupt change in sea surface temperature and current regime [25,27,29,65,66]. The central region (Monterey to southern Oregon) spanned a gradient in primary productivity and upwelling [67] known to be coincident with at least one marine genetic cline [30, Galindo and Palumbi submitted, Jacobs-Palmer and Palumbi in prep], as well as a strong upwelling zone at Cape Mendocino, California, a prominent coastal feature. The northern region (southern Oregon to Sitka, Alaska) spanned a divergence of sea surface currents near Vancouver Island, British Columbia [68], and the maximum extent of the Pleistocene glaciation, thought to have destroyed much of the intertidal habitat north of ca. 49uN latitude until approximately 12–13kya [69].
In some cases, individual species could not be found at the target collection locations, and nearby sites were sampled instead (all collection locations shown in Table 1). Because species ranges vary, not every species could be sampled at every location.
34 invertebrate species were sampled to form the original dataset included here, averaging 18 individuals per population per species, between 2 and 4 geographic locations sampled for each species (Table 1). In some cases, additional collections were made at higher spatial resolution to investigate local barriers to gene flow; these are also included in Table 1. The remaining 16 species were drawn from the published literature; the overall taxonomic sampling was as follows: crustaceans (n = 21 spp.), molluscs (21 spp.), echinoderms (6 spp.), annelids (1 sp.), cnidarians (1 sp.). We have submitted the sequence data from our original dataset to Genbank, where they will be publicly available.
PCR and subsequent sequencing was carried out on genomic DNA as described in [70]. Genetic data were analyzed with Arlequin software for the Macintosh or Windows [71,72], used to calculate the overall amount of genetic subdivision among populations (WST), pairwise subdivision among populations
(Slatkin’s Linearized FST), and nucleotide diversity (h) using a
Kimura 2-parameter correction. Genetic data were gathered from the published literature as noted in Table 2, and Supplementary Information, and in three cases for which only gene trees were published, clade-level allelic differences between populations were estimated to result in very high FST values (ca. 0.5–1.0), though
our results are not strongly influenced by the magnitudes of these estimations.
Ecological and life history information for each species was gathered from the primary literature (Table 2, and Supplementary Information). Biotic characters were entered as either numeric (e.g., minimum pelagic larval duration, in days) or categorical (e.g., phylum) independent variables, with measures of genetic subdivi-sion (pairwise population FST and overall WST) used as numeric
dependent variables for single or multiple linear regression or ANOVA. In total, 22 biotic characters were evaluated for significant correlations with genetic subdivision. Tajima’s D calculated using the Bioinformatics toolbox for Matlab (Math-works, Inc.). All statistical analyses were carried out using the free software package R (http://www.R-project.org).
taxonomic group (family or order) was present. We then used 100 replicate subsampled datasets to assess the distribution of determination coefficients between relevant variables; this process ensured that the observed significant correlations were not artifacts of nonuniform sampling across taxonomic groups.
Supporting Information
Supplementary Information S1 Table of ecological and life history information used for analysis. Genetic results in bold are significantly different from zero. Larval types were sorted into practical categories; while some crustacean groups have different names for terminal larval stages, those that reasonably approxi-mated megalopae were labeled as such. Larval trophic level was treated similarly, sorting groups into functional categories. Habitat depth was treated in a variety of different ways, the most relevant presented here: divided into seven categories, four categories, and an ordered set of seven numerical values. Pairwise FST calculations are shown for pairs of populations: ‘‘Mont-OR,’’ for example, is the pairwise FST between Monterey and Oregon. SB = Santa Barbara, Mont = Monterey, OR = Oregon, AK = Alaska. SAShA OM represents the mean geographic distance between shared alleles; SAShA OM/Exp is the ratio of the observed mean geographic distance between alleles to the expected distance given sampling (see Kelly et al., Journal of
Heredity, in press). Tajima’s D was calculated for the overall sample of all populations combined, with data trimmed to remove missing characters.
Found at: doi:10.1371/journal.pone.0008594.s001 (0.06 MB PDF)
Acknowledgments
Emily Jacobs-Palmer was especially instrumental in the collection of specimens and data for this paper. We thank her and Kristy Deiner, Carolyn Tepolt, Malin Pinsky, Mollie Manier, and Jason Ladner for assistance. Freya Sommer, Jim Watanabe, Joe Wible, Tim Knight, and Judy Thompson at Hopkins Marine Station aided with local collections and administration. Conan Kelly, Melissa Pespeni, Arjun Sivasundar, Doug Eernisse, Scott Hamilton, Shane Anderson, Joaquin Vieira and Thu Nguyen provided other assistance in the field or independent collections. Alison Haupt generously provided unpublished data from her dissertation, Heather Galindo provided data from submitted and unpublished work, and Ryan Ellingson and Pat Krug made their original data available. Pat Krug and anonymous reviewers also provided valuable comments on the manuscript. Emily Flynn helped wrangle the unwieldy tables into shape.
Author Contributions
Conceived and designed the experiments: RK SP. Performed the experiments: RK. Analyzed the data: RK SP. Contributed reagents/ materials/analysis tools: SP. Wrote the paper: RK SP.
References
1. Lubchenco J, Palumbi S, Gaines S, Andelman S (2003) Plugging a hole in the ocean: The emerging science of marine reserves. Ecological Applications 13: S3–S7.
2. Moritz C (1994) Defining ‘evolutionary significant units’ for conservation. Trends in Ecology and Evolution 9: 373–375.
3. Slocombe S (1993) Implementing Ecosystem-Based Management. BioScience 43: 612–622.
4. Pikitch EK, Santora C, Babcock EA, Bakun A, Bonfil R, et al. (2004) Ecosystem-Based Fishery Management. Science 305: 346–347.
5. Schmitt T (2007) Molecular biogeography of Europe: Pleistocene cycles and postglacial trends. Frontiers in Zoology 4: 1–13.
6. Palumbi SR (2004) Marine reserves and ocean neighborhoods: The spatial scale of marine populations and their management. Annual Review of Environment and Resources 29: 31–68.
7. Botsford L, Micheli F, Hastings A (2003) Principles for the design of marine reserves. Ecological Applications 13: S25–S31.
8. Palumbi S (1994) Genetic divergence, reproductive isolation, and marine speciation. Ann Rev Ecol Syst 25: 547–572.
9. Palumbi SR (2003) Population genetics, demographic connectivity, and the design of marine reserves. Ecological Applications 13: S146–S158.
10. Hellberg ME, Burton RS, Neigel JE, Palumbi SR (2002) Genetic Assessment of Connectivity Among Marine Populations. Bulletin of Marine Science 70: 273–290.
11. Joost S, Bonin A, Bruford MW, Despres L, Conord C, et al. (2007) A spatial analysis method (SAM) to detect candidate loci for selection: towards a landscape genomics approach to adaptation. Molecular Ecology 16: 3955–3969. 12. Galindo HM, Olson DB, Palumbi SR (2006) Seascape genetics: A coupled oceanographic-genetic model predicts population structure of Caribbean corals. Current Biology 16: 1622–1626.
13. Arndt A, Smith MJ (1998) Genetic diversity and population structure in two species of sea cucumber: Differing patterns according to mode of development. Molecular Ecology 7: 1053–1064.
14. Dawson MN, Louie KD, Barlow M, Jacobs DK, Swift CC (2002) Comparative phylogeography of sympatric sister species, Clevelandia ios and Eucyclogobius newberryi(Teleostei, Gobiidae), across the California Transition Zone. Molecular Ecology 11: 1065–1075.
15. Hellberg ME (1996) Dependence of gene flow on geographic distance in two solitary corals with different larval dispersal capabilities. Evolution 50: 1167–1175.
16. Marko PB (2004) ‘What’s larvae got to do with it?’ Disparate patterns of post-glacial population structure in two benthis marine gastropods with identical dispersal potential. Molecular Ecology 13: 597–611.
17. Miller KJ, Ayre DJ (2008) Population structure is not a simple function of reproductive mode and larval type: insights from tropical corals. Journal of Animal Ecology 77: 713–724.
18. Bohonak AJ (1999) Dispersal, gene flow, and population structure. The Quarterly Review of Biology 74: 21–45.
19. Burton RS (1983) Protein polymorphisms and genetic differentiation of marine invertebrate populations. Mar Biol Lett 4: 193–206.
20. Burton RS, Feldman MW (1981) Population genetics ofTigriopus californicus. II. Differentiation among neighboring populations. Evolution 35: 1192–1205. 21. Shulman MJ, Bermingham E (1995) Early life histories, ocean currents, and the
population genetics of Caribbean reef fishes. Evolution 49: 897–910. 22. Kelly RP, Eernisse DJ (2007) Southern hospitality: a latitudinal gradient in gene
flow in the marine environment. Evolution 61: 700–707.
23. Avise JC (1992) Molecular population structure and the biogeographic history of a regional fauna: A case history with lessons for conservation biology. Oikos 63: 62–76.
24. Avise JC (2000) Phylogeography: The history and formation of species. Cambridge, MA: Harvard University Press. pp 447 p.
25. Burton R (1998) Intraspecific phylogeography across the Point Conception biogeographic boundary. Evol 52: 734–745.
26. Marko PB (1998) Historical allopatry and the biogeography of speciation in the prosobranch snail genusNucella. Evolution 52: 757–774.
27. Wares JP, Gaines SD, Cunningham CW (2001) A comparative study of asymmetric migration events across a marine biogeographic boundary. Evolution 55: 295–306.
28. Cassone BJ, Boulding EG (2006) Genetic structure and phylogeography of the lined shore crab,Pachygrapsus crassipes, along the northeastern and western Pacific coasts. Marine Biology 149: 213–226.
29. Dawson MN (2001) Phylogeography in coastal marine animals: a solution from California? Journal of Biogeography 28: 723–736.
30. Sotka EE, Wares JP, Barth JA, Grosberg RK, Palumbi SR (2004) Strong genetic clines and geographical variation in gene flow in the rocky intertidal barnacle Balanus glandula. Molecular Ecology 13: 2143–2156.
31. Cudaback CN, Washburn L, Dever E (2005) Subtidal inner-shelf circulation near Point Conception, California. Journal of Geophysical Research 110: C10007.
32. Glynn PWA (1988) El Nin˜o-southern oscillation 1982–1983: near-shore population, community, and ecosystem responses. Annual Reviews of Ecology and Systematics 19: 309–345.
33. Rocha-Olivares A, Vetter RD (1999) Effects of oceanographic circulation on the gene flow, genetic structure, and phylogeography of the rosethorn rockfish (Sebastes helvomaculatus). Canadian Journal of Fisheries and Aquatic Sciences 56: 803–813.
34. Sotka EE, Palumbi SR (2006) The use of genetic clines to estimate dispersal distances of marine larvae. Ecology 87: 1094–1103.
35. Crummett LT, Eernisse DJ (2007) Genetic evidence for the cryptic species pair, Lottia digitalisandLottia austrodigitalis and microhabitat partitioning in sympatry. Marine Biology 152: 1–13.
36. Shanks A (1998) Apparent oceanographic triggers to the spawning of the limpet Lottia digitalis(Rathke). J exp mar Bio Ecol 222: 31–41.
38. Burford M, Bernardi G (2008) Incipient speciation within a subgenus of rockfish (Sebastosomus) provides evidence of recent radiations within an ancient species flock. Marine Biology 154: 701–717.
39. Barth JA, Pierce SD, Smith RL (2000) A separating coastal upwelling jet at Cape Blanco, Oregon and its connection to the California Current System. Deep-Sea Research II 47: 783–810.
40. Magnell BA, Bray NA, Winant CD, Greengrove CL, Largier J, et al. (1990) Convergent shelf flow at Cape Mendocino. Oceanography April. pp 4–11. 41. Avise JC (1994) Molecular markers, Natural History, and Evolution. New York:
Chapman and Hall.
42. McMillan WO, Raff RA, Palumbi SR (1992) Population genetic consequences of developmental evolution and reduced dispersal in sea urchins (genus Heliocidaris). Evolution 46: 1299–1312.
43. Riginos C, Nachman MW (2001) Population subdivision in marine environ-ments: The contributions of biogeography, geographical distance and discon-tinuous habitat to genetic differentiation in a blennioid fish, Axoclinus nigricaudus. Molecular Ecology 10: 1439–1453.
44. Burton RS, Feldman MW (1982) Population genetics of coastal and estuarine invertebrates: does larval behavior influence population structure? In: Kennedy VS, ed. Estuarine Comparisons. New York: Academic Press. pp 537–551.
45. Barber PH, Palumbi SR, Erdmann MV, Moosa MK (2000) A Marine Wallace’s Line? Nature 406: 692–693.
46. Barber PH, Erdmann MV, Palumbi SR (2006) Comparative phylogeography of three codistributed stomatopods: Origins and timing of regional lineage diversification in the coral triangle. Evolution 60: 1825–1839.
47. Cowen RK, Lwiza KMM, Sponaugle S, Paris CB, Olson DB (2000) Connectivity of marine populations: Open or closed? Science 287: 857–859. 48. Buonaccorsi VP, Kimbrell CA, Lynn EA, Vetter RD (2002) Population structure
of copper rockfish (Sebastes caurinus) reflects postglacial colonization and contemporary patterns of larval dispersal. Canadian Journal of Fisheries and Aquatic Sciences 59: 1374–1384.
49. Roughgarden J, Pennington JT, Stoner D, Alexander S, Miller K (1991) Collisions of upwelling fronts with the intertidal zone: The cause of recruitment pulses in barnacle populations of central California USA. Acta Oecologica 12: 35–52.
50. Farrell TM, Bracher D, Roughgarden J (1991) Cross-Shelf Transport Causes Recruitment to Intertidal Populations in Central California. Limnology and Oceanography 36: 279–288.
51. Powers DA, Place AR (1978) Biochemical genetics ofFundulus heterolitus(L.) I. Temporal and spatial variation in gene frequencies of Ldh-B, Mdh-A, Gpi-B, and Pgm-A. Biochemical Genetics 16: 593–607.
52. Watt WB (1977) Adaptation at specific loci. I. Natural selection on phosphoglucose isomerase of Colias butterflies: Biochemical and population aspects. Genetics 87: 177–194.
53. Karl SA, Avise JC (1992) Balancing selection at allozyme loci in oysters: Implications from nuclear RFLPs. Science 256.
54. Schmidt PS, Rand DM (2001) Adaptive maintenance of genetic polymorphism in an intertidal barnacle: habitat- and life-stage-specific survivorship of MPI genotypes. Evolution 55: 1336–1344.
55. Crawford DL, Powers DA (1992) Evolutionary adaptation to different thermal environments via transcriptional regulation. Molecular Biology and Evolution 9: 806–813.
56. Ve´liz D, Bourget E, Bernatchez L (2004) Regional variation in the spatial scale of selection at MPI and GPI in the acorn barnacle Semibalanus balanoides (Crustacea). Journal of Evolutionary Biology 17: 953–966.
57. Helmuth B, BRBroitman, CABlanchette, SGilman, PHalpin, et al. (2006) Mosaic patterns of thermal stress in the rocky intertidal zone: implications for climate change. Ecological Monographs 76: 461–479.
58. Burton RS (1987) Differentiation and integration of the genome in populations ofTigriopus californicus. Evolution 41: 504–513.
59. Koehn RK, Newell RIE, Immerman F (1980) Maintenance of an aminopep-tidase allele frequency cline by natural selection. Proc Natl Acad Sci (USA) 77: 5385–5389.
60. Waples R (1998) Separating the wheat from the chaff: Patterns of genetic differentiation in high gene flow species. Journal of Heredity 89: 438–450. 61. Slatkin M (1993) Isolation by distance in equilibrium and non-equilibrium
populations. Evol 47: 264–279.
62. Hastings A, Botsford L (2003) Comparing designs of marine reserves for Fisheries and for biodiversity. Ecological Applications 13: S65–S70. 63. Hastings A, Botsford LW (2006) Persistence of spatial populations depnds on
returning home. PNAS 13: 6067–6072.
64. Pringle JM, Wares JP (2007) Going against the flow: maintenance of alongshore variation in allele frequency in a coastal ocean. Marine Ecology Progress Series 335: 69–84.
65. Doyle RF (1985) Biogeographical studies of rocky shores near Point Conception, California [Ph.D. Dissertation]. Santa Barbara, CA: University of California, Santa Barbara.
66. Jablonski D, Flessa K, Valentine JW (1985) Biogeography and paleobiology. Paleobiology 11: 75–90.
67. Huyer A (1983) Coastal upwelling in the California Current ecosystem. Progress in Oceanography 12: 259–284.
68. Freeland HJ (2006) What proportion of the North Pacific Current finds its way into the Gulf of Alaska? Atmosphere-Ocean 44: 321–330.
69. Dyke AS, Prest VK (1987) Late Wisconsonian and Holocene History of the Laurentide Ice Sheet. Geographie physique et Quaternaire 41: 237–263. 70. Kelly RP, Palumbi SR (2008) General-Use PCR Primers for Amplification and
Direct Sequencing of Enolase, a Single Copy Nuclear Gene, from Different Animal Phyla. Molecular Ecology Resources in press.
71. Excoffier L, Laval G, Schneider S (2005) Arlequin ver. 3.0: An integrated software package for population genetics data analysis. Evolutionary Bioinfor-matics Online 1: 47–50.
72. Schneider S, Roessli D, Excoffier L (2000) Arlequin: A software for population genetics data analysis. 2.000 ed. Geneva: Genetics and Biometry Lab, Dept. of Anthropology, University of Geneva.
73. Duminil J, Fineschi S, Hampe A, Jordano P, Salvini D, et al. (2007) Can population genetic structure be predicted from life-history traits? The American Naturalist 169: 662–672.