ACPD
13, 27243–27285, 2013Ozone production in four major cities of
China
L. K. Xue et al.
Title Page
Abstract Introduction
Conclusions References
Tables Figures
◭ ◮
◭ ◮
Back Close
Full Screen / Esc
Printer-friendly Version Interactive Discussion
Discussion
P
a
per
|
D
iscussion
P
a
per
|
Discussion
P
a
per
|
Discuss
ion
P
a
per
|
Atmos. Chem. Phys. Discuss., 13, 27243–27285, 2013 www.atmos-chem-phys-discuss.net/13/27243/2013/ doi:10.5194/acpd-13-27243-2013
© Author(s) 2013. CC Attribution 3.0 License.
Atmospheric Chemistry and Physics
Open Access
Discussions
This discussion paper is/has been under review for the journal Atmospheric Chemistry and Physics (ACP). Please refer to the corresponding final paper in ACP if available.
Ozone production in four major cities of
China: sensitivity to ozone precursors
and heterogeneous processes
L. K. Xue1, T. Wang1,2,3, J. Gao3, A. J. Ding4, X. H. Zhou2, D. R. Blake5, X. F. Wang2, S. M. Saunders6, S. J. Fan7, H. C. Zuo8, Q. Z. Zhang2, and W. X. Wang2,3
1
Department of Civil and Environmental Engineering, Hong Kong Polytechnic University, Hong Kong, China
2
Environment Research Institute, Shandong University, Ji’nan, Shandong, China 3
Chinese Research Academy of Environmental Sciences, Beijing, China 4
Institute for Climate and Global Change Research and School of Atmospheric Sciences, Nanjing University, Nanjing, Jiangsu, China
5
Department of Chemistry, University of California at Irvine, Irvine, CA, USA 6
School of Chemistry and Biochemistry, University of Western Australia, WA, Australia 7
College of Environmental Science and Engineering, Sun Yat-Sen University, Guangzhou, Guangdong, China
8
ACPD
13, 27243–27285, 2013Ozone production in four major cities of
China
L. K. Xue et al.
Title Page
Abstract Introduction
Conclusions References
Tables Figures
◭ ◮
◭ ◮
Back Close
Full Screen / Esc
Printer-friendly Version Interactive Discussion
Discussion
P
a
per
|
D
iscussion
P
a
per
|
Discussion
P
a
per
|
Discuss
ion
P
a
per
|
Received: 22 August 2013 – Accepted: 22 September 2013 – Published: 21 October 2013
Correspondence to: T. Wang ([email protected])
ACPD
13, 27243–27285, 2013Ozone production in four major cities of
China
L. K. Xue et al.
Title Page
Abstract Introduction
Conclusions References
Tables Figures
◭ ◮
◭ ◮
Back Close
Full Screen / Esc
Printer-friendly Version Interactive Discussion
Discussion
P
a
per
|
D
iscussion
P
a
per
|
Discussion
P
a
per
|
Discuss
ion
P
a
per
|
Abstract
Despite a large volume of research over a number of years, our understandings of the key precursors that control tropospheric ozone production and the impacts of heteroge-neous processes remain incomplete. In this study, we analyze measurements of ozone and its precursors made at rural/suburban sites downwind of four large Chinese cities –
5
Beijing, Shanghai, Guangzhou and Lanzhou. At each site the same measurement tech-niques were utilized and a photochemical box model based on the Master Chemical Mechanism (v3.2) was applied, to minimize uncertainties in comparison of the results due to differences in methodology. All four cities suffered from severe ozone pollution. At the rural site of Beijing, export of the well-processed urban plumes contributed to
10
the extremely high ozone levels (up to an hourly value of 286 ppbv), while the pollution observed at the suburban sites of Shanghai, Guangzhou and Lanzhou was character-ized by intense in-situ ozone production. The major anthropogenic hydrocarbons were alkenes and aromatics in Beijing and Shanghai, aromatics in Guangzhou, and alkenes in Lanzhou. The ozone production was found to be in a VOCs-limited regime in both
15
Shanghai and Guangzhou, and a mixed regime in Lanzhou. In Shanghai, the ozone formation was most sensitive to aromatics and alkenes, while in Guangzhou aromatics were the predominant ozone precursors. In Lanzhou, either controlling NOx or
reduc-ing emissions of olefins from the petrochemical industry would mitigate the local ozone production. The potential impacts of several heterogeneous processes on the ozone
20
formation were assessed. The hydrolysis of dinitrogen pentoxide (N2O5), uptake of
the hydroperoxyl radical (HO2) on particles, and surface reactions of NO2 forming ni-trous acid (HONO) present considerable sources of uncertainty in the current studies of ozone chemistry. Further efforts are urgently required to better understand these processes and refine atmospheric models.
ACPD
13, 27243–27285, 2013Ozone production in four major cities of
China
L. K. Xue et al.
Title Page
Abstract Introduction
Conclusions References
Tables Figures
◭ ◮
◭ ◮
Back Close
Full Screen / Esc
Printer-friendly Version Interactive Discussion
Discussion
P
a
per
|
D
iscussion
P
a
per
|
Discussion
P
a
per
|
Discuss
ion
P
a
per
|
1 Introduction
Air quality in large cities has drawn increasing attention in recent years (Molina and Molina, 2004; Parrish and Zhu, 2009). A typical and intractable issue is photochem-ical smog characterized by unhealthily high concentrations of ozone (O3) and other oxidants, which are products of atmospheric photochemistry involving volatile organic
5
compounds (VOCs) and nitrogen oxides (NOx=NO+NO2). Despite a long history of
control, photochemical smog remains a major environmental concern in large cities (Molina and Molina, 2004). The ozone problem is a complex coupling of primary emissions, chemical transformation, and dynamic transport at different scales (Jacob, 1999). A major challenge in regulating ozone pollution lies in understanding its
com-10
plex and non-linear chemistry with respect to O3precursors (i.e., NOx, CO and VOCs)
that varies with time and from place to place. Therefore, investigating ozone pollution and the inherent chemistry in large metropolitan areas is critical from an environmental management point of view.
In recent decades China has become home to several megacities and many large
15
cities owing to the fast-paced urbanization and industrialization processes. It is not surprising that these cities have been experiencing air quality deterioration, in view of the fast expansion in economics, energy use, and motor vehicles in the past decades. High ozone concentrations exceeding the national ambient air quality standards have frequently been observed in and downwind of large cities (e.g., Wang et al., 1998,
20
2001, 2006; Cheung and Wang, 2001; Zhang et al., 2007; Zhang et al., 2008; Ran et al., 2009). It has also been found that in some of the most urbanized regions, i.e., the north China plain (NCP), Yangtze River delta (YRD), and Pearl River delta (PRD), atmospheric ozone levels show an increasing trend over the last decade (Ding et al., 2008; Shao et al., 2006; Wang et al., 2009b; Xu et al., 2008). In view of the projected
25
ACPD
13, 27243–27285, 2013Ozone production in four major cities of
China
L. K. Xue et al.
Title Page
Abstract Introduction
Conclusions References
Tables Figures
◭ ◮
◭ ◮
Back Close
Full Screen / Esc
Printer-friendly Version Interactive Discussion
Discussion
P
a
per
|
D
iscussion
P
a
per
|
Discussion
P
a
per
|
Discuss
ion
P
a
per
|
based on scientifically solid knowledge must be in place in order to return to clearer and cleaner skies.
A number of studies have been conducted to address the ozone pollution in China, mostly in the NCP, PRD, and to a lesser extent, the YRD regions. Overall, the results in Beijing have revealed that the ozone problem was serious but the formation
chem-5
istry was non-uniformly distributed within the city and with time. For example, Shao et al. (2009) reported a VOCs-limited regime of ozone production according to the re-lationship between the daily peak ozone and initial VOC concentrations at an urban site (Peking University; PKU) in the summers of 2004–2006. In comparison, Liu et al. (2012) suggested a transition regime based on a 1-D photochemical model constrained by
10
measurements taken at the same site in summer 2007. Using an observation-based chemical box model, Lu et al. (2010) indicated that both VOCs-limited and NOx-limited
regimes existed at both urban (PKU) and suburban (Yufa) sites but the O3episodes at
PKU were mostly sensitive to NOx. Interesting results were obtained in summer 2008 when the Olympic Games were hosted in Beijing and unprecedentedly strict control
15
measures were implemented (UNEP, 2009). The ozone levels were found to increase significantly after the full control despite the large reductions in NOx and VOCs in Bei-jing, implying that the current control measures were less effective for ozone pollu-tion (Chou et al., 2011; Wang et al., 2010b). Another hot spot of ozone research is the PRD region in southern China. Most studies have indicated consistently a
VOCs-20
limited regime and the dominance of reactive aromatics in Guangzhou and Hong Kong (Zhang et al., 2007; Zhang et al., 2008; Wang et al., 2010c). However, most previous studies mainly focused on the autumn season during which the ozone problem is the most severe, less is known about the ozone chemistry in other seasons such as spring when the ozone pollution is also serious (Wang et al., 2009b). In recent years, several
25
ACPD
13, 27243–27285, 2013Ozone production in four major cities of
China
L. K. Xue et al.
Title Page
Abstract Introduction
Conclusions References
Tables Figures
◭ ◮
◭ ◮
Back Close
Full Screen / Esc
Printer-friendly Version Interactive Discussion
Discussion
P
a
per
|
D
iscussion
P
a
per
|
Discussion
P
a
per
|
Discuss
ion
P
a
per
|
at a regional background site in Nanjing and suggested a VOC-limited regime in the region. Ran et al. (2009, 2012) carried out year-round measurements of O3 and O3
precursors at an urban and a suburban site, and suggested the predominant role of aromatics in ozone formation in Shanghai. However, a reactive VOC species, ethene, was not included in their observations.
5
Atmospheric models are common tools used to diagnose ozone formation regimes from the involute emission or measurement data. The chemical mechanisms underly-ing the models are usually simplified representations of the complex chemistry of the atmosphere, with the organic species of similar reactivities and structures grouped into one model species (e.g., Stockwell et al., 2012). This chemical lumping gives reduced
10
computational runtimes in the application of mechanisms, but may produce extra un-certainties when applied to different atmospheric conditions (e.g., with different VOC emissions; the lumped mechanism is usually optimized for specific atmospheric con-ditions). The Master Chemical Mechanism (MCM) is a highly explicit mechanism that has the minimum amount of chemical lumping (Jenkin et al., 1997, 2003; Saunders
15
et al., 2003), and thus is the best choice to investigate atmospheric photochemistry (including ozone production) for various environments. Another source of uncertainty in atmospheric photochemistry is heterogeneous chemical processes, which have re-cently been found to be more complex than previously thought. Several cases in point are the hydrolysis of dinitrogen pentoxide (N2O5), uptake of hydroperoxyl (HO2) on
par-20
ticles, and the heterogeneous reactions of NO2 forming nitrous acid (HONO) (Brown
et al., 2006; Thornton et al., 2008; Su et al., 2011). These heterogeneous processes are believed to be more relevant in China given the very high aerosol loadings. To date only limited studies have attempted to address the potential impacts of these pro-cesses, and they suggest the important role of HO2 uptake in ozone formation (e.g.,
25
Kanaya et al., 2009; Liu et al., 2012).
From 2004 to 2006, intensive measurements of O3, O3precursors, and other related
dif-ACPD
13, 27243–27285, 2013Ozone production in four major cities of
China
L. K. Xue et al.
Title Page
Abstract Introduction
Conclusions References
Tables Figures
◭ ◮
◭ ◮
Back Close
Full Screen / Esc
Printer-friendly Version Interactive Discussion
Discussion
P
a
per
|
D
iscussion
P
a
per
|
Discussion
P
a
per
|
Discuss
ion
P
a
per
|
ferent regions of China (see Fig. 1) and have different geographies, climates, industries, and emission patterns. The same measurement techniques were utilized in all these campaigns, making the inter-comparison among cities free from uncertainties due to differences in the methodology of observations. This paper analyzes the measurement data to examine the sensitivities of O3production to O3precursors and heterogeneous
5
processes. We first present the overview of ozone pollution and hydrocarbon distri-butions observed at the four cities (Sect. 3.1). We then apply an observation-based MCM model (OBM) to the comprehensive data on twelve O3 episodes, with the aim
of assessing in-situ ozone production (Sect. 3.2) and its sensitivities to both ozone precursors (Sect. 3.3) and heterogeneous processes (Sect. 3.4).
10
2 Methods
2.1 Study areas and site locations
The field measurements were conducted in rural/suburban areas near three megacities in northern (Beijing), eastern (Shanghai) and southern (Guangzhou) China, and a large city (Lanzhou) in western China. The sampling sites were carefully chosen downwind
15
of urban centers during the study periods to allow detailed examination of the regional-scale pollution and processes. These sites have been separately described in our pre-vious studies (Wang et al., 2006; Gao et al., 2009; Zhang et al., 2009a; Pathak et al., 2009), and below we only give a brief outline.
Beijing is the capital city of China and one of the largest cities in the world. It is located
20
on the northwestern edge of the densely populated North China Plain (see Fig. 1), and accommodates over 19 million inhabitants, 5 million automobiles, and many factories and power plants within an area of 16 800 km2. The measurements were conducted in a rural mountainous area in Chang Ping district (CP; 40◦21′N, 116◦18′E, 280 m a.s.l), approximately 50 km north (generally downwind in summer) of the city center. The site
25
anthro-ACPD
13, 27243–27285, 2013Ozone production in four major cities of
China
L. K. Xue et al.
Title Page
Abstract Introduction
Conclusions References
Tables Figures
◭ ◮
◭ ◮
Back Close
Full Screen / Esc
Printer-friendly Version Interactive Discussion
Discussion
P
a
per
|
D
iscussion
P
a
per
|
Discussion
P
a
per
|
Discuss
ion
P
a
per
|
pogenic emissions about 10 km away (Wang et al., 2006). The sampling was carried out from 21 June to 31 July 2005.
Shanghai is the largest city in China with a population of over 23 million. It also has more than 2 million vehicles, China’s largest petrochemical complex, steel manufac-turer, a seaport, and other industries. The study site was in the Taicang Meteorological
5
Station (31◦27′N, 121◦06′E, 20 m a.g.l), which is about 45 km northwest of Shang-hai. Although Taicang belongs to Jiangsu Province, it is often influenced by emissions from urban Shanghai under the prevailing southeasterly winds in summer monsoon seasons. Another feature of the site is the existence of some local sources including coal-fired power plants and some traffic from nearby roads (Gao et al., 2009). The
10
measurement data taken from 4 May to 1 June 2005 were analyzed in the present study.
Guangzhou is a megacity of over 12 million people in southern China. It is in the center of the Pearl River Delta region, which has been a “world factory” for a wide range of consumer products. The measurements were taken at Wan Qing Sha (WQS;
15
22◦42′N, 113◦33′E, 17 m a.g.l.), a suburban area about 50 km southeast of downtown Guangzhou (Pathak et al., 2009). The observation data collected between 20 April and 26 May 2004 were analyzed in this paper. Thus the present study of ozone pollution in late spring can be compared with and supplements previous investigations in the PRD that focused on autumn (Wang et al., 2010c; Zhang et al., 2007; Zhang et al., 2008).
20
Lanzhou is a large city of over 3 million people and an industrial center in the interior western China. It is situated in a narrow valley basin in mountainous regions with an average altitude of 1520 m a.s.l. This unique topography, together with its petrochemi-cal industry as well as vehicle emissions (0.2 million cars in 2006), makes it a typipetrochemi-cal “basin” of ozone pollution in summer. It was also the first place in China where
pho-25
ACPD
13, 27243–27285, 2013Ozone production in four major cities of
China
L. K. Xue et al.
Title Page
Abstract Introduction
Conclusions References
Tables Figures
◭ ◮
◭ ◮
Back Close
Full Screen / Esc
Printer-friendly Version Interactive Discussion
Discussion
P
a
per
|
D
iscussion
P
a
per
|
Discussion
P
a
per
|
Discuss
ion
P
a
per
|
the urban center is about 15 km to the southeast. The measurement campaign was conducted from 19 June to 16 July 2006.
2.2 Intensive measurements
During the four intensive campaigns, O3, CO, SO2, NO and NOy were continuously
measured at a time frequency of 1 min along with collection of VOC canister samples.
5
O3 was measured by a commercial UV photometric analyzer (Thermo Environmental Instruments (TEI), Model 49i). CO was monitored by a non-dispersive infrared analyzer (Advanced Pollution Instrumentation, Model 300EU) with internal zeroing automatically done every two hours. SO2was detected with a pulsed UV fluorescence analyzer (TEI Model 43c). NO and NOywere measured by using a chemiluminescence analyzer (TEI
10
Model 42cy) equipped with an externally-placed molybdenum oxide catalytic converter to reduce NOy to NO. Aerosol number concentration and size distribution (10 nm– 10 µm) were measured in real-time by a Wide-range Particle Spectrometer (MSP, WPS model 1000XP) in Beijing, Shanghai, and Lanzhou. Meteorological parameters includ-ing temperature, pressure, relative humidity (RH), wind direction and speed, and
so-15
lar radiation were also continuously measured. All the above measurement techniques and quality assurance/control procedures have been described elsewhere (Wang et al., 2003; Gao et al., 2009; Zhang et al., 2009a; Xue et al., 2011).
Methane (CH4) and C2-C10 non-methane hydrocarbons (NMHCs) were determined
by collecting whole air samples in evacuated stainless steel canisters with subsequent
20
analysis by gas chromatography with flame ionization detection, electron capture de-tection, and mass spectrometry (the analysis was undertaken in the University of Cal-ifornia at Irvine). Two sampling strategies were adopted in our studies. Typically, one canister sample was collected at noontime each day, providing a thorough picture of daytime VOC pollution during the campaigns. On selected ozone episode days,
multi-25
ACPD
13, 27243–27285, 2013Ozone production in four major cities of
China
L. K. Xue et al.
Title Page
Abstract Introduction
Conclusions References
Tables Figures
◭ ◮
◭ ◮
Back Close
Full Screen / Esc
Printer-friendly Version Interactive Discussion
Discussion
P
a
per
|
D
iscussion
P
a
per
|
Discussion
P
a
per
|
Discuss
ion
P
a
per
|
all the four campaigns, ensuring the minimum uncertainty due to the measurements in comparison of the results.
2.3 Observation-constrained chemical box model
An observation-based chemical box model was used to estimate the in-situ O3
pro-duction and examine the sensitivity to precursors and heterogeneous processes. The
5
model is largely similar to the one outlined in Xue et al. (2013). Briefly, it is based on the Master Chemical Mechanism (v3.2; http://mcm.leeds.ac.uk/MCM/), a highly explicit mechanism describing the degradation of 143 primary VOCs, containing∼16 900 re-actions of∼5725 organic species as well as the latest IUPAC inorganic mechanism (Jenkin et al., 1997, 2003; Saunders et al., 2003). In addition, several heterogeneous
10
processes including uptake of N2O5, NO3and HO2on particles and formation of HONO through reactions of NO2 on the ground and aerosol surfaces are also taken into
ac-count (see Sect. 3.4 for details). Dry deposition of various inorganic gases, PANs, per-oxides, carbonyls and organic acids are incorporated in the model from the recent compilation (Zhang et al., 2003). The mixing layer height affecting the dry deposition
15
rates was assumed to vary from 300 m at night to 1500 m in the afternoon. Sensitivity runs with varying maximum mixing heights (i.e., 1000 and 2000 m) showed that the impacts on the modeling results were negligible (i.e.,<3 % in net ozone production rates).
The observed concentrations of O3, CO, SO2, NO, H2O, temperature, pressure,
20
aerosol surface area and area-weighted radius, CH4, and C2-C10 NMHCs were aver-aged or interpolated with a time resolution of 10 min and used as inputs to constrain the model. The aerosol surface area and radius were calculated from the aerosol number and size distribution measurements. For Guangzhou where the aerosol size distribu-tion data were not available, we used the average diurnal data of aerosol surface and
25
ACPD
13, 27243–27285, 2013Ozone production in four major cities of
China
L. K. Xue et al.
Title Page
Abstract Introduction
Conclusions References
Tables Figures
◭ ◮
◭ ◮
Back Close
Full Screen / Esc
Printer-friendly Version Interactive Discussion
Discussion
P
a
per
|
D
iscussion
P
a
per
|
Discussion
P
a
per
|
Discuss
ion
P
a
per
|
10 min resolution were estimated as follows. During the daytime (i.e., 07:00–19:00 LT) when multiple samples were taken, the data gaps were filled by time interpolation. The nighttime concentrations were calculated based on the regressions with CO (for most hydrocarbons other than isoprene) and temperature (for isoprene), for which continu-ous observations were available. Photolysis frequencies were calculated as a function
5
of solar zenith angle within the model (Saunders et al., 2003), and were further scaled with the measured solar radiation. The model calculation was made for the identified O3 episode days with 00:00 LT as the initial time. Before each simulation, the model
pre-ran for nine days with constraints of the campaign-average diurnal data so that the model approached a steady state for the unmeasured species (e.g., NO2, radicals and
10
carbonyls).
The model read the measurement data every ten minutes to calculate the in-situ O3
production and destruction rates. The O3production is primarily achieved through
oxi-dation of NO by HO2(R1) and RO2(R2; a full list of reactions is given in Supplement), with the production rate (P(O3)) calculated as:
15
P(O3)=k1[HO2][NO]+X(k2i[RO2]i[NO]) (1)
The O3destruction is mainly contributed by O3photolysis (R3), reactions of O3with OH
(R4), HO2(R5), and unsaturated VOCs (R6), NO2with OH (R7) and RO2(R8, forming
PANs; note that the decomposition of PANs was subtracted), and NO3with VOCs (R9), heterogeneous losses of N2O5 (R10) and NO3 (R11), and dry depositions. Thus the
20
O3destruction rate (L(O3)) can be estimated as:
L(O3)=k3[O(1D)][H2O]+{k4[OH]+k5[HO2]+X(k6i[VOCi])}[O3]+k7[OH][NO2]
+k8[NO2][RO2]+2 X
(k9i[VOCi])[NO3]+3Heter. lossN2O5+2Heter. lossNO3
+dry deposition (2)
25
Then the net O3 production rate can be determined from the difference between
ACPD
13, 27243–27285, 2013Ozone production in four major cities of
China
L. K. Xue et al.
Title Page
Abstract Introduction
Conclusions References
Tables Figures
◭ ◮
◭ ◮
Back Close
Full Screen / Esc
Printer-friendly Version Interactive Discussion
Discussion
P
a
per
|
D
iscussion
P
a
per
|
Discussion
P
a
per
|
Discuss
ion
P
a
per
|
was also estimated using relative incremental reactivity (RIR), which is defined as the ratio of decrease in O3 production rate to decrease in precursor concentrations. RIR
can be used as a metric for the effect of a given emission reduction on O3
concentra-tions at a site without a detailed knowledge on the emissions (Cardelino and Chamei-des, 1995).In the present study, 20 % changes in the input precursor concentrations
5
were used.
3 Results and discussion
3.1 Overview of ozone pollution and hydrocarbon reactivity
Table 1 documents the overall ozone pollution conditions observed at the four cities during the intensive campaigns. All four cities suffered from high ozone pollution. At
10
the rural site of Beijing (CP), eighteen ozone episode days (here defined as days when the peak hourly O3concentration exceeded 100 ppbv; 44 % of the total) were observed during the 6-week measurement period. The maximum hourly O3 concentration was
recorded at 286 ppbv, which is by far the highest value reported in China in the open literature (Wang et al., 2006). Such frequency of O3 episodes and extreme O3 levels
15
highlight the severe problem in Beijing and surrounding areas. At the suburban site near Shanghai (Taicang), six ozone episode days (21 %) occurred during the 4-week campaign with the maximum hourly O3 value of 127 ppbv observed. The problem in Shanghai seemed less severe than those in Beijing and Guangzhou. This is consistent with the results of Ding et al. (2013) which suggested that the ozone pollution in the
20
YRD was relatively lighter than the NCP and PRD due to the titration effect of the much higher levels of NOx. At WQS downwind of Guangzhou, seven episode days
(19 %) were encountered throughout the 37 measurement days. The maximum hourly O3 mixing ratio was determined at 178 ppbv. This indicates that the ozone problem
is serious not only in autumn, but also in late spring in the PRD region. In Lanzhou
ACPD
13, 27243–27285, 2013Ozone production in four major cities of
China
L. K. Xue et al.
Title Page
Abstract Introduction
Conclusions References
Tables Figures
◭ ◮
◭ ◮
Back Close
Full Screen / Esc
Printer-friendly Version Interactive Discussion
Discussion
P
a
per
|
D
iscussion
P
a
per
|
Discussion
P
a
per
|
Discuss
ion
P
a
per
|
(RSP), in the 4-week campaign, eight ozone episode days (29 %) were observed, and the maximum hourly O3value was measured at 143 ppbv.
Figure 2 presents the average diurnal variations of O3, CO, NO, NOy, and solar
radi-ation at the four cities. Fast increases in ozone concentrradi-ations during the daytime are clearly shown at all sites. CO and NOy displayed a typical double-peak diurnal
pro-5
file at CP, Taicang and WQS, suggesting that they were largely of traffic-related origins. A distinct single-peak pattern with enhanced levels of CO and NOyin the early morning (8:00–9:00 LT) was observed at RSP in Lanzhou (Fig. 2d). This was due to the advec-tion of polluadvec-tion plumes from the industrial zone (i.e., Xigu district) to the study site, as evidenced by the dominant southwesterly winds observed in the morning (Zhang
10
et al., 2009a). The NOylevels measured at Taicang and WQS were of magnitude 20– 50 ppbv, and the levels observed at CP and RSP were relatively lower (10–30 ppbv).
Figures 3 and 4 show the average OH reactivities of CO and hydrocarbons obtained at the four cities, and Table 2 summarizes the top-10 NMHC species with the highest reactivity (see Supplement for the calculation of OH reactivity). To facilitate analysis of
15
the hydrocarbon speciation, the 50+species were categorized into anthropogenic hy-drocarbons (AHC; encompassing most species except isoprene andα/β-pinenes) and biogenic hydrocarbons (BHC; comprising isoprene and α/β-pinenes), with the AHC further grouped into four sub-categories: reactive aromatics (R-AROM; including all aromatics except benzene), alkenes (including all alkenes), alkanes with≥4 carbons
20
(C4HC), and low reactivity hydrocarbons (LRHC; including methane, ethane, propane, acetylene, and benzene). (The measured hydrocarbon species and their categorization are given in Table S1 in the Supplement).
At CP, the reactivity of hydrocarbons (AHC and BHC) was lower than that of CO. This is attributed to the fact that the site is located in a rural mountainous area with
25
com-ACPD
13, 27243–27285, 2013Ozone production in four major cities of
China
L. K. Xue et al.
Title Page
Abstract Introduction
Conclusions References
Tables Figures
◭ ◮
◭ ◮
Back Close
Full Screen / Esc
Printer-friendly Version Interactive Discussion
Discussion
P
a
per
|
D
iscussion
P
a
per
|
Discussion
P
a
per
|
Discuss
ion
P
a
per
|
parison, the reactivity was clearly dominated by AHC. At Taicang, the reactive AHC was dominated by both alkenes (43 %) and R-AROM (39 %). At WQS, R-AROM was the dominant AHC class with an average contribution of 46 %. At RSP, alkenes played a predominant role and composed on average 70 % of the AHC reactivity. In particular, the propene and ethene levels were extremely high, both of which contributed 53 % of
5
the AHC reactivity. The different AHC speciation observed among these sites suggests distinct emission patterns and implies different major ozone precursors in the four cities (further discussed in Sect. 3.3).
3.2 High ozone events: in-situ production vs. regional transport
The subsequent discussion is based on analysis of the selected high ozone events
10
during which the most comprehensive data were collected (i.e., multiple daily VOC samples were taken), aiming at understanding the formation of ozone episodes in these cities. A total of twelve ozone episodes (3 per city; Beijing: 9, 26 and 30 July 2005; Shanghai: 7, 8 and 22 May 2005; Guangzhou: 18, 23 and 24 May 2004; Lanzhou: 5, 11 and 12 July 2006) were analyzed in the present study. (The time series of ozone
15
and related parameters during these events are provided in the Supplement.)
The change of O3 mixing ratios at a given location is a result of in-situ photochem-istry coupled with regional transport (including both horizontal and vertical). The con-tributions from both processes can be either positive (i.e., production and import) or negative (i.e., destruction and export). Here we examined the contributions from in-situ
20
photochemistry and regional transport to the observed O3 pollution at the study sites. We first determined the rate of change in O3 mixing ratios from the observed O3time
profiles (Rmeas). The in-situ net O3 production rate (Rchem) was calculated every ten
minutes by the OBM model as described in Sect. 2.3 (note that the dry deposition has been taken into account; see Eq. 2). Then the difference (Rtrans=Rmeas−Rchem) can
25
ACPD
13, 27243–27285, 2013Ozone production in four major cities of
China
L. K. Xue et al.
Title Page
Abstract Introduction
Conclusions References
Tables Figures
◭ ◮
◭ ◮
Back Close
Full Screen / Esc
Printer-friendly Version Interactive Discussion
Discussion
P
a
per
|
D
iscussion
P
a
per
|
Discussion
P
a
per
|
Discuss
ion
P
a
per
|
at the four cities (the results were similar for other episodes for each city and are not shown).
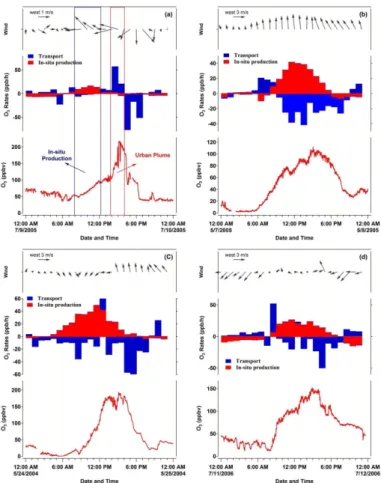
We are particularly interested in knowing the relative role of in-situ photochemistry and transport in the extremely high ozone levels (up to the hourly value of 286 ppbv) observed at CP, a rural site downwind of Beijing. As shown in Fig. 5a, the in-situ
pho-5
tochemical production clearly dominated the ozone accumulation (i.e., from ∼40 to
∼100 ppbv) from early morning (6:00–7:00 LT) to noon (12:00 LT). In the afternoon, however, the O3mixing ratios increased sharply from ∼100 ppbv to∼220 ppbv within
less than two hours (14:00–15:00 LT), which cannot be explained by the local produc-tion. At that time, the in-situ ozone production had been weakened due to the relatively
10
low levels of VOCs and NOx(see Sect. 3.1). Thus such a sharp increase of ozone was attributed to the transport of urban plumes from Beijing that had undergone extensive photochemical processing and contained high amounts of produced ozone. This was a very typical case at CP in summer and can be reflected by the sharper O3increase at 14:00–16:00 LT in the campaign-average O3 diurnal patterns (Fig. 2a). These
re-15
sults highlight the efficient export of Beijing urban pollution in the afternoon, which can adversely affect the vegetation and crop production in downwind areas.
In comparison, the in-situ photochemical production dominated the O3accumulation
throughout the daytime at suburban sites downwind of Shanghai, Guangzhou, and Lanzhou. Very strong ozone production (up to 40 ppbv h−1) was determined during
20
episodes at these sites. Regional transport generally made a negative contribution (i.e., export) to the observed ozone pollution. This indicates that the air masses at these sites were reactive enough to sustain the observed ozone increase and even had potential to export the produced ozone to downwind regions. In the next section, we further examine the sensitivities of in-situ O3production to the major O3precursors
25
ACPD
13, 27243–27285, 2013Ozone production in four major cities of
China
L. K. Xue et al.
Title Page
Abstract Introduction
Conclusions References
Tables Figures
◭ ◮
◭ ◮
Back Close
Full Screen / Esc
Printer-friendly Version Interactive Discussion
Discussion
P
a
per
|
D
iscussion
P
a
per
|
Discussion
P
a
per
|
Discuss
ion
P
a
per
|
3.3 Sensitivity to ozone precursors
Figure 6 shows the OBM-calculated daytime average RIRs for AHC, BHC, CO, and NOx
during the selected O3episodes at Taicang, WQS and RSP, and Fig. 7 shows the RIRs
for the four AHC sub-groups. Overall, the ozone formation regimes were consistent among cases for each site but different among sites.
5
3.3.1 Shanghai – aromatics- and alkenes-controlled
For the episodes observed at Taicang, the in-situ ozone production was found to be highly VOC-sensitive, specifically AHC-controlled. Within the AHC, reactive aromatics dominated and alkenes also made a significant contribution. The RIRs for NOx were
generally negative except for the 7 May 2005 episode when it was essentially near zero.
10
This suggests that reducing emissions of aromatics and/or alkenes would facilitate the mitigation of ozone pollution, yet reduction in NOxemissions may aggravate the ozone
problem.
The current knowledge on the ozone production regime in Shanghai is primarily from the measurements made by Ran et al. (2009, 2012). Based on the measurements at
15
both an urban (Xujiahui) and a suburban site (Jinshan), they reported the predominant role of aromatics in the VOC reactivity and ozone formation potentials in Shanghai. The results obtained at Taicang in the present study agree in part with them on the significance of aromatics, but also reveal the important contribution from alkenes. This difference may be due to the different local VOC emissions near the study sites and/or
20
the fact that ethene was not measured in Ran et al. (2009, 2012) but was included in our study. Despite the relatively low reactivity, the high abundances still made ethene the second most important reactive hydrocarbon species at our study site (see Table 2), and ethene alone made a considerable contribution to the hydrocarbon reactivity and ozone formation. Future measurements should include ethene in order to fully
under-25
ACPD
13, 27243–27285, 2013Ozone production in four major cities of
China
L. K. Xue et al.
Title Page
Abstract Introduction
Conclusions References
Tables Figures
◭ ◮
◭ ◮
Back Close
Full Screen / Esc
Printer-friendly Version Interactive Discussion
Discussion
P
a
per
|
D
iscussion
P
a
per
|
Discussion
P
a
per
|
Discuss
ion
P
a
per
|
3.3.2 Guangzhou – aromatics-dominated
At WQS, the AHC was also the most limiting precursor in producing ozone (Fig. 6). Among the AHC, reactive aromatics were the predominant sub-group (Fig. 7). The RIRs for NOx were negative or near zero. Most previous studies in the PRD region have demonstrated the dominant role of aromatics in ozone formation in the autumn
5
season due to the wide usage of industrial solvents (Chan et al., 2006; Zhang et al., 2007; Liu et al., 2008). The ozone production regime determined in late spring at WQS is in line with the findings of the previous studies in autumn. This consistency also implies the homogeneous ozone formation chemistry in the PRD region and in typical ozone pollution seasons.
10
3.3.3 Lanzhou – mixed regime and the role of petrochemical industry
At RSP, the ozone formation was in a mixed regime with high RIRs calculated for both NOx and hydrocarbons (Fig. 6). And in general NOx showed higher RIRs than
hy-drocarbons. Alkenes were the most important AHC compounds responsible for the ozone production (Fig. 7). In particular, light olefins such as propene and ethene were
15
the most abundant reactive species, both of which presented approximately half of the AHC reactivity (see Table 2). Such high levels of olefins are attributable to the industrial structure of Lanzhou. Lanzhou is a well-known petrochemical city in western China with the CNPC (China National Petroleum Corporation) Lanzhou Petrochemical Company and many small petrochemical plants located in its Xigu District. Light olefins are major
20
components of emissions from the petrochemical plants (Ryerson et al., 2003). The mixed ozone formation regime implies a more flexible control strategy of ozone pollu-tion in Lanzhou. Either reducing emissions of olefins (from the petrochemical plants) or cutting the NOx emissions (from petrochemical and power plants and vehicles) could
result in an efficient decrease in ozone formation. Furthermore, reducing NOx
emis-25
ACPD
13, 27243–27285, 2013Ozone production in four major cities of
China
L. K. Xue et al.
Title Page
Abstract Introduction
Conclusions References
Tables Figures
◭ ◮
◭ ◮
Back Close
Full Screen / Esc
Printer-friendly Version Interactive Discussion
Discussion
P
a
per
|
D
iscussion
P
a
per
|
Discussion
P
a
per
|
Discuss
ion
P
a
per
|
mitigating the ozone pollution, as suggested by the relatively higher RIRs of NOxthan AHC.
Applicability of the results: it is noteworthy that the present analyses are only based on the measurements at certain locales of target cities and during several ozone pol-lution episodes, thus the applicability of the results may be spatially and/or temporally
5
limited. Actually, this limitation is inherent to such kind of studies based on observa-tions at limited staobserva-tions and/or during relatively short periods. Nonetheless, the present study should be a good effort as a cross-region comparative study since the same measurement techniques and chemical model are deployed. The findings will enrich the current understandings of the ozone chemistry in major cities of China, especially
10
for Lanzhou and Shanghai where such kind of studies were relatively scarce. Further studies with extensive spatial and temporal coverage are needed to fully address the ozone pollution chemistry in large cities of China.
3.4 Sensitivity to heterogeneous processes
In this section, we assess the potential impacts of several poorly-understood
hetero-15
geneous processes on the ozone photochemistry by incorporating them in the model and conducting sensitivity analyses.
3.4.1 N2O5hydrolysis
The N2O5 hydrolysis may affect ozone production as (1) it serves as an important Ox
sink pathway (hydrolysis of each N2O5destroys three molecules of Ox, i.e., 2 NO2and
20
1 O3); and (2) nitryl chloride (ClNO2), a hydrolysis product that usually accumulates at night, can enhance the next-day’s ozone production through releasing both a chlorine atom (Cl) and NO2by photolysis (Cl can oxidize hydrocarbons and thus promote ozone
formation). The hydrolysis rate is considered to be first order in the N2O5concentration (Chang et al., 2011). In the present study, this process is parameterized in the MCM
ACPD
13, 27243–27285, 2013Ozone production in four major cities of
China
L. K. Xue et al.
Title Page
Abstract Introduction
Conclusions References
Tables Figures
◭ ◮
◭ ◮
Back Close
Full Screen / Esc
Printer-friendly Version Interactive Discussion
Discussion
P
a
per
|
D
iscussion
P
a
per
|
Discussion
P
a
per
|
Discuss
ion
P
a
per
|
model as follows.
N2O5→(2−φ)·NO−3+φ·ClNO2 k10 (R10)
where,φis the production yield of ClNO2, andk10 is the first order rate constant and can be estimated by
k10=
1
4×vN2O5×γN2O5×Saero (3)
5
wherevN2O5 is the mean molecular speed of N2O5 and is calculated from gas kinetic
theory (Aldener et al., 2006);γN2O5 is the reactive uptake coefficient of N2O5on particle
surfaces;Saero is the surface area concentration of aerosols and is calculated based
on the measured particle number size distributions. The current uncertainty of this process primarily lies in the uptake coefficient of N2O5 (γN2O5) and production yield
10
of ClNO2 (φ), which are highly variable and dependent on the aerosol composition,
humidity, and temperature (Chang et al., 2011).TheγN2O5 derived on real atmospheric
particles from limited available field measurements were in the range of 0–0.04, while the range determined on a variety of “pure” aerosols in the laboratory was relatively larger (e.g., 0–0.1) (Chang et al., 2011, and references therein). In the present study,
15
we chose a moderate value ofγN2O5=0.03 with no production of ClNO2(φ=0) in the
base model. Sensitivity model runs were conducted with a higherγN2O5 (0.1) and also
with different production yields of ClNO2(φ=0.1 and 0.6).
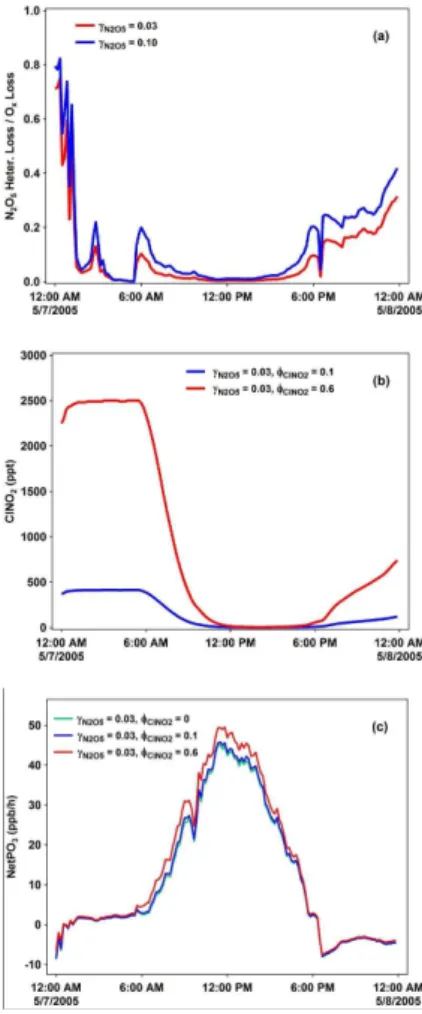
The potential impacts of N2O5hydrolysis on ozone production are illustrated in Fig. 8 (with the results on 7 May 2005 in Shanghai as an example). The heterogeneous loss
20
of N2O5 on aerosols indeed represents an important Ox loss pathway at nighttime
(e.g., up to 75 % and 80 % atγN
2O5=0.03 and 0.1), but is only of minor importance during the daytime (e.g.,<4 % at both γN2O5 values; see Fig. 8a). Varying the γN2O5
value to 0.1 only resulted in changes of<3 % in the calculated net ozone production rates compared to the base run. Thus the Ox loss via N2O5hydrolysis should be less
25
ACPD
13, 27243–27285, 2013Ozone production in four major cities of
China
L. K. Xue et al.
Title Page
Abstract Introduction
Conclusions References
Tables Figures
◭ ◮
◭ ◮
Back Close
Full Screen / Esc
Printer-friendly Version Interactive Discussion
Discussion
P
a
per
|
D
iscussion
P
a
per
|
Discussion
P
a
per
|
Discuss
ion
P
a
per
|
However, the ClNO2 produced/accumulated via N2O5 hydrolysis at night may con-siderably enhance the next-day’s daytime ozone production. For example, a sensitivity model run with a lower production yield (φ=0.1) showed a nighttime ClNO2 level of
∼400 pptv and only∼3 % increase in the daytime-averaged net ozone production rate, but that with a higher production yield (φ=0.6) could give∼2500 pptv of ClNO2 and
5
∼14 % increase in ozone production (see Figs. 8b and 8c). This indicates that the nighttime heterogeneous process involving N2O5 is a considerable uncertainty in the current understanding of ozone photochemistry. Clearly, in-situ measurements of N2O5
and ClNO2are urgently required to better understand this process and to provide more
realistic parameterizations ofγN
2O5 and φ which can be adopted in air quality
mod-10
els. We also conducted sensitivity model runs with 20 % reduction in NOx or AHC at φ=0.6 and the ozone formation regimes estimated from the base runs remained.
3.4.2 Uptake of HO2by particles
The heterogeneous loss of HO2 on particle surfaces can act as an efficient radical sink at high aerosol loadings and hence attenuate the ozone production (Kanaya et al.,
15
2009). This process was included in the model by adding the following reaction.
HO2→products k12 (R12)
The reaction rate was assumed to be first order of the HO2 concentrations.k12 is the reaction constant that can be calculated by
k12=−
r Dg+
4 γHO2×vHO2
!−1
Saero (4)
20
wherer is the surface-weighted particle radius;Dgis the gas phase diffusion coefficient
and is assumed to be 0.247 cm2s−1(Mozurkewich et al., 1987);γHO2 is the uptake
co-efficient of HO2 on particles; vHO
ACPD
13, 27243–27285, 2013Ozone production in four major cities of
China
L. K. Xue et al.
Title Page
Abstract Introduction
Conclusions References
Tables Figures
◭ ◮
◭ ◮
Back Close
Full Screen / Esc
Printer-friendly Version Interactive Discussion
Discussion
P
a
per
|
D
iscussion
P
a
per
|
Discussion
P
a
per
|
Discuss
ion
P
a
per
|
the aerosol surface area concentration. In the present study,r and Saero were calcu-lated based on the measurement data of particle number size distributions. Similar to N2O5 hydrolysis, the uptake coefficient (γHO2) is a parameter with large uncertainty
and is related to aerosol composition, temperature, and RH (Thornton et al., 2008). The laboratory studies determined theγHO2 in the range of 0.01–0.2 for different types
5
of non-metal aerosols at room temperature, with much higher values (>0.2) measured on the Cu-doped aqueous surfaces (Mao et al., 2010, and references therein). Take-tani et al. (2012) recently reported relatively largeγHO2 values for ambient aerosols at
Mt. Tai (0.13–0.34) and Mt. Mang (0.09–0.40) in China by regenerating the particles sampled on the quartz filter in the lab. Here we adopted a value ofγHO
2=0.02 in the
10
base model, and changed it to 0.2 and 0.4 for the sensitivity runs.
The model-predicted net ozone production rates with differentγHO2values are shown
in Fig. 9 (also with the results on 7 May 2005 in Shanghai as an example). Increas-ing theγHO2 would lead to considerable reductions in the net ozone production. For
instance, the daytime average net ozone production rates dropped∼7 % and ∼13 %
15
whenγHO2=0.2 andγHO2 =0.4 compared to the base run (γHO2=0.02). This means
that the uptake of HO2presents another large source of uncertainty in current studies of ozone chemistry, and more studies are needed to quantify the ambientγHO2 values
in areas with high aerosol loading such as China. To check the possible interference of the assumed γHO2 value (i.e., 0.02) on the ozone formation regimes as discussed
20
in Sect. 3.3, additional sensitivity model runs were conducted with 20 % reduction in NOx or AHC atγHO2=0.2. The results suggest that the ozone formation regimes
esti-mated from the base runs (γHO2=0.02) generally hold at highγHO2 values (figures not
shown).
3.4.3 Heterogeneous reactions of NO2forming HONO
25
ACPD
13, 27243–27285, 2013Ozone production in four major cities of
China
L. K. Xue et al.
Title Page
Abstract Introduction
Conclusions References
Tables Figures
◭ ◮
◭ ◮
Back Close
Full Screen / Esc
Printer-friendly Version Interactive Discussion
Discussion
P
a
per
|
D
iscussion
P
a
per
|
Discussion
P
a
per
|
Discuss
ion
P
a
per
|
only considering the homogeneous source from the OH+NO reaction (e.g., Su et al., 2008, 2011). It has been suggested that the photo-enhanced heterogeneous reactions of NO2on various surfaces should be an important source of HONO (Su et al., 2008;
Li et al., 2010). In the present study, HONO was not measured but simulated within the model. In addition to the homogeneous source, the heterogeneous sources from
reac-5
tions of NO2 on the ground and aerosol surfaces were also taken into account in the
base model by adopting the parameterizations used by Li et al. (2010). The reaction rates were assumed to be first order in the NO2 concentration (Aumont et al., 2003),
and the processes were simplified as follows.
NO2→HONO kg (R13)
10
NO2→HONO ka (R14)
kgandkaare the first order rate constants for the ground and aerosol surface reactions, and can be estimated as
kg=
1
8×vNO2×γg×
S V
(5)
ka=1
4×vNO2×γa×Saero (6)
15
wherevNO
2is the mean molecular speed of NO2;γgandγaare the uptake coefficients of NO2on the ground and aerosol surfaces;S/V is the effective surface density of the
ground, and Saero is the aerosol surface area concentration. Considering the photo-enhanced production of HONO from the surface reactions (George, 2005; Monge et al.,
20
2010), higher values ofγg andγa were used during the daytime than at night. Forγg,
we used a value ofγg=1×10− 6
at nighttime, and increased it to 2×10⁻⁵ during the daytime with solar radiation less than 400 W m−2. With more intense solar radiation, a higher γg value of 2×10−
5
×(solar radiation/400) was used. As to γa, we chose
a value of γa=1×10− 6
at nighttime, and increased it to 5×10⁻⁶ during the day. An
ACPD
13, 27243–27285, 2013Ozone production in four major cities of
China
L. K. Xue et al.
Title Page
Abstract Introduction
Conclusions References
Tables Figures
◭ ◮
◭ ◮
Back Close
Full Screen / Esc
Printer-friendly Version Interactive Discussion
Discussion
P
a
per
|
D
iscussion
P
a
per
|
Discussion
P
a
per
|
Discuss
ion
P
a
per
|
effective surface area of 1.7 m2 per geometric ground surface was used to calculate theS/V (Vogel et al., 2003).
We also conducted a sensitivity model run with only the homogeneous HONO source, which is the case of most current atmospheric models. The results are shown in Fig. 10 (with those on 24 May 2004 in Guangzhou as an example). We can see that
5
including heterogeneous reactions of NO2 indeed produces more HONO (Fig. 10a), which in turn can significantly enhance the ozone photochemical production (∼13 %; see Fig. 10b). This suggests that the heterogeneous processes of NO2play an
impor-tant role in atmospheric photochemistry and need to be included in air quality models. In-situ measurements of HONO, which were not available in China until recent years,
10
have shown surprisingly elevated daytime concentrations of HONO (up to the ppb level) in the PRD region (e.g., Su et al., 2008). Such high levels of daytime HONO cannot be explained by only including the above heterogeneous reactions of NO2, and some
additional sources have been proposed (e.g., Su et al., 2011). It is not known if this phenomenon was also the case at our study sites, however the identification of
addi-15
tional HONO source(s) and quantification of its impacts are beyond the scope of the present study. The analyses presented here clearly indicate that the surface reactions involving NO2at least present an important HONO source and can enhance the ozone production. Undoubtedly, in-situ measurements of HONO are critical for better under-standing the atmospheric photochemistry including ozone formation, and further efforts
20
are needed to determine the “missing” source(s).
4 Summary
Measurements of O3, O3precursors and related parameters were made at a rural site
of Beijing and suburban sites downwind of Shanghai, Guangzhou and Lanzhou. The data were analyzed with the aid of a MCM-based, observation-constrained chemical
25
ACPD
13, 27243–27285, 2013Ozone production in four major cities of
China
L. K. Xue et al.
Title Page
Abstract Introduction
Conclusions References
Tables Figures
◭ ◮
◭ ◮
Back Close
Full Screen / Esc
Printer-friendly Version Interactive Discussion
Discussion
P
a
per
|
D
iscussion
P
a
per
|
Discussion
P
a
per
|
Discuss
ion
P
a
per
|
1. The four cities suffered from serious ozone problems. At the rural site downwind of Beijing, transport of “aged” urban plumes resulted in hourly ozone levels up to 286 ppbv. At suburban sites downwind of Shanghai, Guangzhou and Lanzhou, the observed ozone accumulation was dominated by the intense in-situ photo-chemical production.
5
2. The hydrocarbon speciation was different among the sites/cities. The domi-nant anthropogenic hydrocarbon species were alkenes in Lanzhou, aromatics in Guangzhou, and both alkenes and aromatics in Beijing and Shanghai.
3. The ozone production during ozone episodes was in a VOCs-limited regime in Shanghai and Guangzhou, and a mixed regime in Lanzhou. In Shanghai, the
10
ozone production was most sensitive to aromatics and alkenes. In Guangzhou, it was most sensitive to the aromatics. In Lanzhou, either cutting emissions of olefins from the petrochemical plants or reducing NOxwould decrease the ozone
production.
4. Heterogeneous processes including N2O5hydrolysis, uptake of HO2on aerosols,
15
and surface reactions of NO2are considerable sources of uncertainty in the cur-rent understanding of ozone photochemistry. Further efforts are urgently needed to determine these processes and improve air quality models.
Supplementary material related to this article is available online at http://www.atmos-chem-phys-discuss.net/13/27243/2013/
20
acpd-13-27243-2013-supplement.pdf.
Acknowledgements. The authors are grateful to Steven Poon, Waishing Wu, and Jiamin Zhang
for their contributions to the field work, and to Tijian Wang and Jie Tang for their help in selecting the study sites. We would like to thank the Master Chemical Mechanism group in University of Leeds for providing the mechanism. The field measurements were funded in part by the
ACPD
13, 27243–27285, 2013Ozone production in four major cities of
China
L. K. Xue et al.
Title Page
Abstract Introduction
Conclusions References
Tables Figures
◭ ◮
◭ ◮
Back Close
Full Screen / Esc
Printer-friendly Version Interactive Discussion
Discussion
P
a
per
|
D
iscussion
P
a
per
|
Discussion
P
a
per
|
Discuss
ion
P
a
per
|
Research Grants Council of Hong Kong (PolyU5144/04E), and data analysis were supported by the Hong Kong Polytechnic University (1-BB94 and 1-ZV9N) and the Research Grants Council of Hong Kong (PolyU5015/12P).
References
Aldener, M., Brown, S., Stark, H., Williams, E., Lerner, B., Kuster, W., Goldan, P., Quinn, P.,
5
Bates, T., and Fehsenfeld, F.: Reactivity and loss mechanisms of NO3 and N2O5 in a pol-luted marine environment: results from in situ measurements during New England Air Quality Study 2002, J. Geophys. Res., 111, D23S73, doi:10.1029/2006JD007252, 2006.
Aumont, B., Chervier, F., and Laval, S.: Contribution of HONO sources to the NOx/HOx/O3 chemistry in the polluted boundary layer, Atmos. Environ., 37, 487–498, 2003.
10
Brown, S. S., Ryerson, T. B., Wollny, A. G., Brock, C. A., Peltier, R., Sullivan, A. P., Weber, R. J., Dube, W. P., Trainer, M., Meagher, J. F., Fehsenfeld, F. C., and Ravishankara, A. R.: Variability in nocturnal nitrogen oxide processing and its role in regional air quality, Science, 311, 67– 70, 2006.
Cardelino, C. A. and Chameides, W. L.: An observation-based model for analyzing ozone
pre-15
cursor relationships in the urban atmosphere, J. Air Waste Manage, 45, 161–180, 1995. Chan, C. K. and Yao, X.: Air pollution in mega cities in China, Atmos. Environ., 42, 1–42, 2008. Chan, L. Y., Chu, K. W., Zou, S. C., Chan, C. Y., Wang, X. M., Barletta, B., Blake, D. R.,
Guo, H., and Tsai, W. Y.: Characteristics of nonmethane hydrocarbons (NMHCs) in industrial, industrial-urban, and industrial-suburban atmospheres of the Pearl River Delta (PRD) region
20
of south China, J. Geophys. Res.-Atmos., 111, D11304, doi:10.1029/2005JD006481, 2006. Chang, W. L., Bhave, P. V., Brown, S. S., Riemer, N., Stutz, J., and Dabdub, D.: Heterogeneous
atmospheric chemistry, ambient measurements, and model calculations of N2O5: a review, Aerosol Sci Tech., 45, 665–695, 2011.
Cheung, T. F. and Wang, T.: Observational study of ozone pollution in a rural site in the Yangtze
25
Delta of China, Atmos. Environ., 35, 4947–4958, 2001.
ACPD
13, 27243–27285, 2013Ozone production in four major cities of
China
L. K. Xue et al.
Title Page
Abstract Introduction
Conclusions References
Tables Figures
◭ ◮
◭ ◮
Back Close
Full Screen / Esc
Printer-friendly Version Interactive Discussion
Discussion
P
a
per
|
D
iscussion
P
a
per
|
Discussion
P
a
per
|
Discuss
ion
P
a
per
|
Ding, A. J., Wang, T., Thouret, V., Cammas, J.-P., and Nédélec, P.: Tropospheric ozone clima-tology over Beijing: analysis of aircraft data from the MOZAIC program, Atmos. Chem. Phys., 8, 1–13, doi:10.5194/acp-8-1-2008, 2008.
Ding, A. J., Fu, C. B., Yang, X. Q., Sun, J. N., Zheng, L. F., Xie, Y. N., Herrmann, E., Nie, W., Petäjä, T., Kerminen, V.-M., and Kulmala, M.: Ozone and fine particle in the western Yangtze
5
River Delta: an overview of 1 yr data at the SORPES station, Atmos. Chem. Phys., 13, 5813– 5830, doi:10.5194/acp-13-5813-2013, 2013.
Gao, J., Wang, T., Zhou, X. H., Wu, W. S., and Wang, W. X.: Measurement of aerosol number size distributions in the Yangtze River delta in China: formation and growth of particles under polluted conditions, Atmos. Environ., 43, 829–836, 2009.
10
George, C., Strekowski, R., Kleffmann, J., Stemmler, K., and Ammann, M.: Photoenhanced uptake of gaseous NO2 on solid organic compounds: a photochemical source of HONO?, Faraday Discuss., 130, 195–210, 2005.
Jacob, D. J.: Introduction to Atmospheric Chemistry, Princeton University Press, New Jersey, 1999.
15
Jenkin, M. E., Saunders, S. M., Wagner, V., and Pilling, M. J.: Protocol for the development of the Master Chemical Mechanism, MCM v3 (Part B): tropospheric degradation of aromatic volatile organic compounds, Atmos. Chem. Phys., 3, 181–193, doi:10.5194/acp-3-181-2003, 2003.
Kanaya, Y., Pochanart, P., Liu, Y., Li, J., Tanimoto, H., Kato, S., Suthawaree, J., Inomata, S.,
20
Taketani, F., Okuzawa, K., Kawamura, K., Akimoto, H., and Wang, Z. F.: Rates and regimes of photochemical ozone production over Central East China in June 2006: a box model analysis using comprehensive measurements of ozone precursors, Atmos. Chem. Phys., 9, 7711–7723, doi:10.5194/acp-9-7711-2009, 2009.
Kleinman, L. I., Daum, P. H., Imre, D., Lee, Y. N., Nunnermacker, L. J., Springston, S. R.,
25
Weinstein-Lloyd, J., and Rudolph, J.: Ozone production rate and hydrocarbon reactivity in 5 urban areas: a cause of high ozone concentration in Houston, Geophys. Res. Lett., 30, 1639, doi:10.1029/2003GL017485, 2003.
Li, G., Lei, W., Zavala, M., Volkamer, R., Dusanter, S., Stevens, P., and Molina, L. T.: Impacts of HONO sources on the photochemistry in Mexico City during the MCMA-2006/MILAGO
30
ACPD
13, 27243–27285, 2013Ozone production in four major cities of
China
L. K. Xue et al.
Title Page
Abstract Introduction
Conclusions References
Tables Figures
◭ ◮
◭ ◮
Back Close
Full Screen / Esc
Printer-friendly Version Interactive Discussion
Discussion
P
a
per
|
D
iscussion
P
a
per
|
Discussion
P
a
per
|
Discuss
ion
P
a
per
|
Liu, Y., Shao, M., Lu, S., Chang, C., Wang, J., and Chen, G.: Volatile Organic Compound (VOC) measurements in the Pearl River Delta (PRD) region, China, Atmos. Chem. Phys., 8, 1531– 1545, doi:10.5194/acp-8-1531-2008, 2008.
Liu, Z., Wang, Y., Gu, D., Zhao, C., Huey, L. G., Stickel, R., Liao, J., Shao, M., Zhu, T., Zeng, L., Amoroso, A., Costabile, F., Chang, C.-C., and Liu, S.-C.: Summertime photochemistry during
5
CAREBeijing-2007: ROx budgets and O3 formation, Atmos. Chem. Phys., 12, 7737–7752, doi:10.5194/acp-12-7737-2012, 2012.
Lu, K. D., Zhang, Y. H., Su, H., Brauers, T., Chou, C. C., Hofzumahaus, A., Liu, S. C., Kita, K., Kondo, Y., Shao, M., Wahner, A., Wang, J. L., Wang, X. S., and Zhu, T.: Oxidant (O3+
NO2) production processes and formation regimes in Beijing, J. Geophys. Res.-Atmos., 115,
10
D07303, doi:10.1029/2009JD012714, 2010.
Mao, J., Jacob, D. J., Evans, M. J., Olson, J. R., Ren, X., Brune, W. H., Clair, J. M. St., Crounse, J. D., Spencer, K. M., Beaver, M. R., Wennberg, P. O., Cubison, M. J., Jimenez, J. L., Fried, A., Weibring, P., Walega, J. G., Hall, S. R., Weinheimer, A. J., Co-hen, R. C., CCo-hen, G., Crawford, J. H., McNaughton, C., Clarke, A. D., Jaeglé, L., Fisher, J. A.,
15
Yantosca, R. M., Le Sager, P., and Carouge, C.: Chemistry of hydrogen oxide radicals (HOx) in the Arctic troposphere in spring, Atmos. Chem. Phys., 10, 5823–5838, doi:10.5194/acp-10-5823-2010, 2010.
Monge, M. E., D’Anna, B., Mazri, L., Giroir-Fendler, A., Ammann, M., Donaldson, D. J., and George, C.: Light changes theatmospheric reactivity of soot, P. Natl. Acad. Sci. USA, 107,
20
6605–6609, 2010.
Molina, M. J. and Molina, L. T.: Megacities and atmospheric pollution, J. Air Waste Manage., 54, 644–680, 2004.
Mozurkewich, M., McMurry, P. H., Gupta, A., and Calvert, J. G.: Mass accommodation coeffi -cient of HO2on aqueous particles, J. Geophys. Res., 92, 4163–4170, 1987.
25
Ohara, T., Akimoto, H., Kurokawa, J., Horii, N., Yamaji, K., Yan, X., and Hayasaka, T.: An Asian emission inventory of anthropogenic emission sources for the period 1980–2020, Atmos. Chem. Phys., 7, 4419–4444, doi:10.5194/acp-7-4419-2007, 2007.
Parrish, D. D. and Zhu, T.: Clean air for megacities, Science, 326, 674–675, 2009.
Pathak, R. K., Wu, W. S., and Wang, T.: Summertime PM2.5ionic species in four major cities of
30