www.hydrol-earth-syst-sci.net/16/3607/2012/ doi:10.5194/hess-16-3607-2012
© Author(s) 2012. CC Attribution 3.0 License.
Earth System
Sciences
A bare ground evaporation revision in the ECMWF land-surface
scheme: evaluation of its impact using ground soil moisture and
satellite microwave data
C. Albergel, G. Balsamo, P. de Rosnay, J. Mu ˜noz-Sabater, and S. Boussetta
European Centre for Medium-Range Weather Forecasts (ECMWF), Reading, UK
Correspondence to:C. Albergel ([email protected])
Received: 14 May 2012 – Published in Hydrol. Earth Syst. Sci. Discuss.: 30 May 2012 Revised: 15 August 2012 – Accepted: 18 September 2012 – Published: 16 October 2012
Abstract.In situ soil moisture data from 122 stations across the United States are used to evaluate the impact of a new bare ground evaporation formulation at ECMWF. In Novem-ber 2010, the bare ground evaporation used in ECMWF’s op-erational Integrated Forecasting System (IFS) was enhanced by adopting a lower stress threshold than for the vegetation, allowing a higher evaporation. It results in more realistic soil moisture values when compared to in situ data, particularly over dry areas. Use was made of the operational IFS and of-fline experiments for the evaluation. The latter are based on a fixed version of the IFS and make it possible to assess the impact of a single modification, while the operational anal-ysis is based on a continuous effort to improve the analy-sis and modelling systems, resulting in frequent updates (a few times a year). Considering the field sites with a frac-tion of bare ground greater than 0.2, the root mean square difference (RMSD) of soil moisture is shown to decrease from 0.118 m3m−3 to 0.087 m3m−3 when using the new
formulation in offline experiments, and from 0.110 m3m−3
to 0.088 m3m−3 in operations. It also improves
correla-tions. Additionally, the impact of the new formulation on the terrestrial microwave emission at a global scale is investi-gated. Realistic and dynamically consistent fields of bright-ness temperature as a function of the land surface conditions are required for the assimilation of the SMOS data. Bright-ness temperature simulated from surface fields from two of-fline experiments with the Community Microwave Emission Modelling (CMEM) platform present monthly mean differ-ences up to 7 K. Offline experiments with the new formula-tion present drier soil moisture, hence simulated brightness temperature with its surface fields are larger. They are also closer to SMOS remotely sensed brightness temperature.
1 Introduction
Soil moisture plays a fundamental role in the partitioning of mass and energy fluxes between the hydrosphere, bio-sphere and atmobio-sphere because it controls both evaporation and transpiration fluxes from bare soil and vegetated areas, respectively. In addition, it is a key variable in hydrolog-ical processes (i.e. runoff, evaporation from bare soil and transpiration from the vegetation cover) and has an impact on plant growth and carbon fluxes (Dirmeyer et al., 1999; Entekhabi et al., 1999). Its initialisation is of crucial im-portance for Numerical Weather Prediction (NWP) models and this topic has been extensively explored in the literature (e.g. Shukla and Mintz, 1982; Dirmeyer, 2002; Douville et al., 2001); soil moisture might play a role in meteorological forecasting (Seneviratne et al., 2010).
2012) and in several initiatives on the Drought Early Warn-ing (DEW) information services worldwide (WMO, Drought monitoring and early warning, 2006). Many studies have fo-cused on the coupled bare soil-canopy processes and the ability of land surface models to simulate bare soil pro-cesses has also been of interest (Desborough et al., 1996). Albergel et al. (2012a, b) demonstrated the good quality of the European Centre for Medium-Range Weather Forecasts (ECMWF) soil moisture products with respect to global-ground based in situ observations. They found good level of correlations despite the high values of root mean square dif-ference (RMSD), which indicate that ECMWF products tend to overestimate soil moisture, particularly over dry areas. To overcome this problem, an improved bare ground evapora-tion scheme over dry land (Balsamo et al., 2011) was imple-mented in ECMWF’s Integrated Forecasting System (IFS) in November 2010. It is expected that the new scheme will reduce the soil moisture over bare soil by enhancing evapora-tion, resulting in more realistic soil moisture when compared to in situ data. Because the improved bare ground evapora-tion was implemented in 2010, along with other modifica-tions affecting soil moisture (e.g. an Extended Kalman Fil-ter for soil moisture analysis, de Rosnay et al., 2011, 2012), it is difficult to isolate the impact of the new evaporation scheme. For this reason, offline experiments were carried out with and without the new bare ground evaporation to anal-yse the impact of the specific modification. This study aims at evaluating the impact of this new evaporation scheme on soil moisture.
In the framework of the Soil Moisture and Ocean Salinity (SMOS, Kerr, 2007; Kerr et al., 2010) mission, ECMWF is implementing the direct assimilation of near real time bright-ness temperature (TB) in the L-band (Sabater et al., 2012). It will only be effective if realistic and dynamically consis-tent fields of TB are simulated as a function of land-surface conditions. At ECMWF, the Community Microwave Emis-sion Modelling platform (CMEM, Holmes et al., 2008; Dr-usch et al., 2009a; de Rosnay et al., 2009) is used to simulate TB. Surface soil moisture is, amongst other surface fields, coupled with CMEM to produce ECMWF’s first-guess TB. The main objective of this study is to evaluate the new evap-oration formulation on soil moisture; however, as the im-proved bare ground evaporation is expected to affect surface fields such as soil moisture, it also assesses its impact on simulated TB.
After a description of the ECMWF’s analysis and soil moisture products used in this study, the new bare ground evaporation formulation is presented followed by a descrip-tion of the in situ observadescrip-tions required to evaluate soil mois-ture analyses. Next, the CMEM platform is briefly described along with the remotely-sensed SMOS TB data set. Then the impact of the improved bare ground evaporation is assessed using (i) two offline experiments and (ii) ECMWF’s opera-tional IFS and in situ soil moisture data for the period 2010– 2011 (only 2010 for the offline experiments). Finally,
sur-face soil moisture and soil temperature fields, as well as snow depth and density fields from the two offline experiments, are coupled with the CMEM platform to simulate the TB data set at a global scale; they permit the study of the sensitivity of CMEM to the new bare ground evaporation. Finally, the two TB data sets are compared to SMOS TB observations for the year 2010.
2 Material and methods
In situ soil moisture observations are important for evaluat-ing soil moisture products. In this study use was made of soil moisture data from the NRCS-SCAN network (Natural Re-sources Conservation Service – Soil Climate Analysis Net-work) in the United States (Schaefer and Paetzold, 2000). They were obtained through the International Soil Moisture Network (ISMN, Dorigo et al., 2011, http://www.ipf.tuwien. ac.at/insitu/), a new data hosting centre where globally avail-able ground-based soil moisture measurements are collected, harmonized and made available to users. Data at 148 sta-tions in 2010 and 2011 were used to evaluate soil moisture from offline experiments and the operational IFS. The soil moisture data sets used in this study are presented in Table 1. 2.1 ECMWF’s land surface analysis
Data produced at ECMWF include a large variety of surface parameters that describe the atmosphere as well as ocean-wave and land-surface conditions (more information at: http: //www.ecmwf.int/products/). The core atmospheric assimila-tion system at ECMWF relies on the four-dimensional varia-tional (4D-Var) data assimilation scheme described in Rabier et al. (2000) and Mahfouf and Rabier (2000). It has an ob-servation time frame of 12 h (Bouttier, 2001). Data provided by satellite sensors (from microwave and infrared radiome-ters) as well as conventional observations (e.g. radiosonde network) are ingested within the 4D-Var. Use is also made of surface observations such as surface pressure, humidity and wind.
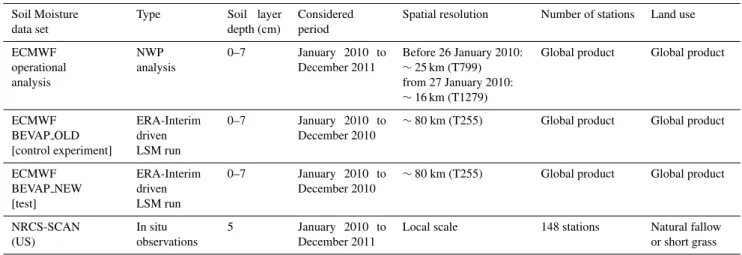
Table 1.The soil moisture products used in this study. NWP stands for numerical weather prediction and LSM for land-surface model.
Soil Moisture data set
Type Soil layer depth (cm)
Considered period
Spatial resolution Number of stations Land use
ECMWF operational analysis
NWP analysis
0–7 January 2010 to December 2011
Before 26 January 2010:
∼25 km (T799) from 27 January 2010:
∼16 km (T1279)
Global product Global product
ECMWF BEVAP OLD [control experiment]
ERA-Interim driven LSM run
0–7 January 2010 to December 2010
∼80 km (T255) Global product Global product
ECMWF BEVAP NEW [test]
ERA-Interim driven LSM run
0–7 January 2010 to December 2010
∼80 km (T255) Global product Global product
NRCS-SCAN (US)
In situ observations
5 January 2010 to December 2011
Local scale 148 stations Natural fallow or short grass
in the IFS (Drusch et al., 2009b; de Rosnay et al., 2011, 2012) in November 2010.
The model forecast for the land surface analysis is pro-vided by the TESSEL land surface scheme (Van den Hurk et al., 2000), which was then upgraded to H-TESSEL (Van den Hurk and Viterbo, 2003; Balsamo et al., 2009) with an improved soil hydrology. H-TESSEL development was a re-sponse to weaknesses in the TESSEL hydrology–a Horto-nian runoff scheme hardly producing surface runoff while the choice of a single global soil texture was not able to char-acterize different soil moisture regimes. So for H-TESSEL, the formulation of the soil hydrological conductivity and dif-fusivity was revised to be spatially variable according to a global soil texture map (FAO/UNESCO Digital Soil Map of the World, DSMW, FAO, 2003). H-TESSEL was imple-mented in the IFS in November 2007. It was verified in var-ious ways, including field site comparison, data assimilation and modelling experiments by Balsamo et al. (2009). Al-bergel et al. (2012b) also provide a detailed evaluation of H-TESSEL soil moisture. Analyses are available at four depths (0–7, 7–28, 28–100 and 100–289 cm). The soil heat budget follows a Fourier diffusion law, modified to take into account soil water freezing/melting according to Viterbo et al. (1999). The energy equation is solved with a net ground heat flux as the top boundary condition and a zero flux at the bottom. The water balance at the surface (i.e. the change in water storage of the soil moisture, interception reservoir and accumulated snowpack) is computed as the difference between the pre-cipitation and (i) the evaporation of soil, vegetation and in-terception water and (ii) surface and subsurface runoff. First precipitation is collected in the interception reservoir until it is saturated. Then, excess precipitation is partitioned be-tween surface runoff and infiltration into the soil column. H-TESSEL’s formulation of the soil hydrological conductivity and diffusivity is spatially variable according to a global soil texture map (FAO/UNESCO Digital Soil Map of the World, DSMW, FAO, 2003). Surface runoff is based on variable
in-filtration capacity. At the end of each data assimilation cycle, an adjustment to the model forecast (e.g. soil moisture) is produced; it usually refers to analysis increment and repre-sents the net response of the variational data assimilation to all observations used.
Three analyses schemes for the surface (and near-surface) variables are currently used in operations. They are based on spatial Optimal Interpolation (2D-OI, for snow depth and screen-level analyses); column Optimal Interpolation (1D-OI, for soil and snow temperature analysis); and an EKF (for soil moisture analysis, Drusch et al., 2009b; de Ros-nay et al., 2011, 2012). Analysis of surface parameters is decoupled from the main atmospheric analysis. Firstly an OI scheme produces estimates of screen-level temperature and relative humidity by combining synoptic observations over land with background estimates (short-range forecasts) from the most recent analysis (Douville et al., 2000). Anal-ysed fields of screen-level temperature and relative humid-ity are then used to update estimates of soil moisture (and soil temperature) for the layers of the model using the EKF analysis. While producing the forecast, the model estimates a wide variety of physical variables including precipitation. Even if not directly observed, the model estimates are con-strained by the observations (in situ measurements of tem-perature and humidity) used to initialise the forecast; their accuracy relies on the quality of the model physics as well as that of the analysis.
2.1.1 Soil moisture products
In this section a description is given of the major differences between the deterministic operational suite and the offline experiments with respect to soil moisture.
analysis and modelling schemes (i.e. changes in spatial and vertical resolutions, data assimilation, parameterizations and sources of data), resulting in frequent updates of the IFS (a few times a year). Before the implementation of cycle 36r4 in November 2010, the assimilation technique used was the OI (Mahfouf, 1991; Mahfouf et al., 2000b). The EKF was implemented in operations to optimally combine model data with conventional observations and satellite measurements. In its current configuration, the EKF soil moisture analy-sis uses meteorological observations of screen-level param-eters close to the surface, as with the previous OI method. However, due to the flexibility of Kalman-based techniques, the EKF can handle different sources of observations (Mah-fouf et al., 2009) and offers a wide range of development possibilities including the use of remotely sensed data such as ASCAT (Advanced Scatterometer, Wagner et al., 2007) and SMOS (Kerr, 2007; Kerr et al., 2010). The operational IFS soil moisture analysis is produced four times each day (i.e. at 00:00, 06:00, 12:00 and 18:00 UTC); it has a spatial resolution of about 25 km (T799) until 26 January 2010 and then it is about 16 km (T1279). Analyses at 00:00 UTC are considered in this study.
The offline experiments used in this study are based on IFS cycle 36r4. They are produced daily at 00:00, 06:00, 12:00 and 18:00 UTC at a spatial resolution of about 80 km (T255). Offline experiments are a response to reproduce the land-surface model state in between two reanalyses (e.g. the two latest reanalyses of ECMWF are ERA-Interim, Dee et al., 2011 and ERA-40, Uppala et al., 2005). Reanalyses such as ERA-Interim are produced by a fixed version of the IFS (for the main component of the atmospheric model and data assimilation) and have the advantage of being consis-tent over a long period. Offline experiments are based on the same principle and take into account specific improve-ments implemented in the operational IFS (e.g. the ERA-Interim reanalysis land-surface scheme is based on the TES-SEL scheme while H-TESTES-SEL is used for offline experi-ments in this study). Offline experiexperi-ments can be considered as add-ons before future generations of reanalyses are pro-duced at ECMWF. They are driven by ERA-Interim (Dee et al., 2011) global atmospheric reanalyses. The difference be-tween the two experiments concerns only the bare ground evaporation. For one, the bare ground evaporation over dry land has been enhanced by adopting a lower stress thresh-old than for the vegetation, allowing for higher evaporation (BEVAP NEW). Its control experiment without the new bare ground evaporation is called BEVAP OLD.
2.1.2 New bare ground evaporation
This section gives a description of the new bare ground for-mulation. It is in agreement with the experimental findings of Mahfouf and Noilhan (1991) and results in more realistic soil moisture values for dry land (Balsamo et al., 2011). Indeed, the evaporation from nonvegetated areas responds to a
differ-ent physical mechanism compared to densely vegetated ar-eas. Over bare soil, the vaporisation of water in the soil pores takes place in a thin layer close to the surface-atmosphere in-terface; this is a direct effect of incoming solar radiation pro-viding the latent heat requirements. Atmospheric conditions such as air temperature, humidity, wind velocity and radia-tion, as well as soil conditions (e.g. water content and rough-ness length) play a role in modulating the evaporation pro-cesses (Hillel, 1980). The relationship between soil moisture and bare soil evaporation is generally parameterized in land-surface models. Mahfouf and Noilhan (1991) compared sev-eral of these formulations; in these studies, bare soil evapora-tion formulaevapora-tions were halted when the soil was completely dry (for soil moisture close to zero). In the previous TES-SEL scheme, linking of soil moisture and evaporation was assumed to be linear between the permanent wilting point and the field capacity values for soil moisture. With the intro-duction of a tiling approach, the same stress function was ap-plied to both vegetated and nonvegetated tiles, neglecting the fact that wilting point is a soil moisture threshold that applies uniquely to vegetated areas. The formulation of the bare soil evaporation has been revisited in the latest H-TESSEL ver-sion to allow a smooth transition between vegetated and non-vegetated areas and to realign the formulation of bare ground evaporation with studies in the literature. Evapotranspiration process (E)is parameterized for each tilei accounting for canopy and soil resistance as:
Ei= ρa
ra+rc
qL−qsat Tsk,i (1)
whereρa is the air density; qL is the humidity at the
low-est model level;qsat Tsk,iis the saturated humidity for the vegetation skin temperatureTsk,i;ra is the aerodynamic
re-sistance; andrcis the canopy resistance. Equation (1) is valid
for vegetated and nonvegetated tileiin the absence of snow and interception water.
For vegetated tiles, the canopy resistance is formulated ac-cording to Jarvis (1976):
rc=
rs,min
LAI f1f2f3 (2)
with LAI prescribed from a MODIS satellite-based data set as detailed in Boussetta et al. (2011). In the canopy resistance formulation, the rs,min is the minimum stomatal resistance
andf1andf3are inhibition functions expressing the
short-wave radiation deficit and atmospheric humidity deficit, re-spectively. The soil moisture inhibition function,f2, depends
on the root-zone soil wetness(wroot)normalized between the
wilting point(wwilt)and the field capacity(wfc)therefore:
f2=
wroot−wwilt
wfc−wwilt
. (3)
For nonvegetated tiles,rc is uniquely dependent on the soil
moisture of the first soil layer, sof2is modified to be
minimum soil resistancersoil,min:
rc=rsoil,min·f2(wlayer1). (4)
In the new formulation, thef′
2for bare ground is calculated
as:
f2′=wroot−wmin wfc−wmin
(5) wherewminis a weighted average of the wilting point and
residual soil moisture content(wres). The weights are given
by the vegetation cover fraction “veg” (van den Hurk et al., 2000), so that:
wmin=veg·wwilt+(1−veg).wres (6)
In BEVAP OLD experiment, Eq. (3) is used while it is Eq. (5) in BEVAP NEW.
2.2 In situ soil moisture observations: the NRCS-SCAN network
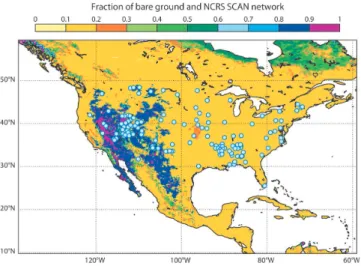
The SCAN network (http://www.wcc.nrcs.usda.gov/scan/) is a comprehensive, nationwide soil moisture and climate in-formation system designed to provide data to support natu-ral resource assessments and conservation activities. It is ad-ministered by the United States Department of Agriculture (USDA) Natural Resources Conservation Service (NRCS) through the National Water and Climate Centre (NWCC), in cooperation with the NRCS National Soil Survey Center. The system focuses on agricultural areas of the USA. The ob-serving network monitors soil temperature and soil moisture at several depths, soil water level, air temperature, relative humidity, solar radiation, wind, precipitation and barometric pressure, amongst others. SCAN data are used for a variety of purposes, ranging from global climate modelling to agri-cultural studies. Data are collected by a dielectric constant measuring device; typical measurements at 2 inches (about 5 cm) are used. The vegetation cover at those sites consists generally of natural fallow or short grass. In this study, all the stations of the NRCS-SCAN network providing data in 2010 and 2011 are retained (leading to a total of 148 sta-tions). The location of the stations of the NRCS-SCAN net-work are shown on Fig. 1.
2.3 Statistical comparison between analysis and in situ observations
A usual step for evaluating soil moisture products from model is to determine whether their behaviour matches the observations. Hence in situ measurements of soil moisture are a highly valuable source of information. For all stations, correlations (R, Eq. 7), bias (in situ minus analysis), root mean square difference (RMSD, Eq. 8) andp-value (a mea-sure of the correlation significance) are calculated. The lat-ter indicates the significance of the test; the 95 % confidence
Fig. 1.Location of the different in situ soil moisture stations used in this study (blue circles); the stations belong to the NRCS-SCAN network (United States). Colour scale represents the fraction of bare ground.
interval is used in this study (as in R¨udiger et al., 2009; Al-bergel et al., 2009, 2010); only configurations where the p-value is below 0.05 (i.e. the correlation is not a coincidence) are retained.
R= v u u
t1−
P
SSMproducts−SSMinsitu2
P
SSMproducts−SSMinsitu
2 (7)
RMSD= r
X
SSMproducts−SSMinsitu2 (8)
As in situ data may contain errors (instrumental and repre-sentativeness), they are not considered as “true” soil mois-ture. This is emphasised by using the RMS difference ter-minology instead of RMS error. In situ observations of soil moisture at the NRCS-SCAN stations are associated with soil temperature measurements. The observations of soil moisture were flagged for temperature below 4 degrees Cel-sius to avoid frozen conditions. When considering TB, the standard deviation (STD) is also computed.
To avoid seasonal effects, monthly anomaly time-series are calculated. The difference from the mean is produced for a sliding window of five weeks (if there are at least five measurements in this period), and the difference is scaled to the standard deviation. For each surface soil moisture esti-mate at day (i), a periodF is defined, withF= [i−17,i+17] (corresponding to a five-week window). If at least five mea-surements are available in this period, the average soil mois-ture value and the standard deviation are calculated. The Anomaly (Ano) is then given by
Ano(i)=SSM(i)
−SSM(F )
The same equation is used to compute in situ anomaly time-series which can be compared with that from ECMWF’s analyses.
2.4 The terrestrial microwave emission modelling
2.4.1 The Community Microwave Emission Modelling (CMEM) platform
The CMEM platform has been developed by ECMWF as the forward operator for low frequency passive microwave TB (from 1 GHz to 20 GHz) of the surface in the frame-work of the SMOS mission. CMEM is one of the ESA (European Space Agency) SMOS tools and it is avail-able to the entire community through the ECMWF web page: http://www.ecmwf.int/research/ESA projects/SMOS/ cmem/cmem doc.html.
CMEM represents the top of atmosphere TB as a result of the contributions from the following dielectric layers: soil, vegetation and atmosphere. The physics of CMEM is based on the parameterizations used in the L-Band Microwave Emission of the Biosphere (L-MEB, Wigneron et al., 2007) and the Land Surface Microwave Emission Model (LSMEM, Drusch et al., 2001); it includes a modular choice of the phys-ical parameterizations for the various dielectric layers. Multi-ple parameterizations for the dielectric constant, the effective temperature, the smooth emissivity, soil roughness, vegeta-tion optical depth and the atmospheric opacity lead to 1440 combinations when using CMEM (de Rosnay et al., 2009). The best CMEM configuration according to the finding of de Rosnay et al. (2009) is retained for this study. Sabater et al. (2011) also used this configuration, replacing, however, the soil roughness parameterization of Choudhury (1979) by the one proposed by Wigneron et al. (2001), because the former showed little sensitivity over larger regions.
2.4.2 SMOS brightness temperature
SMOS consists of a microwave imaging radiometer with an aperture synthesis, collecting top of atmosphere full po-larized radiances from the scene, viewed by its antennas through their power patterns. It is a Y-shaped instrument with several elementary antennas regularly spaced along the arms (69 in total) which provide, at each integration step, a full image (circa 1000×1200 km) at either two polarisations or full polarisation, of the Earth’s surface (Kerr et al., 2007, 2010). The spatial resolution is about 40 km and the globe is fully imaged at least twice every three days (ascending and descending orbits). Any points at the surface are viewed frequently at different angles and polarisations. The angu-lar information is used to separate the different contributions (soil-vegetation) to the signal (Wigneron et al., 2000). The signal measured at satellite level is a TB for the L-band con-sisting of four main contributions: (i) the up-welling atmo-spheric emission; (ii) the Earth’s surface emission,
attenu-ated by the atmosphere; (iii) the atmospheric down-welling atmospheric emission reflected at the surface and attenuated along the upward path by the atmosphere; and (iv) the cos-mic background emission attenuated by the atmosphere, re-flected at the surface and attenuated again along the upward path by the atmosphere. SMOS Near Real Time (NRT) prod-ucts are processed at the European Space Astronomy Cen-tre (ESAC) and sent to ECMWF via the SMOS Data Pro-cessing Ground Segment (DPGS) interface. ECMWF is in-volved in global monitoring and data assimilation of the SMOS mission data. The development of a data monitor-ing system for the SMOS near real time product provides a timely quality check for the European Space Agency (ESA) and the SMOS calibration and validation teams. More in-formation and comparison between SMOS data and mod-elled TB are available through ECMWF web pages: http: //www.ecmwf.int/research/ESA projects/SMOS/index.html.
3 Results
3.1 Impact of the new bare ground evaporation on soil moisture
3.1.1 Using Offline experiments
Fig. 2.Mean soil moisture for BEVAP OLD (left) and BEVAP NEW (right) (August 2010).
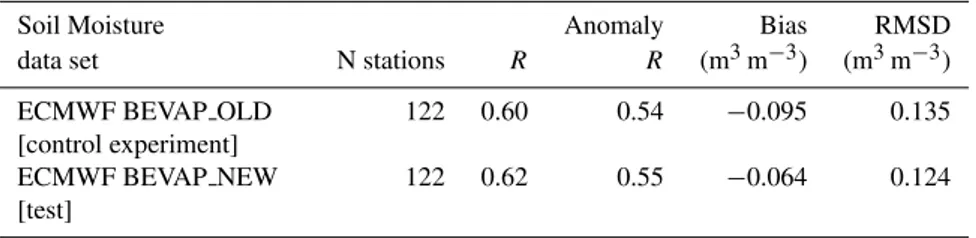
Table 2.Statistical scores for the comparison between ECMWF surface soil moisture (offline experiments, BEVAP OLD and BEVAP NEW) and in situ data for all the stations from the NRCS-SCAN (USA) network over the 2010 period.
Soil Moisture Anomaly Bias RMSD
data set N stations R R (m3m−3) (m3m−3)
ECMWF BEVAP OLD [control experiment]
122 0.60 0.54 −0.095 0.135
ECMWF BEVAP NEW [test]
122 0.62 0.55 −0.064 0.124
stations with a fraction of bare soil greater that 0.1. These results indicate that ECMWF soil moisture product negative (wet) biases are more pronounced in areas with a high frac-tion of bare soil, and comfort the modificafrac-tion of the wilting point in Eq. (3) to a weighted average of the wilting point in Eq. (5), taking into account the vegetation cover fraction (Eq. 6). For all stations, the average correlations for volumet-ric time-series are 0.60 for BEVAP OLD (control) and 0.62 for BEVAP NEW (test). Biases (in situ minus analyses) are on average−0.095 m3m−3and−0.064 m3m−3, RMSDs are
0.135 m3m−3and 0.124 m3m−3for BEVAP OLD and
BE-VAP NEW, respectively. Despite a small decrease in RMSD for BEVAP NEW, both values are high. The new formula-tion (Eq. 5) is expected to enhance evaporaformula-tion over bare ground, hence for each station, the fraction of bare ground (according to the model) was used as a filter to evaluate the impact of the new formulation on RMSD. The RMSD dif-ference between BEVAP OLD, BEVAP NEW and stations of the NRCS-SCAN network as a function of the fraction of bare ground is displayed on Fig. 3. It identifies a threshold value (0.2) below, for which the fraction of bare soil is too small for the new formulation to have an impact on RMSD. When scores are computed for stations with a fraction of bare ground greater than or equal to 0.2 (35 stations with signifi-cantRvalues), the correlations, biases and RMSDs are 0.63, −0.086 m3m−3, 0.118 m3m−3 for BEVAP OLD and 0.65, 0.0007 m3m−3, 0.087 m3m−3 for BEVAP NEW. This
de-crease in the RMSD for BEVAP NEW (from 0.118 m3m−3
to 0.087 m3m−3), leading to a more realistic soil moisture
product regarding the in situ data, is attributed only to the new bare ground evaporation formulation. Figure 4 illustrates the two offline runs as well as the in situ observations for one site located in Utah. Minimum values of BEVAP OLD soil moisture are limited by the dominant wilting point for vege-tation types, however, ground data indicate much drier con-ditions, as is clearly observed from May to September 2010. The new bare ground evaporation allows the model to go below this wilting point so the BEVAP NEW analysis is in much better agreement with the observations than that for BEVAP OLD. Along with the decrease in RMSD, one may note an increase in the correlation (from 0.63 to 0.65). Also BEVAP NEW has a more realistic decrease in soil moisture after a precipitation event due to its higher water holding capacity and this explains the slightly better correlations.
Considering the short-term variability, the average corre-lations for the monthly anomaly time series are 0.54 for BE-VAP OLD and 0.55 for BEBE-VAP NEW. Correlations of vol-umetric time series are larger than those for the monthly anomaly time-series. The good level of correlation of the volumetric time series is largely explained by seasonal variations, which are suppressed in monthly anomalies. 3.1.2 Using the operational product
Fig. 3. Soil moisture RMSD between BEVAP OLD and BE-VAP NEW as a function of the fraction of bare ground (black solid curve, left y-axis), the number of in situ stations used (for which significant correlation is obtained between observations and model time-series) is also presented (black dots, right y-axis). The dashed line represents a bare soil fraction threshold below which the sen-sitivity of soil moisture to the new evaporation formulation is less pronounced.
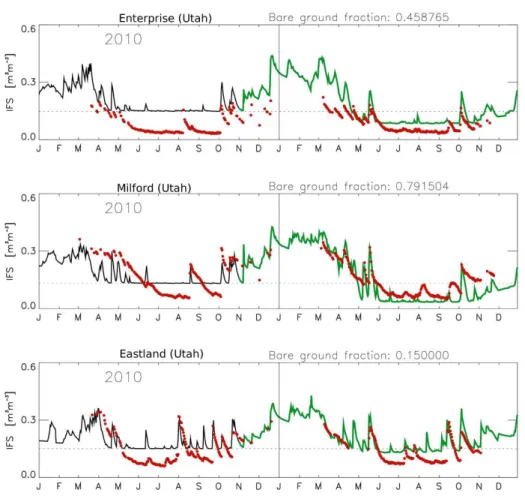
period. Results are presented in Table 4 and illustrated by Fig. 5. The same threshold of 0.2 for the fraction of bare ground was used. The correlations, bias and RMSD are 0.59,−0.076 m3m−3and 0.110 m3m−3for 2010, and 0.69, −0.010 m3m−3, 0.088 m3m−3for 2011. Figure 5 illustrates the soil moisture time-series for three stations with differ-ent fractions of bare ground (∼0.46,∼0.79 and∼0.15 from top to bottom). Compared to 2010, the station with a fraction of bare ground of 0.79 has a lower value of RMSD in 2011 than a station with a fraction of 0.15. As for BEVAP OLD and BEVAP NEW, the operational analysis is in much better agreement with the observations for 2011 (with the new bare ground evaporation) than for 2010; this is particularly clear for the period from May to September 2011 (see Fig. 5). If the decrease in RMSD is associated with the new bare ground evaporation, the increase in correlation (from 0.59 to 0.69) is mainly due to the new EKF analysis (also, in situ data are different). As demonstrated in Albergel et al. (2010) and de Rosnay et al. (2011, 2012) the use of the EKF permits to increase the quality of the soil moisture product compared to the former OI method. The higher water holding capac-ity observed for 2011 also helps in this way (more realistic decrease of soil moisture after a precipitation event). Corre-lations of anomaly time-series are 0.53 and 0.54 for 2010 and 2011, respectively.
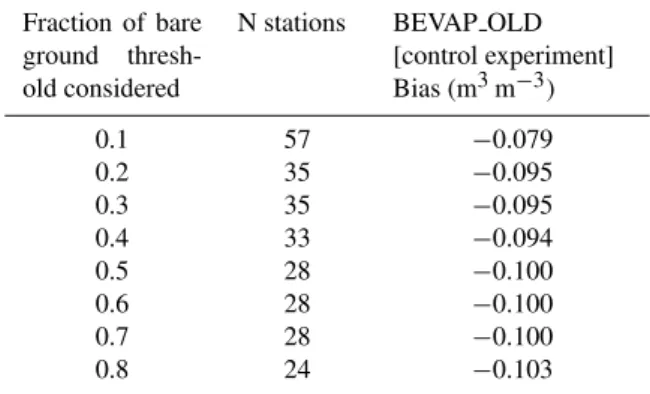
Table 3.Biases between BEVAP OLD (control experiment) and in situ data from the stations of the NRCS-SCAN network in 2010. Fraction of bare ground is used as a filter to compute biases.
Fraction of bare ground thresh-old considered
N stations BEVAP OLD [control experiment] Bias (m3m−3)
0.1 57 −0.079
0.2 35 −0.095
0.3 35 −0.095
0.4 33 −0.094
0.5 28 −0.100
0.6 28 −0.100
0.7 28 −0.100
0.8 24 −0.103
3.2 Impact of the new bare ground evaporation on ter-restrial microwave emission and comparison with SMOS
Fig. 4.Illustration of volumetric soil moisture time-series used in this study for one site in Utah (Tule Valley) for 2010. The black line is for BEVAP OLD (control experiment without the new bare ground evaporation formulation), green line is for BEVAP NEW (test with new formulation) and red dots are for in situ observations of soil moisture.
Fig. 5.Time-series of the operational volumetric soil moisture analysis for three sites in Utah for the 2010–2011 period. The black solid line becomes green when the new bare ground evaporation formulation is implemented in November 2010. Red dots are for in situ observations of surface soil moisture. Fraction of bare ground (according to the model) for each site is indicated. The dashed line represents the model minimum soil moisture limit before the implementation of the new bare ground evaporation (permanent wilting point).
Both TB data sets are compared to SMOS TB observations at 06:00 UTC, at an incidence angle of 40 degrees (more data available). Radio frequency interference (RFI) disturbs the natural microwave emission observed by SMOS (Zribi et al., 2011). At an acquisition time of 06:00 UTC, SMOS data are mainly observed over Western Europe and Africa,
Table 4.Statistical scores for the comparison between ECMWF operational soil moisture analysis for 2010 and 2011. The new bare ground evaporation formulation was implemented in November 2010. Only stations where the model has a fraction of bare ground greater than or equal to 0.2 were used.
Soil Moisture data set N stations R RAnomaly Bias (m3m−3) RMSD (m3m−3)
ECMWF Operational analysis 2010 35 0.59 0.53 −0.076 0.110 ECMWF Operational analysis 2011 35 0.69 0.54 −0.010 0.088
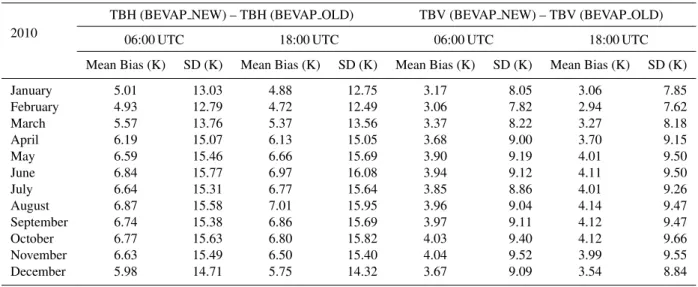
Table 5.Monthly mean statistics of the difference between simulated TB in BEVAP NEW and BEVAP OLD. Statistics are given for both horizontal and vertical polarizations, at 06:00 UTC and 18:00 UTC, based on 40◦incidence angle simulated TB.
2010
TBH (BEVAP NEW) – TBH (BEVAP OLD) TBV (BEVAP NEW) – TBV (BEVAP OLD)
06:00 UTC 18:00 UTC 06:00 UTC 18:00 UTC
Mean Bias (K) SD (K) Mean Bias (K) SD (K) Mean Bias (K) SD (K) Mean Bias (K) SD (K)
January 5.01 13.03 4.88 12.75 3.17 8.05 3.06 7.85
February 4.93 12.79 4.72 12.49 3.06 7.82 2.94 7.62
March 5.57 13.76 5.37 13.56 3.37 8.22 3.27 8.18
April 6.19 15.07 6.13 15.05 3.68 9.00 3.70 9.15
May 6.59 15.46 6.66 15.69 3.90 9.19 4.01 9.50
June 6.84 15.77 6.97 16.08 3.94 9.12 4.11 9.50
July 6.64 15.31 6.77 15.64 3.85 8.86 4.01 9.26
August 6.87 15.58 7.01 15.95 3.96 9.04 4.14 9.47
September 6.74 15.38 6.86 15.69 3.97 9.11 4.12 9.47
October 6.77 15.63 6.80 15.82 4.03 9.40 4.12 9.66
November 6.63 15.49 6.50 15.40 4.04 9.52 3.99 9.55
December 5.98 14.71 5.75 14.32 3.67 9.09 3.54 8.84
Fig. 6.Map of differences between TB (horizontal polarisation, 40◦incidence angle in K) simulated using model fields from
BE-VAP NEW and BEBE-VAP OLD for August 2010 (06:00 UTC).
(STD of 20.8 K) when considering BEVAP OLD TBH. Val-ues are higher for TBV than for TBH.
4 Discussion
While previous studies (Albergel et al., 2012a, b) have demonstrated the good ability of ECMWF analyses to rep-resent the soil moisture annual cycle as well as its short-term variability, they have also shown an overestimation of
Fig. 7.(left) Brightness temperature global monthly mean sensitivity to the new bare soil parameterization for 2010 (solid and dashed lines), (right) spatial correlation between the fraction of bare ground and the brightness temperature global monthly difference (stars and diamonds). Both horizontal and vertical polarizations (40◦incidence angle) are represented for 06:00 UTC and 18:00 UTC.
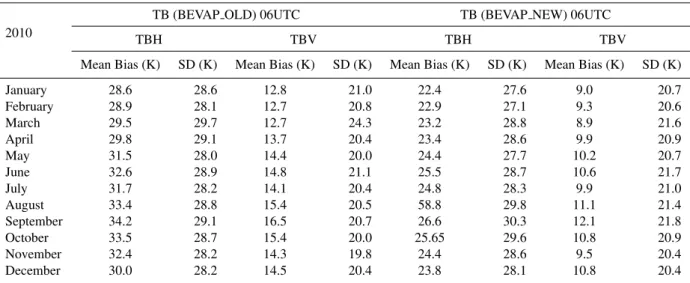
Table 6.Monthly mean statistics of the difference between SMOS TB observations and simulated TB. Results are given at 06:00 UTC, for both BEVAP OLD and BEVAP NEW, at both horizontal and vertical polarizations, based on 40◦incidence angle observed and simulated
TB.
2010
TB (BEVAP OLD) 06UTC TB (BEVAP NEW) 06UTC
TBH TBV TBH TBV
Mean Bias (K) SD (K) Mean Bias (K) SD (K) Mean Bias (K) SD (K) Mean Bias (K) SD (K)
January 28.6 28.6 12.8 21.0 22.4 27.6 9.0 20.7
February 28.9 28.1 12.7 20.8 22.9 27.1 9.3 20.6
March 29.5 29.7 12.7 24.3 23.2 28.8 8.9 21.6
April 29.8 29.1 13.7 20.4 23.4 28.6 9.9 20.9
May 31.5 28.0 14.4 20.0 24.4 27.7 10.2 20.7
June 32.6 28.9 14.8 21.1 25.5 28.7 10.6 21.7
July 31.7 28.2 14.1 20.4 24.8 28.3 9.9 21.0
August 33.4 28.8 15.4 20.5 58.8 29.8 11.1 21.4
September 34.2 29.1 16.5 20.7 26.6 30.3 12.1 21.8
October 33.5 28.7 15.4 20.0 25.65 29.6 10.8 20.9
November 32.4 28.2 14.3 19.8 24.4 28.6 9.5 20.4
December 30.0 28.2 14.5 20.4 23.8 28.1 10.8 20.4
0.135 m3m−3and 0.124 m3m−3for BEVAP OLD and
BE-VAP NEW, respectively. However, if a threshold of 0.2 for the fraction bare ground is set, this difference increases to 0.118 m3m−3 and 0.087 m3m−3. At the spatial resolution
of BEVAP NEW and BEVAP OLD, ECMWF considers that about 46 % of the land is covered by a fraction of bare ground more than or equal to 0.2. Similar RMSDs are obtained with the operational IFS soil moisture product; in 2010, the RMSD is 0.110 m3m−3, and 0.088 m3m−3 in 2011 (new
bare ground evaporation implemented in November 2010). Results from the recent land surface model developments at ECMWF were evaluated using a land surface benchmarking database gathered for this purpose. Those included field sites from the FLUXNET (http://www.fluxdata.org/) and CEOP (http://www.ceop.net/) observing networks where latent heat,
soil moisture is drier than BEVAP OLD, the simulated TB are larger with BEVAP NEW surface fields. The latter are closer to SMOS observations but with still large global mean differences and standard deviation (about 10 K and 20 K, re-spectively). These residual biases are also related to other factors such as the SMOS instrument or input parameters of the radiative transfer model, which are not straightforward to assess. Radio frequency interferences affecting the SMOS measurements could also be responsible of the bias. CMEM configuration used in this study is based on de Rosnay et al. (2009) and Sabater et al. (2011) using AMSR-E C-band data and local L-band data, respectively. Results presented in this study are very preliminary and a full calibration of the CMEM platform, underway at ECMWF for SMOS ac-tivities, should lead to more realistic simulated TB, in better agreement with SMOS data.
5 Conclusions
This study investigated the new bare ground evaporation for-mulation implemented in operations at ECMWF in Novem-ber 2010. Bare ground evaporation over dry lands has been increased by adopting a lower stress threshold than for the vegetation, allowing a higher evaporation. Its impact on soil moisture as well as on the representation of terrestrial mi-crowave emission is assessed. The latter is of particular in-terest for the planned use of SMOS brightness temperature within the new land-surface analyses, as it will be effective only if realistic and dynamically consistent fields of bright-ness temperature are simulated as a function of the land-surface conditions. ECMWF has developed offline experi-ments to assess the impact of model changes. They are pro-duced by a fixed version of the IFS (and used atmospheric forcing from ERA-Interim), while the operational product is based on a continuous effort to improve the analysis and modelling schemes, resulting in frequent updates of the sys-tem (a few times a year). So offline experiments make it pos-sible to study the impact of a single modification in the land surface modelling. Even if they are at a coarser spatial reso-lution than the operational product, they have the benefit of being less time-consuming and are very useful between the completion of future reanalyses of ECMWF.
In situ soil moisture from 122 stations (over 148 available) of the NRCS-SCAN network from all over the United States were used to evaluate the new bare ground evaporation for-mulation over two periods, 2010 and 2010–2011. It was first assessed using offline experiments to isolate its impact (2010 only) and then using the IFS operational product (2010– 2011). The new scheme results in more realistic soil mois-ture values, particularly for dry areas; a decrease of about 26 % in RMSD is obtained between the two offline experi-ments when considering the fraction of bare ground that has a threshold greater than or equal to 0.2 (from 0.118 m3m−3
to 0.087 m3m−3). Slightly higher levels of correlations were
also obtained. The same conclusion is reached with the IFS operational analysis where a better agreement with in situ data was found in 2011 than in 2010. More realistic soil moisture also lead to better initial fields for simulating bright-ness temperature with the CMEM platform, a prerequisite for SMOS data assimilation. This preliminary study demon-strated a better agreement between SMOS data and simulated brightness temperature with surface fields from the new bare ground evaporation. Future improvements of the land-surface physics will focus on evaporation from free water surface such as intercepted water on leaves.
Acknowledgements. Authors thank the EUMETSAT Satellite Ap-plication Facility on Support to Operational Hydrology and Water Management “(HSAF)” for their funding support. R. Riddaway from ECMWF is thanked for his valuable comments on the English style. R. Hine from ECMWF is thanked for his help in improving the figures.
Edited by: A. Loew
References
Albergel, C., R¨udiger, C., Carrer, D., Calvet, J.-C., Fritz, N., Naeimi, V., Bartalis, Z., and Hasenauer, S.: An evaluation of ASCAT surface soil moisture products with in-situ observations in Southwestern France, Hydrol. Earth Syst. Sci., 13, 115–124, doi:10.5194/hess-13-115-2009, 2009.
Albergel, C., Calvet, J.-C., de Rosnay, P., Balsamo, G., Wagner, W., Hasenauer, S., Naeimi, V., Martin, E., Bazile, E., Bouys-sel, F., and Mahfouf, J.-F.: Cross-evaluation of modelled and remotely sensed surface soil moisture with in situ data in southwestern France, Hydrol. Earth Syst. Sci., 14, 2177–2191, doi:10.5194/hess-14-2177-2010, 2010.
Albergel, C., de Rosnay, P., Gruhier, C., Mu˜noz-Sabater, J., Hase-nauer, S., Isaksen, L., Kerr, Y., and Wagner, W.: Evaluation of re-motely sensed and modelled soil moisture products using global ground-based in situ observations, Remote Sens. Environ., 118, 215–226, doi:10.1016/j.rse.2011.11.017, 2012a.
Albergel, C., de Rosnay, P., Balsamo, G., Isaksen, L., and Mu˜noz-Sabater, J.: Soil moisture analyses at ECMWF: evaluation us-ing global ground-based in situ observations, J. Hydrometeor., in press, 13, doi:10.1175/JHM-D-11-0107.1, 2012b.
Balsamo, G., Viterbo, P., Beljaars, A. C. M., van den Hurk, B. J. J. M., Hirschi, M., Betts, A. K., and Scipal, K.: A revised hydrology for the ECMWF model: Verification from field site to terrestrial water storage and impact in the ECMWF-IFS, J. Hydrometeor., 10, 623–643, doi:10.1175/2008JHM1068.1, 2009.
Boussetta, S., Balsamo, G., Beljaars, A. C. M., and Jarlan, J.: Impact of a satellite-derived Leaf Area Index monthly climatology in a global Numerical Weather Prediction model. ECMWF Tech. Memo., ECMWF, Reading, UK, No. 640, 2010.
Bouttier, F.: The development of 12-hourly 4D-Var, ECMWF Tech. Memo 348, 21 pp., 2001.
Choudhury, B. J., Schmugge, T. J., Chang, A., and Newton, R. W. : Effect of surface roughness on the microwave emission for soils, J. Geophys. Res., 84, 5699–5706, 1979.
de Rosnay, P., Drusch, M., Boone, A., Balsamo, G., Decharme, B., Harris, P., Kerr, Y., Pellarin, T., Polcher, J., and Wigneron, J.-P.: The AMMA Land Surface Model Intercomparison Experiment coupled to the Community Microwave Emis-sion Model: ALMIP-MEM, J. Geophys. Res., 114, D05108, doi:10.1029/2008JD010724, 2009.
de Rosnay, P., Drusch, M., Balsamo, G., Isaksen, L., and Albergel, C.: Extended Kalman Filter soil moisture analysis in the IFS. ECMWF Spring Newsletter, 127, 12–16, 2011.
de Rosnay, P., Drusch, M., Vasiljevic, D., Balsamo, G., Albergel, C., and Isaksen, L.: A simplified Extended Kalman Filter for the global operational soil moisture analysis at ECMWF, Q. J. Roy. Meteorol. Soc., in press, doi:10.1002/qj.2023, 2012.
Dee, D. P., Uppala, S. M., Simmons, A. J., Berrisford, P., Poli, P., Obayashi, S., Andrae, U., Balmaseda, M. A., Balsamo, G., Bauer, P., Bechtold, P., Beljaar, A. C. M., van de Berg, L., Bid-lot, J., Bormann, N., Delsol, C., Dragani, R., Fuentes, M., Geer, A. J., Haimberger, L., Healy, S. B., Hersbach, H., Holm, E. V., Isaksen, L., Kallberg, P., Kohler, M., Matricardi, M., McNally, A. P., Monge-Sanz, B. M., Morcrette, J.-J., Park, B.-K., Peubey, C., de Rosnay, P., Tavolato, C., Th´epaut, J.-N., and Vitart, F.: The ERA-Interim reanalysis: configuration and performance of the data assimilation system, Q. J. Roy. Meteorol. Soc., 137, 553– 597, doi:10.1002/qj.828, 2011.
Desborough, C. E., Pitman, A. J., and Irannejad, P.: Analysis of the relationship between bare soil evaporation and soil moisture simulated by 13 land surface schemes for a simple non-vegetated site, Global Planet. Change, 13, 47–56, 1996.
Dharssi, I., Bovis, K. J., Macpherson, B., and Jones, C. P.: Opera-tional assimilation of ASCAT surface soil wetness at the Met Of-fice, Hydrol. Earth Syst. Sci., 15, 2729–2746, doi:10.5194/hess-15-2729-2011, 2011.
Dirmeyer, P. A., Dolman, A. J., and Sato, N.: The pilot phase of the global soil wetness project, B. Am. Meteorol. Soc., 80, 851–878, 1999.
Dirmeyer, P.A ., Gao, X., and Oki, T.: GSWP-2: The Second Global Soil Wetness Project Science and Implementation Plan, IGPO Publication Series, No. 37, IGPO, 65 pp., 2002.
Dorigo, W. A., Wagner, W., Hohensinn, R., Hahn, S., Paulik, C., Xaver, A., Gruber, A., Drusch, M., Mecklenburg, S., van Oeve-len, P., Robock, A., and Jackson, T.: The International Soil Mois-ture Network: a data hosting facility for global in situ soil mois-ture measurements, Hydrol. Earth Syst. Sci., 15, 1675–1698, doi:10.5194/hess-15-1675-2011, 2011.
Douville, H., Viterbo, P., Mahfouf, J.-F., and Beljaars, A. C. M.: Evaluation of the optimum interpolation and nudging techniques for soil moisture analysis using FIFE data, Mon. Weather Rev., 128, 1733–1756, 2000.
Douville, H., Chauvin, H., and Broqua, H.: Influence of soil mois-ture on the Asian and African monsoons. Part I: Mean monsoon
and daily precipitation, J. Climate, 14, 2381–2403, 2001. Drusch, M., Wood, E., and Jackson, T.: Vegetative and atmospheric
corrections for soil moisture retrieval from passive microwave remote sensing data: Results from the Southern Great Plains Hy-drology Experiment 1997, J. Hydrometeorol., 2, 181–192, 2001. Drusch, M., Holmes, T., de Rosnay, P., and Balsamo, G.: Compar-ing ERA-40 based L-band brightness temperatures with Skylab observations: a calibration/validation study using the Commu-nity Microwave Emission Model, J. Hydrometeorol., 10, 213– 226, doi:10.1175/2008JHM964.1, 2009a.
Drusch, M., Scipal, K., de Rosnay, P., Balsamo, G., Anderson, E., Bougeault, P., and Viterbo, P.: Towards a Kalman Filter based soil moisure analysis system for the operational ECMWF integrated forecst system, Geophys. Res. Lett., 36, L10401, doi:10.1029/2009GL037716, 2009b.
Dutra, E., Balsamo, G., Viterbo, P., Miranda, P. M. A., Beljaars, A. C. M., Sch¨ar, C., and Elder K.: An improved snow scheme for the ECMWF land surface model: description and offline validation, J. Hydrometeorol., 11, 899–916, 2010.
Entekhabi, D., Asrar, G. R., Betts, A. K., Beven, K. J., Bras, R. L., Duffy, C. J., Dunne, T., Koster, R. D., Lettenmaier, D. P., McLaughlin, D. B., Shuttleworth, W. J., van Genuchten, M. T., Wei, M. Y., and Wood, E. F.: An agenda for land surface hydrol-ogy research and a call for the second international hydrological decade, B. Am. Meteorol. Soc., 10, 2043–2058, 1999.
FAO: “Digital soil map of the world (DSMW)”, Technical re-port, Food and Agriculture Organization of the United Nations, re-issued version, 2003.
Hillel, D.: Environmental Soil Physics. Academic Press, 771 pp., 1980.
Holmes, T., Drusch, M., Wigneron, J.-P., and de Jeu, R.: A global simulation of microwave emission: error structures based on output from ECMWFS Operational Integrated Forecast System, IEEE T. Geosci. Remote Sens., 46, 846–856, 2008.
Jarvis, P. J.: The interpretation of the variations in leaf-water po-tential and stomatal conductance found in canopies in the field, Philos. T. R. Soc. Lond., B723, 385–610, 1976.
Kerr, Y.: Soil moisture from space: where are we?, Hydrogeol. J., 15, 117–120, 2007.
Kerr, Y. H., Waldteufel, P., Wigneron, J.-P., Delwart, S., Cabot, F., Boutin, J., Escorihuela, M.-J., Font, J., Reul, N., Gruhier, C., Ju-glea, S. E., Drinkwater, M. R., Hahne, A., Mart`ın-Neira, M., and Mecklenburg, S.: The SMOS Mission: New Tool for Monitoring Key Elements of the GlobalWater Cycle, P. IEEE, 98, 666–687, 2010.
Koster, R. D., Dirmeyer, P. A., Guo, Z. C., Bonan, G., Chan, E., Cox, P., Gordon, C. T., Kanae, S., Kowalczyk, E., Lawrence, D., Liu, P., Lu, C. H., Malyshev, S., McAvaney, B., Mitchell, K., Mocko, D., Oki, T., Oleson, K., Pitman, A., Sud, Y. C., Taylor, C. M., Verseghy, D., Vasic, R., Xue, Y. K., and Yamada, T.: Regions of strong coupling between soil moisture and precipitation, Science, 305, 1138–1140, 2004.
Forecast Skill, J. Hydrometeor., 12, 805–822, 2011.
Lopez, P.: Direct 4D-Var Assimilation of NCEP Stage IV Radar and Gauge Precipitation Data at ECMWF, Mon. Weather Rev., 139, 2098–2116, doi:10.1175/2010MWR3565.1, 2011.
Mahfouf, J.-F. and Noilhan, J.: Comparative study of various formu-lations of evaporation from bare soil using in situ data, J. Appl. Meteorol., 30, 351–362, 1991.
Mahfouf, J.-F.: Analysis of soil moisture from near surface param-eters: A feasibility study, J. Appl. Meteorol., 30, 506–526, 1991. Mahfouf, J.-F. and Rabier, F.: The ECMWF operational implemen-tation of four dimensional variational assimilation. Part II: Ex-perimental results with improved physics, Q. J. Roy. Meteorol. Soc., 126, 1171–1190, 2000.
Mahfouf, J.-F., Viterbo, P., Douville, H., Beljaars, A. C. M., and Saarinen, S.: A revised land-surface analysis scheme in the Inte-grated Forecasting System, ECMWF newsletter, No. 88 – Sum-mer/Autumn 2000, 8–13, 2000.
Mahfouf, J.-F., Bergaoui, K., Draper, C., Bouyssel, F., Taillefer, F., and Taseva, L.: A comparison of two off-line soil analysis schemes for assimilation of screen level observations, J. Geo-phys. Res., 114, D08105, doi:10.1029/2008JD011077, 2009. Rabier, F., J¨arvinen, H., Klinker, E., Mahfouf, J.-F., and Simmons,
A.: The ECMWF operational implementation of four dimen-sional variational assimilation. Part I: Experimental results with simplified physics, Q. J. Roy. Meteorol. Soc., 126, 1143–1170, 2000.
R¨udiger, C., Calvet, J.-C., Gruhier, C., Holmes, T., De Jeu, R., and Wagner, W.: An intercomparison of ERS-Scat and AMSR-E soil moisture observations with model simulations over France, J. Hydrometeorol., 10, 431–447, doi:10.1175/2008JHM997.1, 2009.
Sabater, J., de Rosnay, P., and Balsamo, G.: Sensitivity of L-band NWP forward modelling to soil roughness, Int. J. Remote Sens., 32, 5607–5620, doi:10.1080/01431161.2010.507260, 2011. Sabater, J., Fouilloux, A., and de Rosnay, P.: Technical
Imple-mentation of SMOS Data in the ECMWF Integrated Forecast-ing System, IEEE Geosci. Remote Sens. Lett., 9, 252–256, doi:10.1109/LGRS.2011.2164777, 2012.
Schaefer, G. L. and Paetzold, R. F. 2000: SNOTEL (SNOwpack TELemetry) and SCAN (Soil Climate Analysis Network) Pre-sented at the Automated Weather Station (AWS) workshop, 6–10 March, Lincoln, NE.
Seneviratne, S. I., Koster, R. D., Guo, Z. C., Dirmeyer, P. A., Kowal-czyk, E., Lawrence, D., Liu, P., Lu, C. H., Mocko, D., Oleson, K. W., and Verseghy, D.: Soil moisture memory in AGCM simu-lations: analysis of Global Land-Atmosphere Coupling Experi-ment (GLACE) data, J. Hydrometeorol., 7, 1090–1112, 2006. Shukla, J. and Mintz, Y.: Influence of land-surface
evapotranspira-tion on the earth’s climate, Science, 215, 1498–1501, 1982. Uppala, S. M., Kallberg, P. W., Simmons, A. J., Andrae, U.,
Bech-told, V. D., Fiorino, M., Gibson, J. K., Haseler, J., Hernandez, A., Kelly, G. A., Li, X., Onogi, K., Saarinen, S., Sokka, N., Al-lan, R. P., Andersson, E., Arpe, K., Balmaseda, M. A., Beljaars, A. C. M., Van De Berg, L., Bidlot, J., Bormann, N., Caires, S., Chevallier, F., Dethof, A., Dragosavac, M., Fisher, M., Fuentes, M., Hagemann, S., Holm, E., Hoskins, B. J., Isaksen, L., Janssen, P. A. E. M., Jenne, R., McNally, A. P., Mahfouf, J. F., Morcrette, J. J., Rayner, N. A., Saunders, R. W., Simon, P., Sterl, A., Tren-berth, K. E., Untch, A., Vasiljevic, D., Viterbo, P., and Woollen,
J.:The ERA-40 re-analysis, Q. J. Roy. Meteorol. Soc., 131, 2961– 3012, doi:10.1256/qj.04.176, 2005.
van den Hurk, B. J. J. M., Viterbo, P., Beljaars, A., and Betts, A. K.: Offline validation of the ERA-40 surface scheme, ECMWF Tech. Memo., 295, 43 pp., 2000.
van den Hurk, B. and Viterbo, P.: The Torne-Kalix PILPS 2(e) ex-periment as a test bed for modifications to the ECMWF land sur-face scheme, Global Plane. Change, 38, 165–173, 2003. Viterbo, P., Beljaars, A. C. M., Mahfouf, J.-F., and Teixeira, J.: The
representation of soil moisture freezing and its impact on the sta-ble boundary layer, Q. J. Roy. Meteorol. Soc., 125, 2401–2426, 1999.
Wagner, W., Bl¨oschl, G., Pampaloni, P., Calvet, J.-C., Bizzarri, B., Wigneron, J.-P., and Kerr, Y.: Operational readiness of mi-crowave remote sensing of soil moisture for hydrologic applica-tions, Nord. Hydrol., 38, 1–20, doi:10.2166/nh.2007.029, 2007. Wang, L., D’Odorico, P., Evans, J. P., Eldridge, D. J., McCabe,
M. F., Caylor, K. K., and King, E. G.: Dryland ecohydrology and climate change: critical issues and technical advances, Hy-drol. Earth Syst. Sci., 16, 2585–2603, doi:10.5194/hess-16-2585-2012, 2012.
Wigneron, J.-P, Waldteufel, P., Chanzy, A., Calvet, J.-C., and Kerr, Y.: Two -D microwave interferometer retrieval capabilities over land surfaces (SMOS mission), Remote Sens. Environ., 73, 270– 282, 2000.
Wigneron, J.-P., Laguerre, L., and Kerr, Y.: A simple parameteriza-tion of the L-band microwave emission from rough agricultural soils, IEEE T. Geosci. Remote Sens., 39, 1697–1707, 2001. Wigneron, J.-P., Kerr, Y., Waldteufel, P., Saleh, K., Escorihuela,
M.-J., Richaume, P., Ferrazzoli, P., de Rosnay, P., Gurney, R., Calvet, J.-C., Grant, J.P., Guglielmetti, M., Hornbuckle, B., M¨atzler, C., Pellarin, T., and Schwankh, M.:. L-band Microwave Emission of the Biosphere (L-MEB) Model: Description and calibration against experimental data sets over crop fields, Remote Sens. En-viron., 107,4,639–655, 2007.
World Meteprological Organization: Drought monitoring and early warning: concepts, progress and future challenges, n.1008, ISBN 92-63-11006-9, www.wamis.org/agm/pubs/brochures/ WMO1006e.pdf (last access: 16 April 2012), 2012.