www.hydrol-earth-syst-sci.net/20/1509/2016/ doi:10.5194/hess-20-1509-2016
© Author(s) 2016. CC Attribution 3.0 License.
Stem–root flow effect on soil–atmosphere interactions and
uncertainty assessments
Tzu-Hsien Kuo1, Jen-Ping Chen1, and Yongkang Xue2
1Department of Atmospheric Sciences, National Taiwan University, Taipei, Taiwan, Republic of China
2Department of Atmospheric and Oceanic Sciences, and Department of Geography, University of California, Los Angeles, California, USA
Correspondence to: Jen-Ping Chen ([email protected])
Received: 1 October 2015 – Published in Hydrol. Earth Syst. Sci. Discuss.: 11 November 2015 Revised: 26 February 2016 – Accepted: 5 April 2016 – Published: 20 April 2016
Abstract. Rainfall that reaches the soil surface can rapidly move into deeper layers in the form of bulk flow through the stem–root flow mechanism. This study developed the stem– root flow parameterization scheme and coupled this scheme with the Simplified Simple Biosphere model (SSiB) to ana-lyze its effects on land–atmospheric interactions. The SSiB model was tested in a single-column mode using the Lien Hua Chih (LHC) measurements conducted in Taiwan and HAPEX–Mobilhy (HAPEX) measurements in France. The results show that stem–root flow generally caused a decrease in soil moisture in the top soil layer and moistened the deeper soil layers. Such soil moisture redistribution results in sub-stantial changes in heat flux exchange between land and at-mosphere. In the humid environment at LHC, the stem–root flow effect on transpiration was minimal, and the main in-fluence on energy flux was through reduced soil evapora-tion that led to higher soil temperature and greater sensi-ble heat flux. In the Mediterranean environment of HAPEX, the stem–root flow substantially affected plant transpiration and soil evaporation, as well as associated changes in canopy and soil temperatures. However, the effect on transpiration could be either positive or negative depending on the rela-tive changes in the soil moisture of the top soil vs. deeper soil layers due to stem–root flow and soil moisture diffusion processes.
1 Introduction
The water stored in the land system is a key factor control-ling many physical processes and feedback between the land and atmosphere. Soil moisture is a source of water for the atmosphere through processes that lead to evapotranspira-tion, including bare soil evaporaevapotranspira-tion, plant transpiration and evaporation from other surfaces such as leaves, snow, etc. The rainfall redistribution process in forest systems affects soil moisture amount and its distribution (McGuffie et al., 1995; Chase et al., 1996, 2000; Zhao et al., 2001). Rainwater entering the forest is redistributed via several pathways be-fore reaching the be-forest floor, e.g., some is intercepted by the canopy and some reaches the soil as throughfall. A signifi-cant amount of rainwater intercepted by the canopy can flow down along tree stems and reach the forest floor in a pro-cess termed stemflow. The efficiency of stemflow varies with plant species, seasons, meteorological conditions, rainfall in-tensity and canopy structure (Levia and Frost, 2003; Levia and Germer, 2015). Johnson and Lehmann (2006) summa-rized various field measurements and showed that the frac-tion of precipitafrac-tion that becomes stemflow ranges from 0.07 to 22 %.
stemflow hydrology and preferential flow along roots are in-timately linked, but direct integration of these processes into land models, to our knowledge, has not been reported.
In this paper, we parameterized the stem–root flow pro-cesses in a land surface model named the Simplified Sim-ple Biosphere Model (SSiB; Xue et al., 1991), and analyzed how stem–root flow affects soil moisture and whether this effect is significant enough to influence atmospheric pro-cesses. Soil moisture data from two sites, located at Lien Hua Chih, Taiwan (LHC), and Bordeaux/Toulouse, France (from the HAPEX–Mobilhy experiment, hereafter called HAPEX), were collected for model evaluation. The two sites repre-sent different climate regimes and terrestrial ecosystems, and stem–root flow modifies their surface energy and water pro-cesses in somewhat dissimilar ways.
2 Methodology
2.1 The stem–root flow model
In the original SSiB land surface model (Xue et al., 1996), vertical soil moisture movement is described by the diffusion equations: ∂θ1 ∂t = 1 D1
P+Q12−ESE−b1ETR,1 ∂θ2 ∂t = 1 D2
−Q12+Q23−b2ETR,2 (1) ∂θ3
∂t =
1
D3
−Q23+Q3−b3ETR,3
,
where the subscripts 1, 2 and 3 are indices of the top, middle and bottom soil layers, respectively; θ is the soil moisture content, expressed as a fraction of the saturated value; D is soil thickness; P is effective precipitation flux on the soil surface, composed of the direct throughfall and the throughfall from leave-intercepted rainfall (cf. Fig. 1);
Qij= −k
∂9/∂z+1is the flux of water between theith andjth layers, and is defined to be positive in an upward di-rection;9(in m) is the soil water potential;ESEis the evap-oration rate of bare soil;iis the soil layer index;ETR,iis the
P′≡P −q0. (2)
By relating the stemflow to leaf drainage, there is an im-plicit threshold for stemflow initiation that corresponds to the threshold of leaf drainage.
After entering the soil, the root flow is divided into a down-ward transfer fluxqz (within the root system) and a lateral
transfer fluxqx(from the root surface to the soil). These two
fluxes can be parameterized as follows:
qz,i=αzAihiVs (3)
qx,i=
αxRiAiK (9i)
9
i−9s Deff
ifhi >0
0, ifhi=0
, (4)
where αz and αx are proportionality coefficients; Ai (in
m2m−3)is the total root surface area density that varies with vegetation types (Böhm, 1979; Zhang et al., 2005; Li et al., 2013);hi (in m) is the thickness of water on the root
sur-face;Vs (in m s−1)is the terminal velocity of root flow;Ri
(in m) is the root length;K(in m s−1)is the hydraulic con-ductivity of the soil;9s (in m) is the soil water potential at saturation;9i(in m) is the soil water potential;Deff(in m) is the effective thickness of the water–soil interface. Derivation ofDeffis described in the Appendix. Due to a lack of obser-vational data, we used a vertically uniform root distribution. However, different root depths were used based on the mea-surements (100 cm for LHC and 140 cm for HAPEX). Note thatq0=qx,1+qz,1according to the mass conservation prin-ciple. From Eqs. (1), (2) and (3), we have
∂θ1 ∂t =
1
D1
P′+Q12−ESE−b1ETR,1+qx,1 ∂θ2 ∂t = 1 D2
−Q12+Q23−b2ETR,2+qx,2 (5) ∂θ3
∂t =
1
D3
−Q23+Q3−b3ETR,3+qx,3
.
The changes in root surface water thicknesshi obey the mass
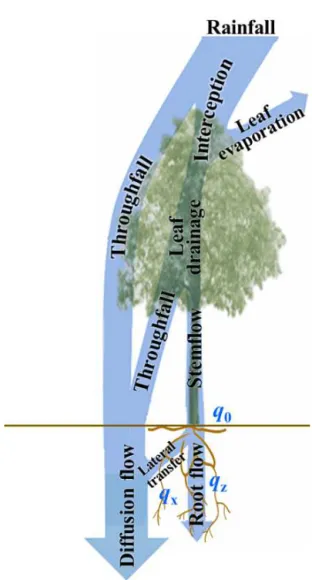
de-Figure 1. Stem–root flow conceptual diagram. Leaf drainage in the model can be separated into throughfall and stemflow. Following the stemflow path, rainwater can continue via the root system to reach deep soil layers and the water table. The stemflow that reaches the top soil layer,q0, is divided into a downward transfer flux (i.e., the root flow)qzand a lateral transfer fluxqx (from the root
sur-face to the soil), and the two transfer fluxes regulate the root-flow thickness.
scribed as dhi
dt =
qz,i−1−qz,i−qx,i
AiRi
ifhi >0
0, ifhi=0
. (6)
Equations (5) and (6) represent the water budgets in the soil and root-flow systems, respectively, and they are linked through the termqxin Eq. (4).
Stemflow input into the first soil layer (q0)is represented as a fraction of the leaf drainage (LD), which is the portion of precipitation that is intercepted by the canopy minus leaf evaporation and can be calculated in SSiB. LD is similar to canopy drip in some other models, and is represented mainly as a function of the leaf area index (LAI). The stemflow to
leaf drainage ratio (SLR; i.e., q0/LD) depends mainly on plant type, as well as meteorological conditions such as wind speed (Levia and Frost, 2003; Johnson and Lehmann, 2006; André et al., 2008; Siegert and Levia, 2014). Unfortunately, there is still insufficient information to determine SLR. We conducted a series of sensitivity tests with systematically varying SLR to assess the uncertainty.
The stem–root flow parameterization was tested using the offline SSiB, which is a simplified version of the land-biosphere model developed by Sellers et al. (1986). The model recognizes 12 different vegetation types according to Dorman and Sellers (1989), and is set up with three soil lay-ers and one canopy layer. The SSiB model has eight prog-nostic variables: soil wetness for three layers; temperature at the canopy, ground surface and deep soil layers; snow depth at ground level; and water intercepted by the canopy. An ad-ditional variable –hi – was added for each soil layer to
ac-count for the stem–root flow mechanism. An implicit back-ward scheme was used to calculate the temperature tendency in the coupling of the lowest atmospheric model layer with SSiB, such that energy conservation between the land surface and the atmosphere was satisfied. Soil temperature was cal-culated using the force-restore method, and water movement in the soil was described by the diffusion equation as shown in Eq. (5).
Following typical offline simulation procedures for a single-column land surface model, in situ atmospheric data were applied to drive the SSiB model in 30 min time resolu-tion. These specified variables include pressure, temperature, humidity, wind speed, net radiation and rainfall. Soil condi-tions were initialized with each site’s measurement data. The spin-up time for coupled land surface model typically ranges from a couple of months to over a year, but can be shorter when running in offline (single-column) mode and with good initial soil conditions (de Goncalves et al., 2006; Yang et al., 2011; Lim et al., 2012; Angevine et al., 2014). Our simula-tions applied measurement data for model initialization, and the results show that the soil conditions reached physical bal-ance within a few weeks. Therefore, for the last 10 months, results of our simulations are reliable.
2.2 Experimental design and site information
Figure 2. The hourly soil moisture (curves, right axis) and precipi-tation (red bars, left axis) observed at LHC during 2010. SM1, SM2 and SM3 represent soil moisture at 10 cm (green dashed curve), 40 cm (blue dashed curve; average of 30 and 50 cm observations) and 90 cm (magenta dashed curve), respectively.
hardwood species, including Cryptocarya chinensis, Engel-hardtia roxburghiana, Tutcheria shinkoensis and Helicia for-mosana. The soil has a loamy texture with an average bulk density of 1.29 g cm−3 and a porosity of 0.53 over the top 1.0 m (Chen, 2012). Soil moisture measurements were col-lected at depths of 10, 30, 50, 70 and 90 cm.
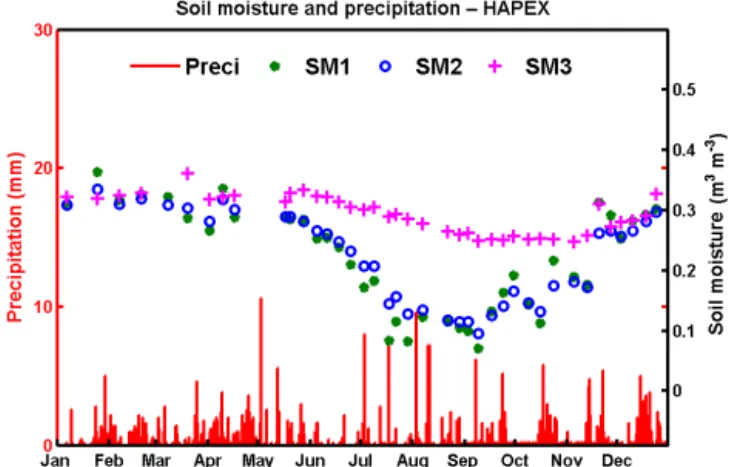
The second site is the HAPEX–Mobilhy data collected at the Caumont site (SAMER station No. 3; 43◦41′N, 0◦6′W) with an elevation of 113 m a.s.l. and relatively flat terrain. This site has a Mediterranean climate, with an annual rain-fall of 856 mm, most of which occurs in spring and win-ter (Fig. 3). In contrast to the LHC site with dense forest, the HAPEX site is covered mostly with short and sparse soya crops, and the surface albedo stays nearly constant at 0.20 throughout the year (Goutorbe et al., 1989). The soil type is mainly silt, mixed with sand and clay (see Table 1). Soil moisture content was measured every 10 cm from the surface to a depth of 1.6 m using neutron sounding probes on a weekly basis (Goutorbe, 1991; Goutorbe and Tarrieu, 1991). Note that the HAPEX data have higher vertical reso-lution in the soil column but lower temporal resoreso-lution com-pared with the LHC data. To simplify comparisons, the soil moisture data were converted into three vertical layers. For the HAPEX data, the top (SM1), middle (SM2) and bottom (SM3) layers correspond to the 0–20, 20–50 and 50–150 cm depths, respectively. For LHC, SM1 corresponds to a depth of 10 cm, SM2 is the average of the 30 and 50 cm soil layers and SM3 corresponds to a depth of 90 cm.
Figures 2 and 3 show the seasonal variations of precipita-tion and soil moisture at different depths. It is generally ex-pected that soil moisture response to rainfall should be faster in the upper than in the lower layers. However, the LHC mea-surements (Fig. 2) showed that the soil moisture fluctuation was stronger in the middle layer than in the upper layer
dur-Figure 3. The weekly soil moisture (symbols, right axis) and hourly precipitation (red bars, left axis) observed at HAPEX during 1986. SM1, SM2 and SM3 represent the mean soil moisture in the 0– 20 cm (green dot), 20–50 cm (blue circle) and 50–160 cm (magenta cross) layers, respectively.
ing the dry season when the soil moisture was not saturated. Fluctuations were not obvious in rainy seasons when SM2 and SM3 are almost saturated. This phenomenon is likely an indication of the preferential flow due to the root-flow mech-anism. This phenomena, however, was not observed in the HAPEX data (Fig. 3), which may be due to the coarse tem-poral resolution (weekly) of the data or a weaker root-flow effect from the soya crop, and the latter will be discussed later. Figure 4 shows the correlation between hourly changes in precipitation and soil moisture at LHC in 2010. The corre-lations are higher at deeper layers and during stronger rain-fall intensities. Such a relationship is a good indication of the stem–root flow mechanism.
To test the response of soil moisture to precipitation in these two sites using the modified SSiB model, a set of parameters have to be selected. These include the soil and terrain properties listed in Table 1, as well as the monthly LAI coefficients in Table 2. In addition, some parameters in Eqs. (3–6) have to be decided. Two required but little-known parameters are the root-flow velocityVs and the SLR. The root-flow velocityVsis related to root structure and soil tex-ture, but such information is very limited. Studies have indi-cated that water flow in the root channel is approximately 100 times higher than the soil diffusion flow (Beven and Germann, 1982; Liu et al., 1994; Jarvis and Dubus, 2006; Köhne et al., 2009; Gerke, 2014). The maximum soil diffu-sion flow can be represented by the saturated hydraulic con-ductivity, which was measured as 4×10⁻⁶m s−1at HAPEX and 1×10⁻⁶m s−1at LHC. Therefore, we set the root-flow velocityVsas 10−4m s−1in the simulation, and will discuss the associated uncertainty later.
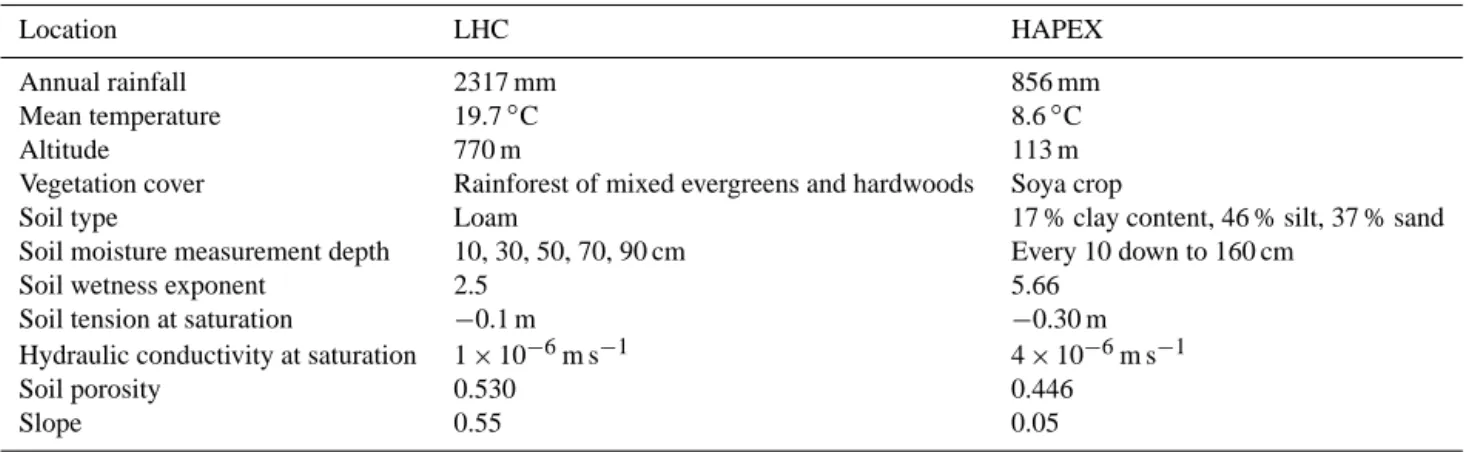
Table 1. Basic parameters used for describing the LHC and HAPEX sites. LHC data were obtained from Wu (2011); HAPEX data were obtained from Goutorbe et al. (1989).
Location LHC HAPEX
Annual rainfall 2317 mm 856 mm
Mean temperature 19.7◦C 8.6◦C
Altitude 770 m 113 m
Vegetation cover Rainforest of mixed evergreens and hardwoods Soya crop
Soil type Loam 17 % clay content, 46 % silt, 37 % sand
Soil moisture measurement depth 10, 30, 50, 70, 90 cm Every 10 down to 160 cm
Soil wetness exponent 2.5 5.66
Soil tension at saturation −0.1 m −0.30 m
Hydraulic conductivity at saturation 1×10⁻⁶m s−1 4×10⁻⁶m s−1
Soil porosity 0.530 0.446
Slope 0.55 0.05
Table 2. Monthly leaf area index values (in m2m−2)for LHC in 2010 and HAPEX in 1986. LHC data were obtained from Wu (2011); HAPEX data were obtained from Goutorbe et al. (1989).
Month 1 2 3 4 5 6 7 8 9 10 11 12
LHC 3.34 3.08 3.06 3.04 4.35 4.77 4.84 4.91 4.66 4.4 4.2 4.25
HAPEX 0 0 0 0 1 3 3 3 3 0 0 0
Figure 4. Correlation between hourly changes in precipitation and soil moisture at the Lien Hua Chih station in 2010. The ordinate is the soil depth and the abscissa is the rainfall intensity. Color shading indicates the correlation coefficient, with values shown in the color bar to the right.
systematically varying SLR from 0 to 100 %, and identi-fied optimal value that yielded the best soil moisture profiles compared with the observations. The optimal SLR value for the HAPEX experiment was approximately 50 %, compared with 90 % for the LHC case. These values reflect the large contrast in leaf coverage and plant type between the two sites.
In these experiments, we setAi to 0.5 m2m−3based on the
study by Li et al. (2013), and the proportionality coefficients,
αzandαx, are set to 1. The uncertainty discussion forVsand SLR should include the uncertainty caused by these param-eters. When more observational data are available, we could revisit these issues further. All simulations used an integra-tion time step of 30 min.
3 Effect of stem–root flow on soil moisture
overesti-Figure 5. Simulated and observed soil moisture for the LHC site at depths of (a) SM1 (0–20 cm), (b) SM2 (20–70 cm) and (c) SM3 (70–170 cm). Observed results are shown as blue dots. Simula-tions with SLR=0 (i.e., control run, without stem–root flow) and SLR=90 % are shown as black dashed and red dashed curves, re-spectively. The area of grey shading enclosed by SLR=0 % and 100 % indicates the possible range of the stem–root flow effects. All simulation results are daily averages.
mated soil moisture in spring and winter, but underestimated it during autumn. Such discrepancies are generally less sub-stantial when the stem–root flow mechanism is included, as indicated by the generally lower bias and root-mean-square error shown in Table 3. The possible causes of error will be elaborated in the discussion section.
For the HAPEX case, the simulations also captured the seasonal cycle as well as the sharp fluctuations in the top layer well (Fig. 6). The responses of SM2 and SM3 to
Figure 6. Same as Fig. 5, but for the HAPEX case at depths of (a) SM1 (0–20 cm), (b) SM2 (20–50 cm) and (c) SM3 (50–160 cm). Red dashed curves are results with SLR=50 %.
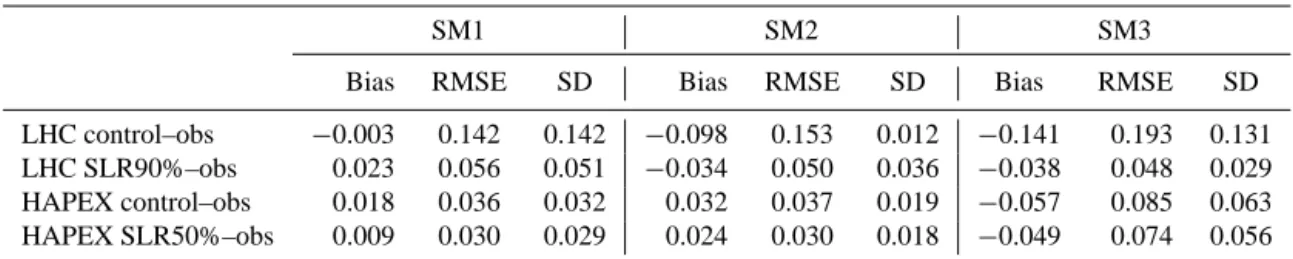
Table 3. The mean bias, root-mean-square error (RMSE) and standard deviation (SD) in simulated soil moisture compared to observations (obs). Control refers to simulations without the stem–root flow mechanism, and SLR90% or SLR50% are simulations with the optimal stemflow to leaf drainage ratio. Unit: m3m−3.
SM1 SM2 SM3
Bias RMSE SD Bias RMSE SD Bias RMSE SD
LHC control–obs −0.003 0.142 0.142 −0.098 0.153 0.012 −0.141 0.193 0.131 LHC SLR90%–obs 0.023 0.056 0.051 −0.034 0.050 0.036 −0.038 0.048 0.029 HAPEX control–obs 0.018 0.036 0.032 0.032 0.037 0.019 −0.057 0.085 0.063 HAPEX SLR50%–obs 0.009 0.030 0.029 0.024 0.030 0.018 −0.049 0.074 0.056
Table 4. Mean and maximum changes in daily temperatures and energy fluxes due to the stem–root flow (between optimal SLR run and control run) during the growing season. Canopy air temperature (TC), soil surface temperature (TS)and leaf temperature (TL)are in◦C; transpiration (TR), soil evaporation (SE), leaf evaporation (LE), sensible heat (SH) and latent heat (LH) are in W m−2.
1TC 1TS 1TL 1TR 1SE 1LE 1SH 1LH
LHC mean 0.32 0.31 0.34 0.20 −1.19 0.31 2.02 −0.68 LHC maximum 2.90 2.59 3.18 1.01 −15.50 11.34 31.44 −16.81 HAPEX mean 0.04 0.11 0.03 1.06 −2.17 0.28 0.52 −0.82 HAPEX maximum 1.27 1.63 1.70 −66.74 −19.5 9.95 51.16 −66.29
SSiB does not consider the potential role of plant uptake, which might be potentially important in the middle layer. In the bottom layer, more accurate soil moisture was obtained with SLR=100 %, but this does not necessarily mean that the stem–root flow was underestimated. The overestimation of soil moisture in SM1 and the underestimation in SM3 in spring may be coupled, due to mechanisms that are missing in our model. This issue will be elaborated in the discussion section.
It is also worth mentioning that both the observation and simulation showed weaker soil moisture fluctuations in the middle than in the surface layer, a feature very different from the LHC case. It is likely that there is a weaker stem–root flow associated with plant and soil types in the HAPEX case. Figures 5 and 6 demonstrate that the strength of the stem– root flow is greater in LHC, with associated changes in soil moisture of up to 0.1 m3m−3compared with the maximum changes of 0.05 m3m−3at HAPEX. This is simply because LHC has more intense rainfall than HAPEX.
4 Effect of stem–root flow on energy flux
The results in the last section show that stem–root flow can alter the vertical profile of soil moisture. It is important to know whether such a modification has significant effects on evapotranspiration and associated interactions between the land and atmosphere. The soil moisture in the top soil layer in the LHC case generally decreased due to stem–root flow, except in some instances (e.g., mid-September, the later dry season) when the enhanced moisture storage in the deep lay-ers replenishes the moisture in the drying surface soil through
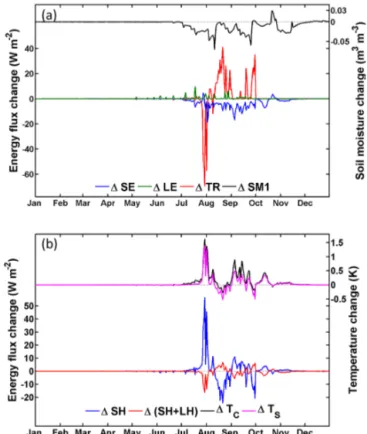
moisture diffusion. The changes in plant transpiration, how-ever, were insignificant (red curve in Fig. 7a), as this process is associated with soil moisture not only in the top layer but also in the deeper layers that are within the reach of the root system. Therefore, the effect of surface layer drying on tran-spiration may be compensated by the moistening of the lower layers. Soil moisture in these layers is well above the wilting point to support normal transpiration. Meanwhile, the drying of the surface soil resulted in less soil evaporation (Fig. 7a), which heavily relies on soil moisture near the soil surface, and thus weakens the total latent heat release (see Table 4 for the mean and maximum changes in daily temperatures and energy fluxes). This led to a higher soil surface tempera-ture and consequently stronger sensible heat flux (blue curve in Fig. 7b), which resulted in warmer air (magenta curve in Fig. 8b) and thus stronger rainwater evaporation from the leaf surface (green curve in Fig. 7a).
In the HAPEX case, the stem–root flow caused a gen-eral drying of the top soil, except for a brief period in mid-October (Fig. 8a). However, responses in soil evaporation were not as straightforward as in the LHC case. For example, in late July (just after the start of the growing season) there was a spike in the evaporation but a reduction in the moisture of the top soil layer (blue curve in Fig. 8a). As wind speed is the same for both cases, the increase in soil evaporation must be due to either a higher soil temperature and/or a lower wa-ter vapor density in the air near the soil surface. This was indeed the case (magenta and black curves in Fig. 8b) and found to be driven by changes in transpiration.
Figure 7. Difference in daily mean heat fluxes and soil moisture due to stem–root flow at the LHC case. (a) Changes in soil evaporation (SE; blue curve), leaf evaporation (LE; green curve), transpiration (TR; red curve) and soil moisture of the surface layer (SM1; black curve; right axis); (b) changes in sensible heat (SH; blue curve), total heat (sensible heat plus latent heat (SH+LH); red curve), canopy air temperature (TC; magenta curve; right axis) and soil tem-perature (TS; black curve; right axis). Grey dashed lines indicate the zero baseline.
wilting point. The stomatal resistance that controls transpi-ration is very sensitive to the soil moisture near the wilting point. As such, a slight decrease in the moisture of the top soil layer can dramatically reduce transpiration. When soil moisture approached the wilting point in late July, plant tran-spiration reduced sharply in response to the stem–root flow effect (red curve in Fig. 8a). Such a change in plant transpi-ration caused an increase in the air temperature near the soil surface (magenta curve in Fig. 8b) and a decrease in air hu-midity, which increased soil evaporation (blue curve in Fig 8a). In early August, however, soil moisture accumulated in the bottom layer through the stem–root flow (cf. Fig. 6c) and the stomatal resistance began to decrease such that transpi-ration recovered and soon dominated the overall evapotran-spiration throughout the rest of the growing season. The in-creased transpiration also caused a reduction in air temper-ature and surface tempertemper-ature and thus the associated sensi-ble heat flux (blue curve in Fig. 8b). During late August to mid-September, surface soil moisture was so low in some
in-Figure 8. Same as Fig. 7, but for the HAPEX case.
stances (cf. Fig. 6a), that transpiration ceased with or without the stem–root flow effect. In these instances, the net energy flux was controlled by soil evaporation (Fig. 8b).
5 Discussion
The above analyses indicate that stem–root flow affects the energy flux mainly through changing the balance between surface soil evaporation and sensible heat fluxes in the hu-mid environment of LHC, and through changing plant tran-spiration and sensible heat fluxes over the relatively dry vironment at HAPEX. The associated changes in annual en-ergy flux to the atmosphere are strongly positive at LHC, but nearly balanced at HAPEX. However, the magnitude of the changes of the individual energy flux component was signifi-cantly higher for HAPEX (peaked at approximately−67 and +51 W m−2for transpiration and sensible heat, respectively) than for LHC (peaked at approximately−16 and+31 W m−2 for evaporation and sensible heat, respectively) due to its drier Mediterranean environment.
but by latent heat at HAPEX. Budyko (1974) proposed two main evapotranspiration regimes: soil-moisture-limited and energy-limited. As summarized by Seneviratne et al. (2010), when soil moisture remains above a critical value, the frac-tion of evapotranspirafrac-tion of the total energy flux is indepen-dent of the soil moisture content (energy-limited regime); be-low the critical soil moisture value, the soil moisture content provides a first-order constraint on evapotranspiration (soil-moisture-limited regime). Therefore, the evapotranspiration responses to the stem–root flow as discussed above imply that HAPEX is in the soil-moisture-limited regime, whereas LHC is in the energy-limited regime. Note that this regime separation needs to take the contribution of deep soil mois-ture to transpiration into account.
Regarding the partition of water transport, recent studies (e.g., Jasechko et al., 2013; Good et al., 2015; Wei et al., 2015) have explored the dominant role of transpiration in ecosystem evapotranspiration. The results of this work par-tially concur with these studies. In other words, the stem– root flow in the plant–soil system could enhance the transpi-ration, and reduce the soil evapotranspi-ration, which regulated the partition of evapotranspiration. A number of PILPS studies, including the PILPS–HAPEX experiment (Boone and Wet-zel, 1996; Henderson-Sellers, 1995; Shao et al., 1995; Xue et al., 1996), consistently demonstrated that the current land model parameterizations have a weakness in simulating the soil moisture in the dry season. This study, by introducing a parameterization on the stem–root flow mechanism, seeks to help solve this deficiency. With the stem–root flow mecha-nism, the soil moisture will redistribute in the vertical, lead-ing to better simulated results in each layer, which is impor-tant for the evapotranspiration partition.
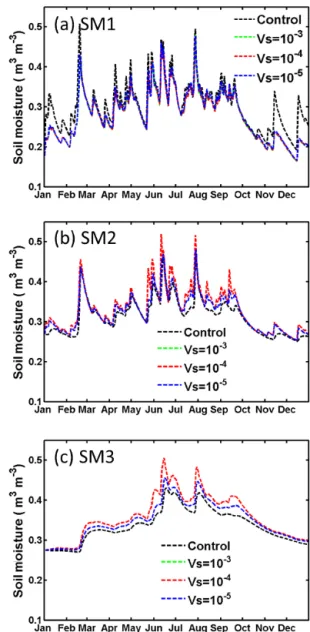
By including the stem–root flow mechanism, the land sur-face model appears to better simulate the vertical distribution of soil moisture. However, significant discrepancies still ex-ist in the model based on comparisons with observed data. The discrepancies may be associated with uncertainties in soil-related physical parameters, such as a few that we listed in the earlier sections. For example, a wide range of values have been reported in the literature for the parameterVs. In the above simulations, we assignedVs=10−4m s−1, which is probably at the low end of the documented values. An ad-ditional simulation was performed using a tenfold higherVs value (i.e.,Vs=10−3m s−1), and the resulting soil moisture changes were similar to those presented in Figs. 5 and 6, with differences of only a few percent, and thus are barely legible in Figs. 9 and 10. When a smaller value ofVs=10−5m s−1 was used, the effect of stem–root flow on soil moisture was similar but the magnitude of the changes was reduced by ap-proximately 50 %. These sensitivity tests give an indication of the uncertainties associated withVs.
Figure 9. Sensitivity test on Vs for the LHC case with optimal SLR=90 % at depths of (a) SM1 (0–20 cm), (b) SM2 (20–70 cm) and (c) SM3 (70–170 cm). The green dashed, red dashed and blue dashed curves are forVs=10−3, 10−4 and 10−5m s−1, respec-tively. Also shown by black dashed curves are the control run results (i.e., SLR=0).
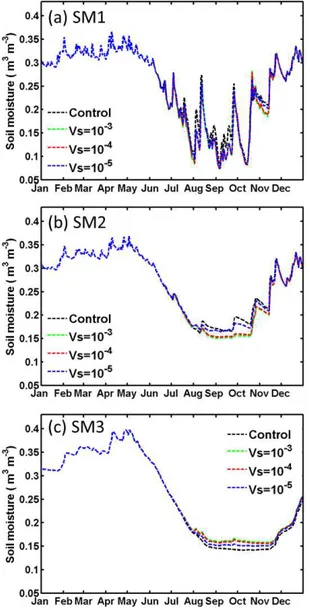
Figure 10. Same as Fig. 9, but SLR=50 % for the HAPEX case at depths of (a) SM1 (0–20 cm), (b) SM2 (20–50 cm) and (c) SM3 (50–160 cm).
could exist to retard surface drainage. Another critical issue is the treatment of water flow across the bottom soil layer. In our current model, soil moisture can leave the bottom layer with a fixed efficiency, but no recharge from the water ta-ble below is allowed. These issues might cause the model to underestimate the soil moisture in the bottom layer (re-gardless of the presence of stem–root flow), which occurred in both the LHC and HAPEX simulations (cf. Figs. 5c and 6c). On the other hand, the overestimation of soil moisture in SM1 and the underestimation in SM3 in spring at LHC (Fig. 5) could also be explained by missing mechanisms such as hydraulic redistribution (cf. Brooks et al., 2002), which provides a bypass of soil moisture through the inside of the root rather than the exterior surface of the root, as in the case of stem–root flow transport. On the other hand, the overesti-mation of the middle-layer soil moisture at HAPEX may be
terpretation of model improvements acquired in this study. Since this exploratory study focuses on introducing the stem– root flow mechanism in a land surface model and testing its possible impact, we will not further test the uncertainty due to other parameters in this paper. We hope more relevant measurements (such as the root distribution, stemflow to leaf drainage ratio and root-flow velocity) will provide useful in-formation to study these issues further.
6 Conclusion
In this study, a stem–root flow mechanism, which provides an efficient water channel for rain to penetrate into deep soil, was formulated and implemented into an offline version of the SSiB land–atmosphere model. The model was used to simulate soil moisture variation at two sites with different cli-mate and ecology conditions: LHC, with a mountain rainfor-est climate and HAPEX, with a Mediterranean climate. The results showed that the inclusion of the stem–root flow mech-anism substantially improved the capability of the model to simulate vertical soil moisture profiles. Stem–root flow gen-erally caused a drying of the top soil layer (upper 20 cm) and a moistening of the bottom layer (below 50 cm) in the model. On a few occasions, such as after a long dry period, the sur-face layer may be less dry than without the stem–root flow due to greater water supply from the lower layers. The mid-dle soil layer at LHC was also moistened and, in many in-stances during rainfall events, the moisture in this layer fluc-tuated more intensely than in the top layer in response to the stem–root flow. However, in the HAPEX case, the middle layer became drier with less fluctuation. Due to differences in plant and soil types, the strength of the stem–root flow was greater at LHC than at HAPEX.
flux between the soil and atmosphere is mainly controlled by sensible heat. In this sense, LHC may be considered as having an energy-limited evapotranspiration regime. In con-trast, the HAPEX soil (especially the top layer) was generally drier and sometimes fell below the wilting point. Plant tran-spiration can thus be substantially affected by the stem–root flow. Changes in transpiration lead to changes in air tempera-ture, which, in turn, influence soil temperature. This effect is stronger than that resulting from the soil evaporation associ-ated with changes in the soil moisture of the top soil layer. At the HAPEX site, evapotranspiration was more soil-moisture-limited than energy-soil-moisture-limited, and its net change in heat flux associated with the stem–root flow was dominated by latent heat. While the stem–root flow effect on soil moisture was weaker there than at LHC, the energy flux exchanges were actually stronger due to the sensitive transpiration process.
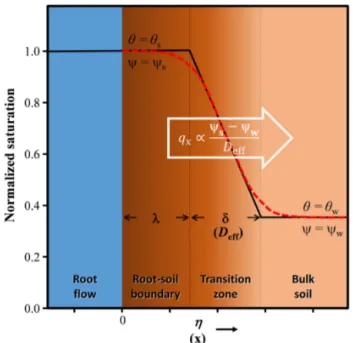
Figure A1. Schematics of the root flow–soil boundary and soil moisture transition for the parameterization of horizontal water flux qx. The red dashed line represents the analytical solution, and the
black-solid line represents the parameterization. Soil moisture is saturated (i.e.,θs)in the root–soil boundary (widthλ), and decreases linearly in the transition zone (widthδ) before reaching that of the bulk soil (θw).
The parameterDeffin Eq. (4) was derived in a similar fash-ion as in Zimmerman and Bodvarsson (1991). As shown in Fig. A1, the part of soil next to the root flow absorbs water and form a thin, saturated boundary of width λ. A gradient of soil moisture is formed in the transition zone (of widthδ), with soil water potential decrease from the saturated state,
9s, to that of the bulk soil,9w. Diffusion of soil moisture
toward the bulk soil is directly proportional to this gradient. The soil moisture horizontal (x direction) movement can be expressed as follows:
ρ∂θ ∂t =
∂ ∂x
K(9)∂9 ∂x
, (A1)
whereρis soil porosity;θis the ratio of soil moisture content to its saturated state; K(in m s−1)is the hydraulic conduc-tivity of the soil;9 (in m) is the soil water potential. Equa-tion (A1) is subject to the following initial and boundary con-ditions:
θ (0, t )=1, θ (x,0)=θw, θ (x→ ∞, t )=θw. (A2) The first condition means that when the root flow occurs, soil at the root–soil interface (x=0) is saturated. The next two conditions specify the initial bulk soil moisture content,θw,
By introducing a similarity variableη and two normalized variables9ˆ andKˆ,
η≡ r ρ
Ks9st
,9ˆ ≡ 9
9s
andKˆ ≡ K
Ks
, (A5)
Eq. (A1) can be transformed into d
dη
ˆ
K9ˆd
ˆ
9
dη
! +η
2 dθ
dη =0, (A6)
whereas the initial and boundary conditions in Eq. (A2) re-duced to
θ (0)=1, θ (η→ ∞)=θw. (A7)
Zimmerman and Bodvarsson (1991) showed that the solution for Eq. (A6) with conditions in Eq. (A7) can be approximated as
θ=1, if 0≤η≤λ
θ=1−(1−θw)
η−λ
δ , ifλ < η≤λ+δ θ=θw, ifλ+δ < η <∞
, (A8)
where
δ=2 s
b
1+ 2
b(1−θw)
andλ= δ
b(1−θw)
. (A9)
That is, within the root–soil boundary (0≤η≤λ),θis satu-rated (i.e., 1); whereas in the transition zone (λ < η≤λ+δ),
θ decreases linearly from 1 to θw. Here, δ is the effective
thickness of diffusion in theηcoordinate, and it can be re-verted back to thex coordinate using the similarity conver-sion in Eq. (A5):
Deff=δ s
Ks9st
ρ . (A10)
Acknowledgements. This study was supported by the Ministry
of Science and Technology of the Republic of China on Taiwan through project MOST-100-2119-M-002-023-MY5. Y. Xue’s support is from US NSF AGS-1346813. We are also grateful to S. Sun for technical assistance on SSiB, M.-H. Li and Y.-Y. Chen for providing observation data, W.-L. Liang for helpful suggestions and the National Center for High-performance Computing for computer time and facilities. We also deeply appreciate three reviewers’ efforts to provide insightful and constructive comments and suggestions to improve and revise the paper.
Edited by: P. Gentine
References
André, F., Jonard, M., and Ponette, Q.: Influence of species and rain event characteristics on stemflow volume in a temper-ate mixed oak–beech stand, Hydrol. Process., 22, 4455–4466, doi:10.1002/hyp.7048, 2008.
Angevine, W. M., Bazile, E., Legain, D., and Pino, D.: Land surface spinup for episodic modeling, Atmos. Chem. Phys., 14, 8165– 8172, doi:10.5194/acp-14-8165-2014, 2014.
Beven, K., and Germann, P.: Macropores and water flow in soils, Water Resour. Res., 18, 1311–1325, 1982.
Böhm, W.: Methods of studying root systems, Springer-Verlag, Berlin, Heidelberg, New York„ 1979.
Boone, A. and Wetzel, P. J.: Issues related to low resolution model-ing of soil moisture: experience with the PLACE model, Global Planet. Change, 13, 161–181, 1996.
Brooks, J. R., Meinzer, F. C., Coulombe, R., and Gregg, J.: Hy-draulic redistribution of soil water during summer drought in two contrasting Pacific Northwest coniferous forests, Tree Physiol., 22, 1107–1117, 2002
Budyko, M. I.: Climate and Life, Academic Press, New York, 1974. Chase, T. N., Pielke, R. A., Kittel, T. G. F., Nemani, R., and Run-ning, S. W.: Sensitivity of a general circulation model to global changes in leaf area index, J. Geophys. Res.-Atmos., 101, 7393– 7408, 1996.
Chase, T. N., Pielke Sr., R. A., Kittel, T. G. F., Nemani, R. R., and Running, S. W.: Simulated impacts of historical land cover changes on global climate in northern winter, Clim. Dynam., 16, 93–105, 2000.
Chen, Y.-Y.: Investigating the Seasonal Variability of Surface Heat and Water Vapor Fluxes with Eddy Covariance Techniques: a Subtropical Evergreen Forest as an Example, Doctoral Disser-tation, Graduate Institute of Hydrological and Oceanic Sciences, National Central University, Jhongli, 149 pp., 2012.
Clapp, R. B. and Homberger, G. M.: Empirical equations for some soil hydraulic properties, Water Resour. Res., 14, 601–604, 1978. de Goncalves, L. G. G., Shuttleworth, W. J., Burke, E. J. , Houser, P., Toll, D. L., Rodell, M., and Arsenault, K.: Toward a South America Land Data Assimilation System: Aspects of land sur-face model spin-up using the Simplified Simple Biosphere, J. Geophys. Res., 111, D17110, doi:10.1029/2005JD006297, 2006. Dorman, J. L. and Sellers, P. J.: A Global climatology of albedo, roughness length and stomatal resistance for atmospheric gen-eral circulation models as represented by the Simple Biosphere Model (SiB), J. Appl. Meteorol., 28, 833–855, 1989.
Gerke, H.: Bypass flow in soil, in: Encyclopedia of Agrophysics, edited by: Gli´nski, J., Horabik, J., and Lipiec, J., Encyclopedia of Earth Sciences Series, Springer, the Netherlands, 100–105, 2014. Good, S. P., Noone, D., and Bowen, G.: Hydrologic connectivity constrains partitioning of global terrestrial water fluxes, Science, 349, 175–177, 2015.
Goutorbe, J. P.: A Critical assessment of the Samer network accu-racy, in: Land Surface Evaporation, edited by: Schmugge, T. and André, J.-C., Springer, New York, 171–182, 1991.
Goutorbe, J. P. and Tarrieu, C.: HAPEX-MOBILHY data base, in: Land Surface Evaporation, edited by: Schmugge, T. and André, J.-C., Springer, New York, 403–410, 1991.
Goutorbe, J.-P., Noilhan, J., Valancogne, C., and Cuenca, R. H.: Soil moisture variations during HAPEX-MOBILHY, Ann. Geophys., 7, 415–426, 1989.
Henderson-Sellers, A.: Soil moisture simulation: Achievements of the RICE and PILPS intercomparison workshop and future di-rections, Global Planet. Change, 13, 99–115, 1996.
Henderson-Sellers, A., Pitman, A. J., Love, P. K., Irannejad, P., and Chen, T. H.: The Project for Intercomparison of Land Surface Parameterization Schemes (PILPS): Phases 2 and 3, B. Am. Me-teorol. Soc., 76, 489–503, 1995.
Jarvis, N. J. and Dubus, I. G.: State-of-the-art review on preferential flow, www.eu-footprint.org (last access: 5 June 2012), 60 pp., 2006.
Jasechko, S., Sharp, Z. D., Gibson, J. J., Birks, S. J., Yi, Y., and Fawcett, P. J.: Terrestrial water fluxes dominated by transpiration, Nature, 496, 347–350, doi:10.1038/nature11983, 2013. Johnson, M. S. and Lehmann, J.: Double-funneling of trees:
stem-flow and root-induced preferential stem-flow, Ecoscience, 13, 324– 333, 2006.
Köhne, J. M., Köhne, S., and Šim˚unek, J.: A review of model appli-cations for structured soils: a) Water flow and tracer transport, J. Contam. Hydrol. 104, 4–35, 2009.
Levia, D. F. and Frost, E. E.: A review and evaluation of stemflow literature in the hydrological and biochemical cycles of forested and agricultural ecosystems, J. Hydrol., 274, 1–29, 2003. Levia, D. F. and Germer, S.: A review of stemflow generation
dynamics and stemflow-environment interactions in forests and shrublands, Rev. Geophys., 53, 673–714, 2015.
Li, J., He, B., Chen, Y., Huang, R., Tao, J., and Tian, T.: Root dis-tribution features of typical herb plants for slope protection and their effects on soil shear strength, Transactions of the Chinese Society of Agricultural Engineering, 29, 144–152, 2013. Xiao-Yan Li, Zhi-Peng Yang, Yue-Tan Li, and Henry Lin:
Connect-ing ecohydrology and hydropedology in desert shrubs: stemflow as a source of preferential flow in soils, Hydrol. Earth Syst. Sci., 13, 1133–1144, doi:10.5194/hess-13-1133-2009, 2009. Li, X.-Y., Lin, H., and Levia, D. F.: Coupling ecohydrology and
hy-dropedology at different spatio-temporal scales in water-limited ecosystems, in: Hydropedology, edited by: Lin, H., Academic Press, Boston, 737–758, 2012.
Liang, W.-L., Kosugi, K., and Mizuyama, T.: Heterogeneous soil water dynamics around a tree growing on a steep hillslope, Va-dose Zone J., 6, 879–889, 2007.
ter yields from grassland and shrubland ecosystems in the Chi-huahuan Desert, Earth Surf. Proc. Land., 27, 1011–1020, 2002. Oki, T. and Kanae, S.: Global Hydrological Cycles and World Water
Resources, Science, 313, 1068–1072, 2006.
Sellers, P. J., Mintz, Y., Sud, Y. C., and Dalcher, A.: A Simple Bio-sphere Model (SIB) for use within general circulation models, J. Atmos. Sci., 43, 505–531, 1986.
Seneviratne, S. I., Corti, T., Davin, E. L., Hirschi, M., Jaeger, E. B., Lehner, I., Orlowsky, B., and Teuling, A. J.: Investigating soil moisture–climate interactions in a changing climate: A review, Earth-Sci. Rev., 99, 125–161, 2010.
Shao, Y., Anne, R. D., Henderson-Sellers, A., Irannejad, P., Thor-ton, P., Liang, X., Chen, T. H., Ciret, C., Desborough, C., Bara-chova, O., Haxeltine, A., and Ducharne, A.: Soil Moisture Sim-ulation, A report of the RICE and PILPS Workshop, GEWEX Tech. Note, IGPO Publ. Ser., 14, 179 pp., 1995.
Siegert, C. M. and Levia, D. F.: Seasonal and meteorological effects on differential stemflow funneling ratios for two deciduous tree species, J. Hydrol., 519, 446–454, 2014.
Tanaka, T., Taniguchi, M., and Tsujimura, M.: Significance of stemflow in groundwater recharge. 2: A cylindrical infiltration model for evaluating the stemflow contribution to groundwater recharge, Hydrol. Process., 10, 81–88, 1996.
Xue, Y., Zeng, F. J., and Schlosser, C. A.: SSiB and its sensitivity to soil properties – a case study using HAPEX-Mobilhy data, Global Planet. Change, 13, 183–194, 1996.
Yang, Y., Uddstrom, M., and Duncan, M.: Effects of short spin-up periods on soil moisture simulation and the causes over New Zealand, J. Geophys. Res., 116, D24108, doi:10.1029/2011JD016121, 2011.
Zhang, Y.-Q., Zhu, Q. K., and Qi, S.: Root system distribution char-acteristics of plants on the terrace banks and their impact on soil moisture, Acta Ecologica Sinica, 25, 500–506, 2005.
Zhao, M., Pitman, A. J., and Chase, T.: The impact of land cover change on the atmospheric circulation, Clim. Dynam., 17, 467– 477, 2001.