Article
Age-Related Changes in the Prevalence of Osteoporosis
according to Gender and Skeletal Site: The Korea National
Health and Nutrition Examination Survey 2008-2010
Jongseok Lee1, Sungwha Lee2, Sungok Jang1,3, Ohk Hyun Ryu2
1School of Business Administration, Hallym University; 2Department of Internal Medicine, Hallym University College of Medicine; 3
Department of Diagnostic Laboratory Medicine, Korea Association of Health Promotion Gangwon Branch, Chuncheon, Korea
Background: The incidence of osteoporosis and its related fractures are expected to increase significantly in the rapidly aging Korean population. Reliable data on the prevalence of this disease is essential for treatment planning. However, sparse data on Korean patients is available.
Methods: We analyzed data from the Korea National Health and Nutrition Examination Survey (KNHANES) 2008 to 2010. Bone mineral density (BMD) was measured at the femoral neck and lumbar spine using dual-energy X-ray absorptiometry. Os-teopenia and osteoporosis were diagnosed according to the World Health Organization T-score criteria. We analyzed the BMD data of 17,208 people (men, 7,837; women, 9,368).
Results: The adjusted prevalence of osteoporosis was 7.8% in men versus 37.0% in women. No significant difference was ob-served in the prevalence of osteopenia between genders (men, 47.0%; women, 48.7%). The prevalence of osteoporosis in men in their 50s was 4.0%, in their 60s was 7.2%, in their 70s was 15.1%, and in their 80s was 26.7%. The figures in women were 15.2%, 36.5%, 62.7%, and 85.8%, respectively. The age group with the maximal BMD differed between genders. In the men, 20s had the highest value in all the skeletal sites. However, in the women, the maximal BMD in the femoral neck, lumbar spine, and the total hip was observed in their 20s, 30s, and 40s, respectively. The onset age of osteoporosis differed between genders. Osteoporosis in the femoral neck began at 55 years in the women and at 60 years in the men.
Conclusion: The prevalence of osteoporosis in Korea was significantly high. In addition, the age-related changes in the preva-lence of osteoporosis differed according to gender and skeletal site.
Keywords: Bone density; Prevalence; Bone diseases, metabolic; Osteoporosis
INTRODUCTION
Osteoporosis is a disease that leads to an increased risk of fracture due to weakened bone strength. Despite no particular
symptoms, the occurrence of fractures leads to death in severe cases. In the case of a femur fracture, 20% to 30% of patients die within 1 year after the onset of the fracture [1,2]. The most common cause of osteoporosis is aging, which rapidly
pro-Received: 7 March 2013, Accepted: 1 May 2013
Corresponding author: Ohk Hyun Ryu
Department of Internal Medicine, Hallym University Chuncheon Sacred Heart Hospital, Hallym University College of Medicine, 77 Sakju-ro,
Chuncheon 200-704, Korea
Tel: +82-33-240-5833, Fax: +82-33-255-4291, E-mail: ohryu30@gmail.com
Copyright © 2013 Korean Endocrine Society
gresses after 50 years of age. Skeletal aging is known to prog-ress faster in women than in men due to hormonal changes af-ter menopause. One out of six men and one out of two women have a possibility of experiencing an osteoporosis-related fracture during their lifespan after an age of 50 years. In par-ticular, the risk of osteoporosis-related fractures has been re-ported to be higher in Asians [3]. Thus, the diagnosis and treatment of osteoporosis in the Korean elderly population have been considered important.
However, the domestic management system of osteoporosis is unfortunately inadequate. Among patients in their 50s who had an osteoporosis-related fracture, less than 50% of these patients had had a previous diagnosis or treatment of osteopo-rosis. In particular, among the fracture patients, the examina-tion rate was 24.8% in men, which was significantly lower than 55.7% in women. This is likely attributable to the incor-rect perception that osteoporosis is a female disease [4]. Thus, it is necessary to accurately identify the nation-wide preva-lence of osteoporosis and to efficiently manage osteoporosis patients.
Most domestic studies conducted until now did not use sub-ject samples that represented the general population, resulting in the reported prevalence of osteoporosis showing significant variation. According to the results of community-based studies conducted since 2006, the prevalence of osteoporosis in the lumbar spine and femoral neck in men was 6.5% to 12.9% and 1.3% to 5.8%, respectively, whereas it was 24.0% to 40.1% and 5.7% to 12.4% in women, respectively, which showed that a variation of 2 to 5 folds was observed depending on gender or skeletal site [5-9]. In addition, because the sampling num-ber was small and the subjects were distributed to particular groups such as patients who visited hospitals or persons who underwent health examinations, the subjects did not represent the entire Korean population.
According to the Health Insurance Review & Assessment Service, osteoporosis patients and their corresponding medical expenses have been recently increasing [10]. The number of osteoporosis patients who visited hospitals increased from 535,000 in 2007 to 773,000 in 2011, therefore showing an in-crease of approximately 45% in 5 years. The medical expenses increased from 53.5 billion won to 72.2 billion won, which showed an increase of approximately 35% during the same period. As elderly patients in their 60s, in particular, accounted for more than 70% of the total patients who visited the hospi-tals, the prevalence of osteoporosis and its medical expenses are expected to rapidly increase with the rapidly aging society.
The prevalence of osteoporosis is estimated to be more than 50% in women in their 60s, and socioeconomic expenses lated to osteoporosis and musculoskeletal disease has been re-ported to be 2.2 trillion won annually [11]. Thus, if a proper preventive management system is not established, there might be a heavy financial burden on the national health insurance system.
Bone mineral density (BMD) analysis has been included in the Korea National Health and Nutrition Examination Survey (KNHANES) since 2008, making it possible to conduct a na-tion-wide analysis of osteoporosis. In a recent study utilizing BMD analysis data, the prevalence of osteoporosis was report-ed to be 7.5% in men and 35.5% in women in their 50s [12]. Although the aforementioned study provided useful informa-tion on the nainforma-tion-wide prevalence of osteoporosis, the analy-sis was not conducted using a group that reflects the actual distribution of the Korean population. In our study, the preva-lence of osteoporosis was analyzed using the source data of the KNHANES 2008 to 2010, and an additional analysis was conducted according to gender, age, and skeletal site. In addi-tion, the prevalence of osteoporosis in Korea, which was ob-tained after adjusting for regional differences, was compared with that of other countries.
METHODS
Subjects
This study was conducted using the source data of the KNH-ANES 2008 to 2010 [13,14]. The KNHKNH-ANES is a nation-wide cross-sectional survey that has been periodically conducted by the Center for Disease Control of the Ministry of Health and Welfare since 1998. As for the sampling selection, families in cities and provinces across the country were selected as the subjects of the study, further stratified according to region, age, and gender, and then extracted probabilistically to obtain the sample representing the nationalwide population. In particular, the rolling survey sampling was introduced in the 4th and 5th surveys to obtain similar samples over the years. The contents of the survey consisted of a health, nutrition, and medical ex-amination, and the BMD examination has been included in the items of the medical examination since 2008.
osteo-porosis was analyzed in men and menopausal women aged 50 years or over. Among the subjects, 1,341 subjects who belong-ed to the following cases were excludbelong-ed from the analysis: 1) men or women aged 90 years or over; 2) women who did not respond regarding her menopausal state; 3) women who un-derwent hysterectomy; and 4) subjects who did not undergo a BMD examination for the lumbar spine, total hip, or femoral neck. In particular, the fourth exclusion criterion was used to compare the prevalence of osteoporosis among the three sites used in the diagnosis of osteoporosis. In summary, the data of the 17,205 total subjects (male, 7,837; female, 9,368) aged 10 to 89 years were used for the analysis of BMD, of whom 7,163 (male, 3,314; female, 3,849) men and menopausal women aged 50 years or higher were included in the analysis of the preva-lence of osteoporosis.
Methods
Body measurement and BMD examination
The subject’s age was calculated by rounding down two deci-mal places. For example, an age of 54 years ranged between
≥54.0 and <55.0 years. Height and weight were measured by a nurse who received a special training on using the height meter, the SECA 225 (Vogel & Halke, Hamburg, Germany), and the weight meter, the GL-6000-20 (CAS Korea, Seoul, Korea). The body mass index (BMI) was obtained by dividing the weight by the square of the height (m).
The BMD was measured using a Hologic device (DISCOV-ERY QDR4500W, Hologic Inc., Bedford, MA, USA) via dual-energy X-ray absorptiometry. BMD examination was perform-ed on the total hip (femoral trochanter, intertrochanteric, neck, and ward) and lumbar spine (mean of the lumbar spine 1 to 4).
Before the measurement, a quality control was performed us-ing the phantom provided by the manufacturer. To assess the accuracy of the device, the BMD of 30 randomly selected sub-jects was measured twice to determine the minimum tolerance (lumbar spine 1.9%, femoral neck 2.5%, total hip 1.8%).
Diagnosis of osteoporosis
The diagnosis of osteoporosis was performed in accordance with the standard recommended by the World Health Organi-zation [15]. In other words, the measured BMD was converted into the T-score using the reference value. Osteoporosis, os-teopenia, and normal status were diagnosed if the T-score was
≤-2.5, >-2.5 and <-1.0, and ≥-1.0, respectively. In addition, according to the recommendation by the International Society for Clinical Densitometry, osteoporosis was diagnosed based on the lowest T-score among the three sites (lumbar spine, to-tal hip, femoral neck) [16]. Thus, if the T-score of any of the three sites was ≤-2.5, the status was diagnosed as osteoporosis.
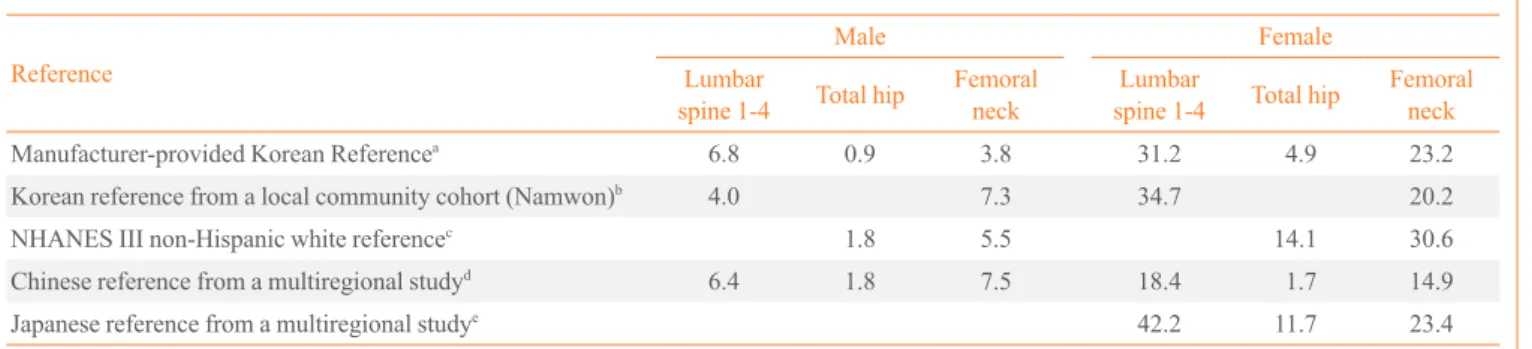
Reference value and analysis of the prevalence of osteoporosis after device calibration
The prevalence of osteoporosis may vary depending on the se-lection of the normal standard group or the reference group. Thus, changes in the prevalence of osteoporosis were analyzed using the reference value used in previous studies on the prev-alence of osteoporosis. To this end, the reference value used in a domestic study (in Namwon) [8], that of non-Hispanic white women in the United States National Health and Nutrition Ex-amination Survey (NHANES III) [17], that of Chinese men [18] and wo men [19], and that of Japanese women [20] were used (Table 1). As mentioned above, the reference value pro-vided by the manufacturer of the Hologic device was used in
Table 1. Reference Values to Calculate the T-Score
Reference
Male Female
Lumbar
spine 1-4 Total hip
Femoral neck
Lumbar
spine 1-4 Total hip
Femoral neck
Manufacturer-provided Korean referencea 1.024±0.120 0.940±0.137 0.846±0.124 1.006±0.115 0.851±0.115 0.803±0.107 Korean reference from a local community cohort
(Namwon)b
1.116±0.13 - 1.059±0.14 1.191±0.12 - 0.952±0.12
NHANES III non-Hispanic white referencec - - - - 0.942±0.122 0.858±0.120
Chinese reference from a multiregional studyd
0.954±0.094 0.948±0.124 0.862±0.115 1.116±0.12 0.963±0.13 0.927±0.12
Japanese reference from a multiregional studye - - - 1.031±0.109 0.886±0.105 0.801±0.106
Values are expressed as mean±SD.
this study. Thus, BMD conversion was required for studies us-ing the Lunar device [8,9,19]. To do this, the followus-ing con-version equation, suggested by Lu et al. [21], was used:
Standardized BMD=0.019+1.087×Hologic BMD Standardized BMD=-0.023+0.939×Lunar BMD
Statistical analysis
Statistical analysis was conducted using SPSS version 20.0 for Windows (IBM Co., Armonk, NY, USA). Continuous vari-ables including BMD were presented using mean±standard deviation, and the prevalence of osteoporosis was presented using percentage (%). In addition, for the comparison of this study with other studies, the prevalence of osteoporosis was standardized based on the result of the 2010 population census reference [22]. A chi-square independence test was conducted to compare the prevalence of osteoporosis according to gen-der. A P<0.05 was considered statistically significant.
RESULTS
General characteristics of the subjects
The physical characteristics of the subjects were analyzed ac-cording to gender and age (Table 2). When the subjects were grouped according to age units of 10 years, the mean weight was 72.78 kg in the male subjects in their 30s and 58.63 kg in the female subjects in their 40s, which were the highest values in the male and female groups, respectively. The mean height was shown to be 174.65 and 161.45 cm in the male and female subjects in their 20s, respectively, which were the highest val-ues. The BMI was shown to be 24.41 kg/m2
in the men in their 40s, and 24.48 kg/m2
in the women in their 60s, which were the highest values in the men and women, respectively. When the mean BMI of the total subjects aged 10 to 89 years was compared according to gender, it was higher in the men (23.59 kg/m2
) than in the women (23.03 kg/m2
). However, when the mean BMI of the subjects aged 50 to 89 years was compared according to gender, it was higher in the women (24.14 kg/m2
) than in the men (23.60 kg/m2
).
Mean BMD according to gender and age
For each of the three sites used in the diagnosis of osteoporo-sis (lumbar spine, total hip, and femoral neck), the mean BMD was analyzed according to gender and age (Table 3). The mean BMD of the total subjects (10 to 89 years) and that of the sub-jects aged 50 years or higher (50 to 89 years) were higher in the men than in the women for all the three sites. However,
when the mean BMD was compared among the age groups (10 year units) according to gender, the mean BMD was not al-ways higher in the men than in the women for all the three sites. The mean BMD of the subjects in their 10s, 30s, and 40s was higher in the women than in the men for the lumbar spine, whereas the mean BMD of the total subjects was higher in men than in women for the total hip and femoral neck.
The changes in the mean BMD are presented according to the age (10-year units) of men and women (Fig. 1). In the men, the maximal BMD was observed in the subjects in their 20s for all three sites, and the mean BMD continuously de-creased as age inde-creased (Fig. 1A). Meanwhile, in the women, the maximal BMD was observed in the different age groups according to skeletal site; in their 20s for the femoral neck, in their 30s for the lumbar spine, and in their 40s for the total hip (Fig. 1B). Unlike the men, the changes in the mean BMD of the women were insignificant for all three sites until their 40s, Table 2. Age-Stratified Anthropometric Characteristics of the Subjects
Age, yr Number Weight, kg Height, cm BMI, kg/m2
Men
10-89 7,837 67.59±12.15 168.88±7.83 23.59±3.38 50-89 3,314 65.53±9.77 166.45±5.59 23.60±2.97
10-19 902 57.31±15.60 163.86±12.95 21.01±3.86
20-29 865 72.50±12.22 174.65±5.50 23.75±3.70 30-39 1,351 72.78±11.02 172.90±5.85 24.32±3.29 40-49 1,405 71.03±10.16 170.44±5.70 24.41±3.01
50-59 1,221 68.72±9.11 168.35±5.61 24.22±2.81
60-69 1,174 65.65±9.21 166.24±5.72 23.72±2.88 70-79 773 61.69±9.66 164.48±5.67 22.76±3.07 80-89 146 58.24±9.15 162.75±5.65 21.94±2.91
Women
10-89 9,368 56.41±9.37 156.51±6.71 23.03±3.56 50-89 3,849 56.40±8.56 152.75±5.83 24.14±3.21 10-19 821 56.65±11.03 157.43±3.42 20.28±3.42
20-29 1,086 55.94±9.90 161.45±5.63 21.44±3.54
30-39 1,794 57.10±9.32 159.68±5.30 22.39±3.47 40-49 1,818 58.63±8.84 157.96±5.34 23.49±3.28 50-59 1,267 58.09±7.97 155.35±5.02 24.07±3.07
60-69 1,369 57.57±8.16 153.30±5.17 24.48±3.14
70-79 988 54.11±8.75 149.90±5.69 24.04±3.39 80-89 225 49.90±8.03 147.23±5.52 23.00±3.37
Table 3. Bone Mineral Density (g/cm2) by Gender and Age Group
Age, yr Number Lumbar spine
1-4 Total hip Femoral neck
Male
10-89 7,837 0.945±0.154 0.954±0.134 0.803±0.138 50-89 3,314 0.938±0.156 0.920±0.130 0.742±0.122
10-19 902 0.797±0.167 0.899±0.146 0.808±0.148
20-29 865 1.001±0.115 1.025±0.122 0.916±0.167
30-39 1,351 0.991±0.118 0.993±0.116 0.854±0.118 40-49 1,405 0.975±0.126 0.988±0.118 0.823±0.115
50-59 1,221 0.955±0.141 0.976±0.117 0.791±0.113
60-69 1,174 0.943±0.155 0.926±0.122 0.745±0.112
70-79 773 0.914±0.174 0.862±0.123 0.683±0.110 80-89 146 0.887±0.164 0.797±0.138 0.630±0.121
Female
10-89 9,368 0.893±0.159 0.840±0.131 0.699±0.129
50-89 3,849 0.791±0.139 0.764±0.119 0.613±0.108 10-19 821 0.845±0.146 0.847±0.121 0.738±0.121
20-29 1,086 0.962±0.107 0.890±0.104 0.775±0.104
30-39 1,794 0.995±0.115 0.896±0.106 0.760±0.103
40-49 1,818 0.989±0.122 0.913±0.109 0.759±0.103 50-59 1,267 0.858±0.131 0.838±0.104 0.684±0.098
60-69 1,369 0.787±0.123 0.769±0.098 0.615±0.087
70-79 988 0.733±0.132 0.696±0.101 0.548±0.087 80-89 225 0.691±0.122 0.625±0.096 0.489±0.081
Values are expressed as mean±SD.
and the mean BMD began to rapidly decrease after an age bracket of 50 years or over.
In the comparison of the maximal BMD among the sites, the mean BMD in men was shown to be 1.025, 1.001, and 0.916 g/cm2
for the total hip, lumbar spine, and femoral neck, respec-tively (Fig. 1A). Meanwhile, the mean BMD in women was shown to be 0.995, 0.913, and 0.775 g/cm2
for the lumbar spine, total hip, and femoral neck, respectively (Fig. 1B). Thus, the maximal BMD was higher in the men than in the women for all three sites, and in particular, the most significant difference in the maximal BMD found between the men and women was for the femoral neck. In the comparison of the mean BMD among the age groups according to site after the maximal BMD reached the peak, the mean BMD was highest in the lumbar spine, then the total hip, and then the femoral neck in the women. Meanwhile, the mean BMD was similar between the total hip and lumbar spine in the men aged less than 60, but the
mean BMD for the total hip rapidly decreased in the men in their 60s or higher, which showed an order of the lumbar spine, total hip, and femoral neck.
Analysis of the difference in the prevalence of osteoporosis according to gender
Based on the lowest T-score among the three sites, a cross-tab-Fig. 1. Bone mineral density (BMD) change in the men and wom-en. (A) The graph illustrates the mean BMD change in mwom-en. In all measurement sites, it reached a peak BMD at their 20s. From that time onward, mean BMD decreased steadily. (B) In women, the maximal BMD in the femoral neck, lumbar spine, and the total hip was noted in their 20s, 30s, and 40s, respectively. It appeared to level off until the peak BMD in their 40s, and decreased signifi-cantly after their 50s.
1.10 1.00 0.90 0.80 0.70 0.60 0.50
10-19 20-29 30-39 40-49 50-59 60-69 70-79 80-89
Age (yr)
BMD (mg/cm
2)
Lumbar spine 1-4
Femoral neck Total hip 0.899 0.808 0.797 0.916 0.854 0.823 0.791 0.745 0.683 0.630 1.001 0.991 0.975 0.955 0.926 0.862 0.797 1.025 0.993 0.988 0.967 0.943 0.914 0.887 A BMD change in male
1.10 1.00 0.90 0.80 0.70 0.60 0.50 0.40
10-19 20-29 30-39 40-49 50-59 60-69 70-79 80-89
Age (yr)
BMD (mg/cm
2)
Lumbar spine 1-4
Femoral neck Total hip 0.847 0.962 0.995 0.989 0.858 0.787 0.733 0.691 0.845
0.890 0.896 0.913
0.838
0769
0.696
0.625 0.738
0.775 0.760 0.759
0.684
0.615
0.548
0.489
Table 4. Prevalence of Osteopenia and Osteoporosis by Skeletal Sites
Male Female
Normal Osteopenia Osteoporosis T-score Normal Osteopenia Osteoporosis T-score
Any site, age, yr
50-89 1,413 (42.6) 1,611 (48.6) 290 (8.8) -1.177±1.020 471 (12.2) 1,874 (48.7) 1,504 (39.1) -2.192±1.039
Korean populationa, % 45.2 47.0 7.8 14.3 48.7 37.0
50-59 660 (54.1) 512 (41.9) 49 (4.0) -0.878±0.962 340 (26.8) 735 (58.0) 192 (15.2) -1.557±0.956
60-69 528 (45.0) 561 (47.8) 85 (7.2) -1.128±0.977 105 (7.7) 764 (55.8) 500 (36.5) -2.198±0.869 70-79 197 (25.5) 459 (59.4) 117 (15.1) -1.576±0.981 25 (2.5) 344 (34.8) 619 (62.7) -2.759±0.872
80-89 28 (19.2) 79 (54.1) 39 (26.7) -1.947±0.964 1 (0.4) 31 (13.8) 193 (85.8) -3.236±0.780
Lumbar spine 1-4
50-89 1,886 (56.9) 1,201 (36.2) 227 (6.8) -0.713±1.303 853 (22.2) 1,794 (46.6) 1,202 (31.2) -1.872±1.206 Korean populationa
, % 58.1 35.7 6.2 24.0 46.6 29.4
50-59 759 (62.2) 414 (33.9) 48 (3.9) -0.573±1.177 469 (37.0) 631 (49.8) 167 (13.2) -1.291±1.136
60-69 689 (58.7) 411 (35.0) 74 (6.3) -0.673±1.291 261 (19.1) 696 (50.8) 412 (30.1) -1.905±1.072
70-79 375 (48.5) 317 (41.0) 81 (10.5) -0.915±1.450 110 (11.1) 391 (39.6) 487 (49.3) -2.375±1.145 80-89 63 (43.2) 59 (40.4) 24 (16.4) -1.145±1.369 13 (5.8) 76 (33.8) 136 (60.4) -2.739±1.062
Total hip
50-89 2,742 (82.7) 541 (16.3) 31 (0.9) -0.143±0.950 2,294 (59.6) 1,366 (35.5) 189 (4.9) -0.753±1.038
Korean populationa, % 84.9 14.4 0.8 61.8 33.1 5.1
50-59 1,134 (92.9) 87 (7.1) 0 (0.0) 0.194±0.852 1,074 (84.8) 187 (14.8) 6 (0.5) -0.111±0.901
60-69 1,000 (85.2) 171 (14.6) 3 (0.3) -0.100±0.894 854 (62.4) 493 (36.0) 22 (1.6) -0.717±0.852
70-79 535 (69.2) 222 (28.7) 16 (2.1) -0.570±0.896 341 (34.5) 545 (55.2) 102 (10.3) -1.351±0.880
80-89 73 (50.0) 61 (41.8) 12 (8.2) -1.042±1.006 25 (11.1) 141 (62.7) 59 (26.2) -1.966±0.831 Femoral neck
50-89 1,843 (55.6) 1,345 (40.6) 126 (3.8) -0.837±0.982 804 (20.9) 2,151 (55.9) 894 (23.2) -1.774±1.012
Korean populationa, % 59.2 37.6 3.1 23.8 53.8 22.4
50-59 882 (72.2) 335 (27.4) 4 (0.3) -0.446±0.908 537 (42.4) 663 (52.3) 67 (5.3) -1.117±0.911 60-69 667 (56.8) 476 (40.5) 31 (2.6) -0.817±0.902 218 (15.9) 921 (67.3) 230 (16.8) -1.755±0.809
70-79 258 (33.4) 454 (58.7) 61 (7.9) -1.312±0.891 46 (4.7) 513 (51.9) 429 (43.4) -2.381±0.812
80-89 36 (24.7) 80 (54.8) 30 (20.5) -1.744±0.974 3 (1.3) 54 (24.0) 168 (74.7) -2.933±0.761
Values are expressed as number (%) or mean±SD.
aStandardized prevalence per 100 persons adjusted for the distribution of Korean population, 2010 [22].
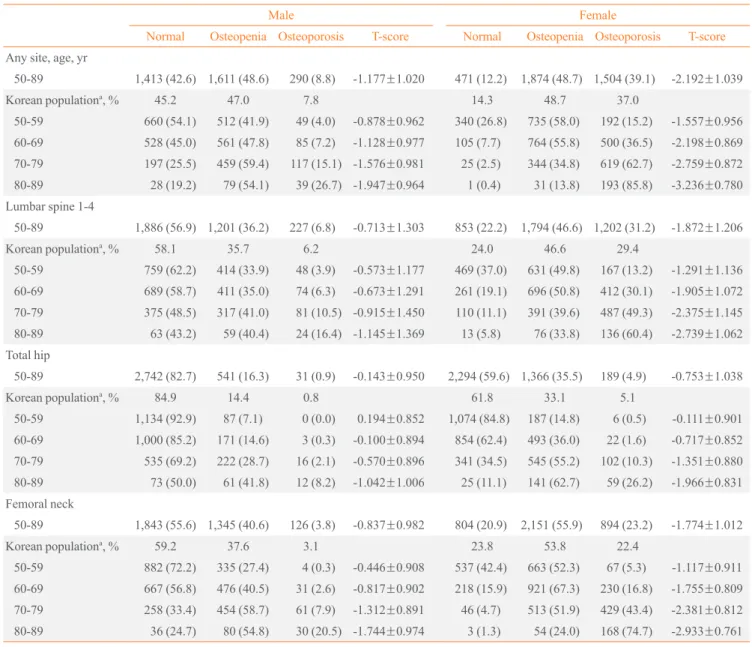
ulation was conducted on the result of the diagnosis of osteo-porosis (normal, osteopenia, osteoosteo-porosis) according to gender (any site rows in Table 4). The prevalence of osteopenia was shown to be 48.6% in the men and 48.7% in the women, which were almost identical. Meanwhile, the prevalence of osteopo-rosis was shown to be 8.8% in the men and 39.1% in the wom-en, an approximately 4.4-fold higher prevalence in the women than in the men. A chi-square test was conducted to see if the prevalence of osteoporosis differed according to gender. The result showed that the prevalence of osteoporosis differed sig-nificantly according to gender (P<0.001).
Prevalence of osteoporosis and osteopenia: analysis according to gender, age, and skeletal site
and 37.0% in the women, which was approximately 5-fold higher in the women than in the men. The adjusted prevalence of osteoporosis in men versus women was 6.2% vs. 29.4% in the lumbar spine, 0.8% vs. 5.1% in the total hip, and 3.1% vs. 22.4% in the femoral neck. In the comparison of the prevalence of osteoporosis among the sites, the prevalence of osteoporosis in the lumbar spine was the highest in both men and women, then in the femoral neck, and then in the total hip.
In the subjects aged 50 years or higher (50 to 89 years), the adjusted prevalence of osteopenia was higher in the women than in the men for all three sites although the difference was not so pronounced as in osteoporosis. In the case where osteo-penia was diagnosed based on the lowest T-score among the three sites, the prevalence of osteopenia was 47.0% in the men, which was similar to 48.7% in the women. The adjusted prev-alence of osteopenia in men versus women was 35.7% versus 46.6% in the lumbar spine, 14.4% vs. 33.1% in the total hip, and 37.6% vs. 55.8% in the femoral neck. In the comparison of the prevalence of osteopenia among the sites, the preva-lence of osteopenia in the femoral neck was the highest in both men and women, then in the lumbar spine, and then in the to-tal hip.
When osteoporosis was diagnosed based on the lowest T-score according to age group, the prevalence of osteoporosis in the men was 4.0% in their 50s, 7.2% in their 60s, 15.1% in their 70s, and 26.7% in their 80s, whereas the prevalence of osteoporosis in the women was 15.2% in their 50s, 36.5% in their 60s, 62.7% in their 70s, and 85.8% in their 80s. The
pre-valence of osteoporosis exceeded 60% in the women in their 70s, and it was 1.4-fold higher in the women in their 80s, which showed that eight to nine of 10 women in their 80s were teoporosis patients. In the comparison of the prevalence of os-teoporosis between genders in the same age groups, the preva-lence of osteoporosis was approximately 4-fold higher in the women than in the men: 5-fold higher in their 60s and 3-fold higher in their 80s.
When the prevalence of osteoporosis was analyzed accord-ing to site, more diverse results were obtained. As for the lum-bar spine, the prevalence of osteoporosis in the men was 3.9% in their 50s, 6.3% in their 60s, 10.5% in their 70s, and 16.4% in their 80s, whereas the prevalence of osteoporosis in the wo-men was 13.2% in their 50s, 30.1% in their 60s, 49.3% in their 70s, and 60.4% in their 80s. Thus, more than half of the wom-en in their 70s had osteoporosis in the lumbar spine. The prev-alence of osteoporosis in the total hip was the lowest among the three sites in both men and women, and in particular, was less than 2% in the men and women in their 50s and 60s. How-ever, the prevalence of osteoporosis in the total hip increased readily in the men and women in their 70s and 80s, with a pre-valence of 8.2% in the men in their 80s and 26.2% in the wom-en in their 80s. The prevalwom-ence of osteoporosis in the femoral neck was 0.3% and 5.3% in the men and women in their 50s, respectively, which was lower than that in the lumbar spine. However, the prevalence of osteoporosis in the femoral neck increased the most rapidly in the men and women in their 60s to 80s. As a result, the prevalence of osteoporosis in the
femo-Fig. 2. Cumulative prevalence (%) of osteoporosis in men and women. In all age groups and sexes, lumbar spine osteoporosis occurred ear-liest and was the most frequent site of osteoporosis. (A) The graph shows the prevalence in men. Femoral neck osteoporosis was detected for the first time at the age of 60. (B) In women, Femoral neck osteoporosis started at an age of 55.
10.0 9.0 8.0 7.0 6.0 5.0 4.0 3.0 2.0 1.0 0.0
50 55 60 65 70 75 80 85 90
Age (yr)
Cumulative % of osteoporosis suf
fers
At least one site
Lumber spine 1-4
Femoral neck
Total hip
A Cumulative prevalence (%) of osteoporosis in male
45.0 40.0 35.0 30.0 25.0 20.0 15.0 10.0 5.0 0.0
50 55 60 65 70 75 80 85 90
Age (yr)
Cumulative % of osteoporosis suf
fers
At least one site
Lumber spine 1-4
Total hip Femoral neck
ral neck was 20.5% in the men in their 80s and 74.4% in the women in their 80s, which were higher than in the other two sites in the same age group.
To investigate changes in the prevalence of osteoporosis among the sites according to age, the cumulative prevalence of osteoporosis (the summation of the prevalence of osteopo-rosis from an age of 50 years to the particular age at an age in-terval of 1 year) was analyzed for the men and women (Fig. 2). In both men and women, the prevalence of osteoporosis in the lumbar spine increased starting from early 50s, and accounted for the highest proportion among all of the age groups in terms of the cumulative prevalence of osteoporosis. Unlike the lum-bar spine, an increase in the prevalence of osteoporosis in the femoral neck significantly differed according to age. The prev-alence of osteoporosis in the femoral neck increased starting from the 60s age group in the men, whereas it began to occur in the women in their mid 50s, and rapidly increased in the women in their mid 60s. The prevalence of osteoporosis in the total hip began to increase in both men and women in their 70s, but its proportion was significantly lower compared to the other two sites.
DISCUSSION
The results of this study are summarized as follows: 1) when osteoporosis was diagnosed based on the lowest T-score among the lumbar spine, total hip, and femoral neck, the prevalence of osteoporosis was 8.8% and 39.1% in the men and women aged 50 years or higher (50 to 89 years), respectively. When the prevalence of osteoporosis was adjusted considering the population distribution of the 2010 population census and then analyzed, it was 7.8% in the men, but 37% in the women, which was approximately 5-fold higher in the women than in the men. On the other hand, the adjusted prevalence of osteopenia was 47.0% in the men, and 48.7% in the women, which showed no significant difference according to gender; 2) in the compari-son of the prevalence of osteoporosis among 10-year age groups from their 50s to 80s, the prevalence of osteoporosis was 4.0% in their 50s, 7.2% in their 60s, 15.1% in their 70s, and 26.7% in their 80s in the men, and 15.2% in their 50s, 36.5% in their 60s, 62.7% in their 70s, and 85.8% in their 80s in the women. Thus, the prevalence of osteoporosis increased by approximat-ely 2-fold as the age of the subjects increased by 10 years in both men and women, and the prevalence of osteoporosis was approximately 4-fold higher in the women than in the men with-in the same age groups; 3) the maximal BMD was observed with-in
the men in their 20s for all three sites. Meanwhile, the maxi-mal BMD was observed in the women in their 20s for the fe-moral neck, 30s for the lumbar spine, and 40s for the total hip; and 4) the prevalence of osteoporosis in the lumbar spine be-gan to increase in both men and women in their 50s, and ac-counted for the highest proportion among the sites in terms of the cumulative prevalence of osteoporosis. Meanwhile, the prevalence of osteoporosis in the femoral neck began to in-crease in the men in their 60s, whereas it began to inin-crease in the women in their mid-50s, and increased rapidly in the wom-en in their mid-60s.
Table 5. Prevalence of Osteoporosis according to the Reference Value
Reference
Male Female
Lumbar
spine 1-4 Total hip
Femoral neck
Lumbar
spine 1-4 Total hip
Femoral neck
Manufacturer-provided Korean Referencea 6.8 0.9 3.8 31.2 4.9 23.2
Korean reference from a local community cohort (Namwon)b
4.0 7.3 34.7 20.2
NHANES III non-Hispanic white referencec 1.8 5.5 14.1 30.6
Chinese reference from a multiregional studyd 6.4 1.8 7.5 18.4 1.7 14.9
Japanese reference from a multiregional studye
42.2 11.7 23.4
Values are expressed as percentage.
aHologic (Hologic Discovery, Bedford, MA, USA); bReference from single community study (Namwon) [8]; cNon-Hispanic white reference from NHANES III of United States of America [17]; dChinese reference for men [18] and for women [19]; eJapanese reference for women [20].
lower in the lumbar spine than in the other two sites in both men and women in their 50s. However, the change in the in-creased prevalence of osteoporosis was higher in the femoral neck than in the lumbar spine in both men and women as the age of the subjects increased. Thus, the prevalence of osteopo-rosis was the highest in the subjects in their 80s. The mean T-score of the femoral neck was the lowest in the subjects in their 80s. This result indicates that the prevalence of osteopo-rosis in the femoral neck rapidly increases as age increases. In particular, in the subjects in their 60s, the prevalence of osteo-porosis in the femoral neck was 16.8% in the women, which was 7-fold higher than the 2.6% in the men. This difference in the subjects in their 60s was high compared to a 4-fold differ-ence in their 70s and a 3-fold different in their 80s. This is at-tributable to the fact that the BMD of the femoral neck rapidly decreases in menopausal women in their 50s (Fig. 1B). The difference in the prevalence of osteoporosis in the femoral neck between the men and women is better illustrated in Fig. 2. In the women, the prevalence of osteoporosis in the femoral neck began to increase in their 50s, and rapidly increased after an age of 65 years (Fig. 2B). Meanwhile, in the men, the preva-lence of osteoporosis in the femoral neck began to increase in their 60s, and steadily increased over time (Fig. 2A). This dif-ference in the prevalence of osteoporosis between genders is explained by the difference in estrogen reduction according to gender [25].
As most previous studies on the prevalence of osteoporosis were conducted on subjects in particular regions, a resulting nation-wide study was not obtained. The prevalence of osteo-porosis was adjusted considering the difference in the refer-ence value or device used to measure BMD in order to com-pare with that of previous studies (Table 5). In the comparison
of the prevalence of osteoporosis between this nation-wide study and two other previous region-based studies [8,9], a sig-nificant difference was found. In a study that was conducted on the men in Namwon, the prevalence of osteoporosis was 6.5% in the lumbar spine and 5.9% in the femoral neck. In a study that was conducted on subjects in Ansung, the preva-lence of osteoporosis was 7.3% in the lumbar spine and 6.0% in the femoral neck when the reference value used in the Nam-won study was used. A Lunar device was used in these two studies. Thus, in comparison with the prevalence of osteopo-rosis that was adjusted according to device and reference value (4.0% vs. 7.3%), the prevalence of osteoporosis was higher in the lumbar spine and lower in the femoral neck. Meanwhile, in the study that was conducted on the women living in Nam-won, the prevalence of osteoporosis was 40.1% in the lumbar spine and 12.4% in the femoral neck. In the study that was conducted on subjects living in Ansung, the prevalence of os-teoporosis was 42.1% in the lumbar spine and 13.0% in the femoral neck when the reference value used in the Namwon study was used. Thus, in comparison with the adjusted preva-lence of osteoporosis of this study (34.7% vs. 20.2%), the pre-valence of osteoporosis was higher in the lumbar spine and lower in the femoral neck.
by diagnosed site of osteoporosis (lumbar spine, total hip, fe-moral neck) according to age in detail. Furthermore, osteope-nia was poorly studied, and the standardized prevalence of os-teoporosis considering the actual population distribution was not presented in that study. In this study, the topics that were not touched upon in the previous study were analyzed and re-sulted in a change in the prevalence of osteoporosis and osteo-penia by diagnosed site of osteoporosis (lumbar spine, total hip, femoral neck) according to gender and age. When the pre-valence of osteoporosis was compared between Korea and oth-er countries based on the results of this study, the domestic pre-valence of osteoporosis was higher than that of United States in both men and women. In the United States study, the preva-lence of osteoporosis in the lumbar spine and femoral neck was 2.5% and 2.1%, respectively, in the men, and 10.8% and 8.9%, respectively, in the women [24]. When the domestic prevalence of osteoporosis (male, 5.5%; female, 30.6%) was adjusted using the reference value of non-Hispanic white women reported in the NHA NES III, and then compared, the prevalence of osteoporosis in the men and women was 2- and 3-fold higher, respectively, in Korea than in United States (2.1% vs. 5.5% in men; 8.9% vs. 30.6% in women). In the case of Chinese men, the prevalence of osteoporosis was 5.4%, 3.8%, and 6.3% in the lumbar spine, total hip, and fem-oral neck, respectively [18]. In the comparison between Korea (6.4%, 1.8%, and 7.5%) and China after adjusting the refer-ence value, the prevalrefer-ence of osteoporosis in two of the three sites was higher in Korean men than in Chinese men (exclud-ing the total hip). Meanwhile, the prevalence of osteoporosis was 28% in Chinese women [19], which was lower than the domestic prevalence of 31.2% before adjustment and higher than the domestic prevalence of 18.4% after adjustment. In the case of Japanese women, the prevalence of osteoporosis in the lumbar spine, total hip, and femoral neck was 38%, 15.3%, and 11.6%, respectively [20]. When the pre valence of osteopo-rosis in Japanese women was compared with the domestic prevalence (42.2%, 11.7%, and 23.4%) after adjustment, the prevalence of osteoporosis in two sites (excluding the total hip) was higher in the Korean women than in the Japanese women.
This study has a few limitations. First, although it may be suitable to investigate the prevalence of osteoporosis as a cross-sectional study at a specific period of time, it is limited in in-vestigating changes in BMD or prevalence of osteoporosis ac-cording to age. Second, this study is meaningful in that the analysis was conducted based on the data of the nation-wide
KNHANES. However, a region-based analysis was not con-ducted in this study making it is difficult to directly compare the results of this study with those of previous region-based studies. Accordingly, the adjusted prevalence of osteoporosis based on the reference value used in the previous region-based studies was presented in this study. Third, a Hologic device was used to measure BMD in the KNHANES. Thus, the re-sults of this study may differ from those of studies using a Lu-nar device. Although the prevalence of osteoporosis was ad-justed using the equation of BMD conversion between devices to overcome this problem, the equation is limited in that it was applied between devices of specific models. Fourth, in this study, the normal reference value for calculating the T-score, which was provided by the manufacturer of the BMD-measur-ing device, was used. As the selection of the reference value affects the calculation of the prevalence of osteoporosis, the prevalence of osteoporosis in the non-Hispanic white women reported in the United States NHANES III has been recently recommend ed as the reference value [16,26-28]. Unfortunate-ly, no definite guideline on the reference value for the diagno-sis of osteoporodiagno-sis has been established in Korea, which will require the consideration of medical and socioeconomic influ-ences [29]. Finally, in this study, the relationship between the site-related prevalence of osteoporosis considering subjects who show ed variation in BMD status according to site and the total prevalence of osteoporosis was not analyzed. Thus, a fur-ther study is required to investigate inconsistencies among the diagnostic sites.
CONFLICTS OF INTEREST
No potential conflict of interest relevant to this article was re-ported.
ACKNOWLEDGMENTS
This research was supported by the Hallym University Resear-ch Fund, 2013 (HRF-201303-011).
REFERENCES
1. Keene GS, Parker MJ, Pryor GA. Mortality and morbidity after hip fractures. BMJ 1993;307:1248-50.
423-7.
3. American College of Rheumatology. Osteoporosis [Inter-net]. Atlanta: American College of Rheumatology; c2013 [cited 2013 Feb 22]. Available from: http://www.rheuma-tology.org/public/factsheets/osteopor_new.asp.
4. Jang S, Park C, Jang S, Yoon HK, Shin CS, Kim DY, Ha YC, Lee SS, Choi HJ, Lee YK, Kim BT, Choi JY. Medical service utilization with osteoporosis. Endocrinol Metab 2010;25:326-39.
5. Jang SN, Choi YH, Choi MG, Kang SH, Jeong JY, Choi YJ, Kim DH. Prevalence and associated factors of osteo-porosis among postmenopausal women in Chuncheon: Hal-lym Aging Study (HAS). J Prev Med Public Health 2006; 39:389-96.
6. Choi JY, Han SH, Shin AS, Shin CS, Park SK, Cho SI, Kang DH. Prevalence and risk factors of osteoporosis and osteo-penia in Korean women: cross-sectional study. J Korean Soc Menopause 2008;14:35-49.
7. Jeon GH, Kim SR, Kim SH, Chae HD, Kim CH, Kang BM. Prevalence of osteoporosis and osteopenia in women in Kangwon province: geographical comparison study. J Bone Metab 2008;15:135-42.
8. Cui LH, Choi JS, Shin MH, Kweon SS, Park KS, Lee YH, Nam HS, Jeong SK, Im JS. Prevalence of osteoporosis and reference data for lumbar spine and hip bone mineral den-sity in a Korean population. J Bone Miner Metab 2008;26: 609-17.
9. Shin CS, Choi HJ, Kim MJ, Kim JT, Yu SH, Koo BK, Cho HY, Cho SW, Kim SW, Park YJ, Jang HC, Kim SY, Cho NH. Prevalence and risk factors of osteoporosis in Korea: a community-based cohort study with lumbar spine and hip bone mineral density. Bone 2010;47:378-87.
10. Korea Health Insurance Review & Assessment Service. A dramatic increase of elderly osteoporotic patients [Inter-net]. Seoul: Korea Health Insurance Review & Assessment Service; 2013 [updated 2013 Jan 31; cited 2013 Feb 22]. Available from: http://www.hira.or.kr/dummy.do?pgmid= HIRAA020041000000&cmsurl=/cms/notice/02/1316013_ 13390.html&subject.
11. Korea Institute for Health and Social Affairs. Determinants and macroefficiency of the National Health Expenditure [Internet]. Seoul: Korea Institute for Health and Social Af-fairs;2003 [cited 2013 Feb 22]. Available from: http://www. kihasa.re.kr/html/jsp/publication/research/.
12. Choi YJ, Oh HJ, Kim DJ, Lee Y, Chung YS. The preva-lence of osteoporosis in Korean adults aged 50 years or
older and the higher diagnosis rates in women who were beneficiaries of a national screening program: the Korea National Health and Nutrition Examination Survey 2008-2009. J Bone Miner Res 2012;27:1879-86.
13. Korea Centers for Disease Control and Prevention. The Fourth Korea National Health and Nutrition Examination Survey (KNHANES IV), 2008-2009 [Internet]. Cheong-won: Korea Centers for Disease Control and Prevention; 2009 [updated 2012 Aug 30; cited 2013 Feb 21]. Available from: http://knhanes.cdc.go.kr/knhanes/index.do.
14. Korea Centers for Disease Control and Prevention. The Fifth Korea National Health and Nutrition Examination Survey (KNHANES V), 2010 [Internet]. Cheongwon: Ko-rea Centers for Disease Control and Prevention; 2009 [up-dated 2012 Aug 30; cited 2013 Feb 21]. Available from: http://knhanes.cdc.go.kr/knhanes/index.do.
15. Kanis JA; World Health Organization Centre for Metabolic Bone Diseases. Assessment of osteoporosis at the primary health care level. Sheffield: WHO Collaborating Centre for Metabolic Bone Diseases, University of Sheffield Medical School; 2008. p. 13-70.
16. The International Society for Clinical Densitometry. Offi-cial positions of the International Society for Clinical Den-sitometry. West Hartford: The International Society for Cli-nical Densitometry; 2007. p. 4-6.
17. Looker AC, Wahner HW, Dunn WL, Calvo MS, Harris TB, Heyse SP, Johnston CC Jr, Lindsay R. Updated data on pro-ximal femur bone mineral levels of US adults. Osteoporos Int 1998;8:468-89.
18. Zhang ZL, Qin YJ, Huang QR, Hu YQ, Li M, He JW, Zhang H, Liu YJ, Hu WW. Bone mineral density of the spine and femur in healthy Chinese men. Asian J Androl 2006;8:419-27.
19. Cheng XG, Yang DZ, Zhou Q, Zhuo TJ, Zhang HC, Xiang J, Wang HF, Ou PZ, Liu JL, Xu L, Huang GY, Huang QR, Barden HS, Weynand LS, Faulkner KG, Meng XW. Age-related bone mineral density, bone loss rate, prevalence of osteoporosis, and reference database of women at multiple centers in China. J Clin Densitom 2007;10:276-84.
20. Iki M, Kagamimori S, Kagawa Y, Matsuzaki T, Yoneshima H, Marumo F. Bone mineral density of the spine, hip and distal forearm in representative samples of the Japanese female population: Japanese Population-Based Osteoporo-sis (JPOS) Study. Osteoporos Int 2001;12:529-37.
tri-angle. Osteoporos Int 2001;12:438-44.
22. Statistics Korea. Population by age and sex in 2010 [Inter-net]. Daejeon: Statistics Korea; c2010 [cited 2013 Feb 22]. Available from: http://kosis.kr/abroad/abroad_01List.jsp. 23. Yoshimura N, Muraki S, Oka H, Mabuchi A, En-Yo Y,
Yo-shida M, Saika A, YoYo-shida H, Suzuki T, Yamamoto S, Ishi-bashi H, Kawaguchi H, Nakamura K, Akune T. Prevalence of knee osteoarthritis, lumbar spondylosis, and osteoporo-sis in Japanese men and women: the research on osteoar-thritis/osteoporosis against disability study. J Bone Miner Metab 2009;27:620-8.
24. Looker AC, Melton LJ 3rd, Borrud LG, Shepherd JA. Lum-bar spine bone mineral density in US adults: demographic patterns and relationship with femur neck skeletal status. Osteoporos Int 2012;23:1351-60.
25. Pietschmann P, Rauner M, Sipos W, Kerschan-Schindl K. Osteoporosis: an age-related and gender-specific disease: a mini-review. Gerontology 2009;55:3-12.
26. National Osteoporosis Foundation. Clinician’s guide to
pre-vention and treatment of osteoporosis. Washington, DC: National Osteoporosis Foundation; 2013.
27. Kanis JA, McCloskey EV, Johansson H, Cooper C, Rizzoli R, Reginster JY; Scientific Advisory Board of the Europe-an Society for Clinical Europe-and Economic Aspects of Osteopo-rosis and Osteoarthritis (ESCEO) and the Committee of Scientific Advisors of the International Osteoporosis Foun-dation (IOF). European guidance for the diagnosis and ma-na gement of osteoporosis in postmenopausal women. Os-teoporos Int 2013;24:23-57.
28. Papaioannou A, Morin S, Cheung AM, Atkinson S, Brown JP, Feldman S, Hanley DA, Hodsman A, Jamal SA, Kaiser SM, Kvern B, Siminoski K, Leslie WD; Scientific Adviso-ry Council of Osteoporosis Canada. 2010 clinical practice guidelines for the diagnosis and management of osteopo-rosis in Canada: summary. CMAJ 2010;182:1864-73. 29. The Korean Society of Bone Metabolism. Physician’s guide