On the collocation between dayside auroral activity
and coherent HF radar backscatter
J. Moen1,4, H. C. Carlson2, S. E. Milan3, N. Shumilov1, B. Lybekk4, P. E. Sandholt4, M. Lester3 1Arctic Geophysics, University Courses on Svalbard, N-9170Longyearbyen, Norway
2
Air Force Research Laboratory, AFOSR, 801 Staord St., Arlington, VA 22203, USA
3
Department of Physics and Astronomy, University of Leicester, Leicester LE1 7RH, UK
4Department of Physics, University of Oslo, PO Box. 1048 Blindern, N-0316 Oslo, Norway
Received: 20 December 1999 / Revised: 29 September 2000 / Accepted: 6 October 2000
Abstract. The 2D morphology of coherent HF radar and optical cusp aurora has been studied for conditions of predominantly southward IMF conditions, which favours low-latitude boundary layer reconnection. De-spite the variability in shape of radar cusp Doppler spectra, the spectral width criterion of ³220m s)1 proves to be a robust cusp discriminator. For extended periods of well-developed radar backscatter echoes, the equatorward boundary of the³220m s)1spectral width enhancement lines up remarkably well with the equa-torward boundary of the optical cusp aurora. The spectral width boundary is however poorly determined during development and fading of radar cusp backscat-ter. Closer inspection of radar Doppler pro®le charac-teristics suggests that a combination of spectral width and shape may advance boundary layer identi®cation by HF radar. For the two December days studied the onset of radar cusp backscatter occurred within pre-existing 630.0 nm cusp auroral activity and appear to be initiated by sunrise, i.e. favourable radio wave propa-gation conditions had to develop. Better methods are put forward for analysing optical data, and for physical interpretation of HF radar data, and for combining these data, as applied to detection, tracking, and better understanding of dayside aurora. The broader motiva-tion of this work is to develop wider use by the scienti®c community, of results of these techniques, to accelerate understanding of dynamic high-latitude boundary-pro-cesses. The contributions in this work are: (1) improved techniques of analysis of observational data, yielding meaningfully enhanced accuracy for deduced cusp locations; (2) a correspondingly more pronounced validation of correlation of boundary locations derived from the observational data set; and (3) a ®rmer physical rationale as to why the good correlation observed should theoretically be expected.
Key words: Ionosphere (ionospheric irregularities; polar ionosphere)
1 Introduction
All-sky cameras and SuperDARN HF radars with large ®elds-of-view, constitute powerful tools to study tempo-ral and spatial behaviour of large-scale aurotempo-ral and polar cap dynamics, and both techniques have proven potential for identi®cation of magnetospheric boundary layers. Baker et al. (1990, 1995) combined PACE HF radar observations with DMSP particle data, and identi®ed broad multi-component Doppler spectra to be a feature characteristic of coherent HF radar cusp backscatter. In contrast the low-latitude boundary layer (LLBL) was found to be associated with narrow single component spectra. The occurrence distribution of spectral widths peaked at 220m s)1 in the cusp and 60m s)1 in the LLBL. Andre et al. (1999) have pub-lished an important contribution to the understanding of the process whereby HF radar echoes from irregularities become Doppler spread, by Pc1 and Pc2 events.
Several attempts have been made to compare HF radar and optical cusp observations. Rodger et al.
(1995) employed wide spectral widths as a radar cusp identi®er. For the situation when IMF BZ was docu-mented as negative, they found the equatorward bound-ary of the HF cusp signature to be located 0.5° on average equatorward of the optical cusp. For the other case of unknown IMF conditions, the radar cusp boundary was either embedded within or located near the poleward edge of the auroral luminosity. Yeoman
et al.(1997) demonstrated a near collocation of strong HF backscatter power, poleward moving auroral forms, and energy dispersed ions for a DMSP snapshot through the winter cusp above Svalbard. Milan et al.
(1999) demonstrated a good correlation between CUTLASS HF backscatter and dayside 630.0 nm aurora along the meridian swept by the scanning Correspondence to:J. Moen
Department of Physics, University of Oslo, PO Box 1048, Blindern N-0316 Oslo Norway
photometer at Ny-AÊlesund, Svalbard. They found a rather good collocation of the equatorward radar (de®ned by power) and optical cusp auroral boundaries, and that these boundaries showed the same motion.
The motivation for this work is to follow up on Rodgeret al.(1995) and Baker et al.(1995) to validate the use of enhanced radar Doppler spectral widths as a cusp identi®er around magnetic noon for one speci®c category of cusp aurora. The work is limited to type 1 cusp auroral activity. According to the classi®cation by Sandholt et al. (1998), type 1 cusp aurora occur under predominantly southward IMF conditions, located typ-ically south of ~74° MLAT, includes quasi-periodic sequences of poleward moving auroral forms (PMAFs), and is dominated by the 630.0 nm emission which indicates soft magnetosheath electron precipitation. The pattern of east±west movements of type 1 cusp activity is IMF BY controlled (e.g. Sandholt et al., 1993; Moen et al., 1999). Moenet al.(1996) attributed the equator-ward boundary of the type 1 aurora to an open LLBL, located poleward of the electron-trapping boundary. Sandholt et al. (1993) attributed the fading phase of a poleward moving type 1 auroral form to approaching the plasma mantle. LLBL, cusp and mantle precipita-tion regimes can be separated from each other based on dierential ion energy ¯uxes (Newell et al., 1988), but are indistinguishable in an electron stimulated auroral display (e.g. Moen et al., 1998). Type 1 cusp aurora is interpreted as LLBL stimulated reconnection and is taken to be the auroral footprint of newly-opened magnetic ¯ux. The transition from narrow single com-ponent to wide complex Doppler spectra of coherent HF backscatter has been proposed as a delineator of the open/closed ®eld line boundary (Baker et al., 1995). Hence, it is reasonable to expect a good correlation between the equatorward boundaries of radar and optical auroras for type 1 cusp activity.
Two December days near the last sunspot minimum, for which simultaneous all-sky, meridian scanning photometer, and CUTLASS Finland radar observations are available above Svalbard, form the experimental basis for this study. The 2D perspective provided by radar and optical cusp morphology provides new detailed insight regarding the relationship between the radar and optical cusp aurora. Iterative examination of the data helps extract this new insight. Our ®rst approach is to use the criterion that the spectral width is greater than or equal to 220m s)1in order to identify those radar gates which lie within the cusp (motivated by Baker et al., 1995; and Rodgeret al., 1995). During intervals of strong backscatter echoes, the equatorward boundary of the radar cusp boundary indeed aligns very nicely with the equatorward boundary of the type 1 cusp. However, the spectral width boundary is poorly determined at the eastern and western edges of the radar cusp. Closer inspection reveals that boundary transi-tions usually stand out by virtue of changing shape and/ or broadening width of the Doppler spectral pro®les, while transition features are spectrally more diverse than the narrow single-peak to broad multi-peak transition reported by Baker et al.(1995).
2D observations of the developing and fading phases of the radar cusp activity then lead one to further examine the underlying working principles of radar cusp observations. Coherent HF radars obtain backscatter echoes from ®eld-aligned plasma irregularities of deca-metre scale length (half the radar operating wavelength). The generation mechanism of backscatter targets has not yet been agreed upon, but the literature has identi®ed candidate processes including: gradient drift instability, shear instability, ``stirring'' or ¯ux tube interchange, and current convective instability which can be viewed as a subset of gradient drift instabilities (e.g. Tsunoda, 1988; Basuet al., 1994). The latter mode includes ®eld-aligned currents as an extra source of free energy in the context of interchange instabilities (Cha-turvedi and Ossakow, 1981). The models have not yet added allowance for spatially structured mobility and conductivity due to structured particle precipitation. Under conditions for which plasma ¯ow has a compo-nent in the direction of a density gradient, gradient drift instability is regarded as the dominant mode for driving the plasma unstable in the F-region auroral ionosphere (e.g. Ossakow and Chaturvedi, 1979; Basuet al., 1994). The typical geometry for gradient drift instabilities in the Northern Hemisphere cusp, is a density gradient towards north, a convection electric ®eld pointing eastward and a background magnetic ®eld pointing down. It is notable that the E´B gradient drift geometry will become stable upon reversing the electric ®eld or the density gradient. Our data set contains an example consistent with the latter.
Section 2 provides a brief description of the dierent instrumental techniques used here. The data, consisting of type 1 cusp observations during two days, are presented in Sect. 3. The ®rst day is December 17, 1995 and the second is December 24, 1995. In Sect. 4 the auroral characteristics are ®rst discussed with respect to their magnetospheric origin and located relative to the polar cap boundary. Then the correlation between the equatorward radar and optical cusp boundaries are studied, and transition features in the Doppler power spectra across cusp activity boundary are examined. Finally, various aspects of radar cusp and formation of backscatter are illuminated. A brief summary and concluding remarks are presented in Sect. 5.
2 Instrumentation
2.1 CUTLASS Finland HF radar
The CUTLASS Finland radar located at Hankasalmi (62.3°N, 26.6°E, 58.62°CGMLAT) has an array of 16 antennas, with both transmitting and receiving capabil-ities. The radar can operate in the HF band between 8 MHz and 20MHz. The antennas in each array are phased relative to one other so as to form an antenna pattern in which maximum gain (beam position) has one of 16 azimuthal pointing directions separated by ap-proximately 3.2°, distributed symmetrically about the
Svalbard is located near the centre of the fan-shaped ®eld-of-view.
CUTLASS is a coherent HF radar which measures backscatter echoes from ®eld-aligned plasma irregular-ities in the high-latitude ionosphere (e.g. Greenwald
et al., 1995). A 7 pulse scheme is transmitted, and analysis of the auto-correlation function (ACF) of the return signals yields backscatter Doppler spectra, from which the spectral characteristics of power, line-of-sight Doppler velocity and spectral width can be derived (e.g. Hanuise et al., 1993; Baker et al., 1995). F-region backscatter echoes serve as a tracer ofE´Bconvection of plasma (Villain et al., 1985; Ruohoniemiet al., 1987; Davies et al., 1999).
The actual radar ®eld-of-view depends strongly on the ionospheric conditions for radio wave propagation. Due to the Earth's curvature, the propagation mode for ionospheric backscatter from above Svalbard must be multi-hop, and is most likely the 1 F mode HF radiowave propagation. The 1 F mode means that the radar signal has been ®rst refracted by the F-region ionosphere to a ground point, then re¯ected forward into a second hop, during which some energy is backscattered from F-region irregularities. Far range backscatter is only possible if the ionospheric refrac-tion condirefrac-tions produce the ®rst hop, followed by forward scatter that reaches a more distant scatterer. Refraction depends on the transmitted frequency and on the ionospheric plasma density distribution (verti-cally and horizontally along the propagation path). This has been discussed in detail by Milan et al.
(1997).
On December 17, 1995, the radar scanned through beams 12 to 5 in descending order, returning to beam 9 between each, with a dwell time of 7 s, producing a ®eld-of-view map of backscatter every 2 min. A total of 75 range gates were sampled for each beam with a pulse length of 100ls, corresponding to the gate length of 15 km. The lag to the ®rst gate is 8700 ls and the range coverage is from 1305 km to 2430 km. On December 24, 1995, the radar scanned through beams 13 to 7 in descending order. Again 75 range gates were sampled for each beam but with a pulse length of 200 ls, corresponding to the gate length of 30km. The lag to the ®rst gate is 5800ls and the range coverage is from 870km to 3120km.
2.2 MSP and ASI
The 630.0 nm aurora were surveyed by a meridian scanning photometer (NYA MSP) operated at Ny-AÊlesund (78.9°N, 11.9°E, 76.07°CGMLAT) and an all-sky imager (ASI) located at Longyearbyen (78.2°N, 15.8°E, 75.12°CGMLAT). The MSP has a 2° ®eld of view and sweeps the magnetic meridian to 10°above the
northern and southern horizons every 18 s. Longyear-byen ASI measured a 630.0 nm image every 45 s. Longyearbyen and Ny-AÊlesund are located at nearly the same magnetic longitude, crossing magnetic local noon at ~0850 UT. To represent a common MSP and
CUTLASS ®eld-of-view, radar gates were selected from beam 7±12 projected along the MSP scan-line.
2.3 NOAA and WIND spacecraft
NOAA-12 and NOAA-14 are low-altitude polar orbit-ing satellites operatorbit-ing at an~820km altitude above the Earth's surface. The satellites carry two complements of particle instruments, the total energy detector (TED) and the medium energy proton and electron detector (MEPED). TED measures electrons and ions between 0.3 and 20 keV, in two viewing directions, one toward zenith and the other 30° to zenith. This instrument has been designed to obtain the energy ¯ux moment, but also provides crude electron and ion energy spectra as well. MEPED consists of solid-state detector telescopes: one pointing toward zenith to view particles that precipitate into the ionosphere, the other at 90° to zenith to view particles that will magnetically mirror above the atmosphere. The energy ranges sensed are for electrons >30 keV, >100 keV, >300 keV, all with a 1000 keV maximum energy, and for ions 30±80 keV, 80±250 keV, 250±800 keV, 800±2500 keV and >2500 keV. Employing the criteria established by Moen et al.
(1996), the integral number ¯ux of precipitating 300± 460eV electrons and 0.3±2.35 keV ions from TED's zenith-look will be used as an indicator of soft magnetosheath-type precipitation. MEPED provides information on energetic magnetospheric particle ¯uxes (>30keV) and helps locate the electron trapping boundary.
The WIND spacecraft is used to monitor solar wind conditions upstream of the bow shock. We will present data from two of the eight instruments carried by WIND: the magnetic ®eld investigation (MFI), and the solar wind experiment (SWE). Detailed descriptions can be found in Lepping et al. (1995) and Ogilvie et al.
(1995), respectively.
3 Observations
3.1 December 17, 1995
Figure 1 displays WIND observations of solar wind conditions for the 07 to 11 UT interval. The panels in this ®gure show from top to bottom: the antisunward velocity and density of the solar wind plasma, and the magnitude and three GSM components of the IMF. WIND was located upstream of the Earth at (59, 32, 0)
RE in XYZ GSM co-ordinates. Milan et al. (1999) estimated a time lag of 16 to 24 min between IMF observations and the ionospheric response for this. The time lag is sensitive to the BX to BY ratio when the spacecraft is located far o the Sun-Earth axis upstream (Lockwoodet al., 1989). When the satellite operates on the duskside upstream as here, a positive (negative)BX
axis. The BX to BY ratio changed sign several times during the 08±10 UT interval of primary interest for this study. Such sign reversals, combined with expectation of a nominal time lag of~20min, notably aid identi®cation of auroral responses to major IMF transitions.
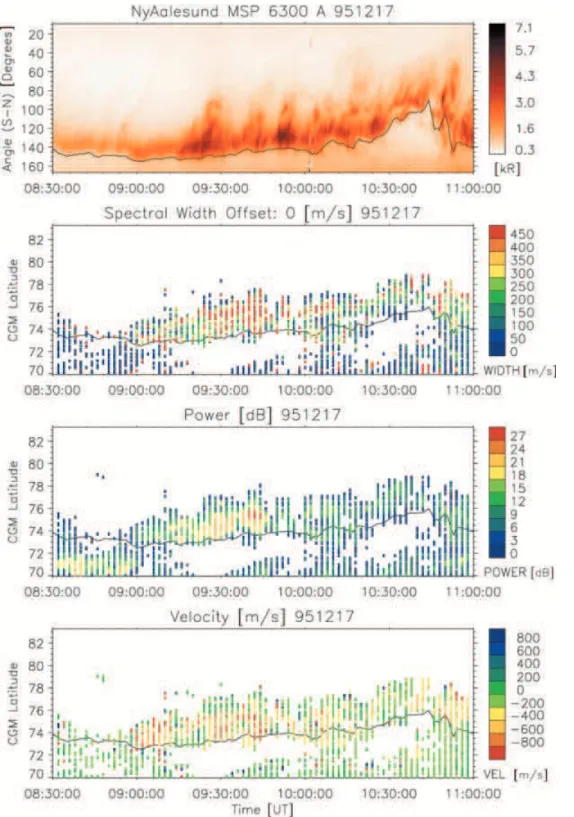
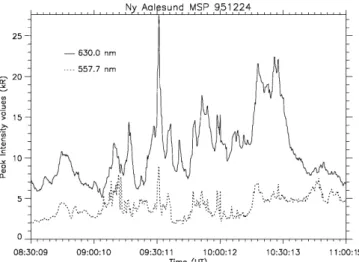
Figure 2 presents Ny-AÊlesund MSP and CUTLASS Finland radar data recorded between 0830 and 1100 UT. The top panel shows 630.0 nm emission intensity versus scan-angle and time, while the three panels below it show spectral width, backscatter power and line-of-sight velocity versus CGMLAT and time. The black contour line marks the equatorward bound-ary of the red line auroral activity. A numerical computer code was developed for automatic tracing of the arc boundary, for objectivity, and meaningful consistency, in addition to convenience. The code de®nition used for the boundary is where the second derivative of the zenith angle variation of emission intensity reaches zero, i.e. where the gradient of emission intensity maximises. This will later be referred to as the maximum gradient method. In order to compare auroral activity with HF radar backscatter echoes, the equator-ward boundary of auroral activity has been converted to CGMLAT and overlayed on the radar parameter plots in Fig. 2. The height of the 630.0 nm border was taken to be 215 km for reasons that will be discussed in Sect. 4.2. The code traced the equatorward boundary per-fectly well up to 1045 UT after which the derived boundary became ragged. To illustrate temporal changes
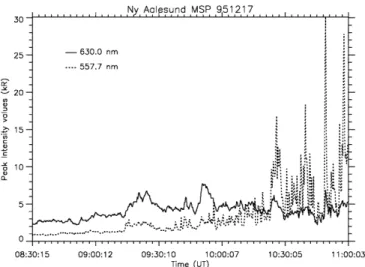
in the (particle energy) spectral content of the auroral activity, peak values of 630.0 nm (solid line) and 557.7 nm (dotted line) observed during each MSP sweep is plotted versus time in Fig. 3. The aurora is red-dominated up to about 1010 UT after which the 557.7 nm intensity curve started ¯uctuating about the 630.0 nm curve, and soon after became substantially larger than the red line. As this work is devoted to HF-backscatter related to red-dominated dayside aurora, attention is drawn to observations before 1010 UT.
From 0830 to 0855 UT in Fig. 2 a relatively faint auroral band is located between 130°to 150°. This quiet aurora is associated with poor backscatter (only a few range gates of weak power). From 0855 to 0900 UT, the auroral boundary migrated southward from 150° to
155°scan-angle corresponding to 73°to 72°CGMLAT,
associated with a signi®cant increase in emission inten-sity. This is a likely response to the IMF BZ stepping
down from)3.5 at 0825 UT to )6 nT at 0830 UT (i.e.
~30min time lag which make sense as theBXtoBYratio
was positive). Strong backscatter (a band of high backscatter power) developed at auroral latitudes and the activity are associated with line-of-sight ¯ows in the range from 0.5 to 1 km s)1. Another activity increase at 0915 UT is seen in the upper panel of Fig. 2, and this time is associated with the onset of a sequence of PMAFs. Between the two activity enhancements at 0900 and 0915 UT, the equatorward boundary migrated poleward from 155° to 150° scan-angle, which is consistent with the gentle rise in IMF BZ from )6 at
0830 UT to)5 nT at 0843 UT. IMFBYwas weak, but notably it underwent a polarity change from positive to negative during the same time interval. The latter activity change at 0915 UT is attributed to the sharp rotation of IMF from south to east in the course of a couple of minutes. The increasing strength of negative IMF BY is expected to shift the cusp location
dawn-wards (see. Moen et al., 1999). Figure 4a presents a sequence of all-sky images from 0850 to 0940 UT in
~10min intervals. The colour scale is linear with
increasing intensity from blue to red. The yellow squares superimposed onto the all-sky images mark position of the radar gates with spectral width ³220m s)1. Back-scatter with insucient signal to noise ratio were discarded when employing the spectral width ®ltering on the data. This cut-o was taken to be the 0dB at lag 0in the ACF. All-sky imagery reveals that the two discrete enhancements in activity level seen by the MSP at 0900 and 0915 UT, were both related to activity enhancements surging across the scan-meridian from the east. With the latter surge, pulsed cusp-like (red-dom-inated) aurora became established across the full ®eld-of-view. A sequence of four major PMAFs is seen in the upper panel of Fig. 2 from~0915 to 1005 UT.
Strong backscatter developed within the auroral zone from 0900 UT onwards (see the second and third panel of Fig. 2). Up until about 1005 UT the auroral zone backscatter have large spectral widths colour-coded from light green to red, i.e. larger than 250m s)1. In Fig. 4a, high-spectral width backscatter (³220m s)1) initially occurred as a patch associated with brightening
of the optical aurora south of Svalbard around 9 UT; 10min later, the patch of radar cusp backscatter has expanded eastwards and polewards. Strong backscatter became established across the full radar ®eld-of-view at the time when the 0915 UT surge of pulsed cusp activity expanded into the ®eld-of-view from east. The spectral width boundary lines up remarkably well with this, and clearly follows the dynamics of the equatorward auroral boundary. The radar cusp backscatter typically extends north of the optical aurora. The all-sky observations are
continued in Fig. 4b for another half hour. Note that Fig. 4b contain 630.0 nm images in the upper row, and simultaneous 557.7 nm images in the bottom row. From 1000 UT onwards the spectral width boundary ceases to be collocated with the auroral boundary, but instead is located well south of it. By comparing the red line (upper row) and green line images (bottom row), a prominent transition is noticed from red-dominated broad activity region in the western half to a green-dominated discrete arc in the eastern part of the camera
®eld-of-view. The camera was not intensity calibrated and the transition from 630.0 nm to 557.7 nm auroral activity was identi®ed from the MSP observations (Fig. 3). There is a trend for the spectral width boundary to line up poleward of the discrete arc.
3.2 December 24, 1995
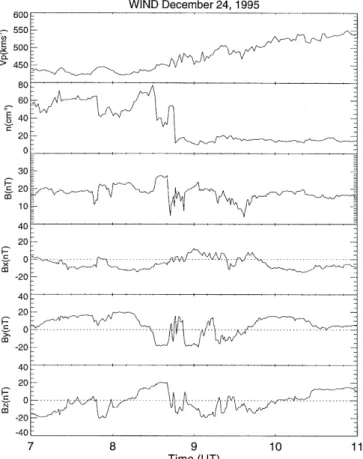
Figure 5 shows solar wind conditions probed by WIND at a location (31,)37, 0)REin XYZ GSM co-ordinates for the time interval 07±11 UT. The magnitude of IMF was strongly varied between 10±20 nT and the ®eld orientation underwent rapid changes several times. The active cusp auroral conditions on this day is related to the IMF observations from about 0840 to 1025 UT, when BZ ¯uctuated from weakly positive to strongly negative andBYexperienced a series of polarity changes from 15nT. Moen et al. (1999) studied the cusp auroral response to the IMF BY polarity change from negative to positive at ~0938 UT and documented a duskshift of the cusp position. The time lag from WIND to the auroral response of this particular discontinuity was estimated to be ~15 min. The time lag is subject to
variation as the satellite was located far east of the Sun-Earth axis, and the IMFBXtoBYratio underwent rapid
variations. For this case when the satellite is located on the dawnside upstream, a positive (negative) BX to BY
ratio will increase (shorten) the time lag compared to the nominal value. TheBXto BYratio was negative for the 15 min time lag estimated by Moenet al.(1999).
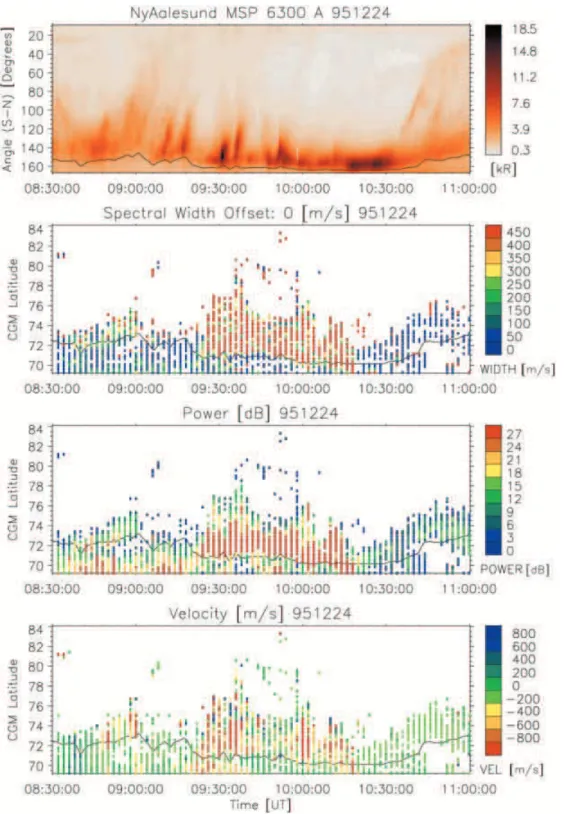
Figure 6 surveys MSP and CUTLASS observations for 0830±1100 UT. The narrowing and intensi®cation of the background arc at 0905 UT is a likely response to the southward turning of IMF observed by WIND
~20 min earlier. From 0905 to 0955 UT a sequence of 5
PMAFs is outstandingly clear, being formed in the quasi-steady narrow background arc and subsequently
moving poleward. After ~1010 UT the equatorward
edge of the aurora migrated southward beyond the MSP ®eld-of-view, which made tracking of the arc boundary impossible. A signi®cant increase in the emission inten-sity occurred at 1020 UT. At ~1035 UT, the arc split
into a high- and a low-latitude component, resembling a cusp bifurcation as described by Sandholtet al.(1998), which is an expected response to the sharp northward turning of IMF at ~1020 UT. Figure 7 shows the 630.0 nm (solid line) and 557.7 nm (dotted line) peak intensities measured by the MSP for the same interval as in Fig. 6. The auroral activity was strongly red-domi-nated throughout the time interval.
Strong backscatter developed within the auroral oval at 0925 UT, i.e. a few minutes after the ®rst two PMAFs. The radar back-scatter straddles the equator-ward boundary of 630.0 nm luminosity, and it is strikingly clear that the spectral width enhancement boundary is collocated and moves together with the auroral arc boundary up until 1010 UT, i.e. until the MSP lost sight of the arc boundary. At 1020 UT, an abrupt change occurred in the radar backscatter. A simultaneous decrease in backscatter power and nar-rowing of spectral width took place associated with a decrease in line-of-sight velocities. As will be discussed in Sect. 4.4, this may address the IMF BZ polarity change at around 10UT. Furthermore, the periods of strong line-of-sight velocities away from the radar consistent with poleward ¯ows centred on ~0930 and ~10UT in the bottom panel of Fig. 6 are likely
controlled by the negative bays in IMF BZ centred on
~0910 and~0945 UT (Fig. 5).
Figure 8a, b demonstrates 2D observations of radar and optical aurora for the time interval from 0918.53± 1020.26 UT. As for the December 17 case, the yellow squares mark radar gate locations of spectral widths
³220m s)1. The ®rst four images in Fig. 8a are
~2 min
apart and illustrate how backscatter develops in relation to the active aurora. No clear correlation between auroral intensity and HF backscatter spectra is apparent at this early stage. In the ®rst image (0918.53 UT) radar cusp backscatter are seen east of the most intense optical aurora, but develop across the entire CUTLASS ®eld of view within 6 min (see the 0924.08 UT image). The bright aurora displayed in the 0932.24 UT image happened to be the ®rst PMAF in the sequence associated with strong backscatter (see Fig. 6). When strong backscatter has developed, the spectral width boundary lines up and intimately follow the equator-ward border of the optical cusp, except for a some sporadic gates of possible ground-clutter further south. The mismatches seen in the 1004.40, 1012.55 and 1018.55 UT images are a combined eect of camera sensitivity decreasing towards the limb and motion of the arc boundary out of the camera ®eld-of-view. An IMF BY regulated dusk-shift of the cusp location, as reported by Moen et al.(1999), is apparent in Fig. 8b. The last expansion, moving in from a cusp location south±west of Svalbard, is seen in the 0948.54 UT image. Thereafter cusp auroral forms drifted westwards across the ®eld-of-view from a new location southeast of
Svalbard. One such brightening is seen in the 0956.25 UT image, and the east±west dynamics of a subsequent event from this new location is illustrated in the bottom row in Fig. 8b. When BZ is weak and BY
strong, pulsed cusp auroral events propagate east-west and within the auroral band, and do not appear as PMAFs in Fig. 6. The radar cusp backscatters do not seem to be particularly sensitive to the east±west dynamics of the optical aurora, but rather remain strong until their abrupt turn-o at ~1020 UT. In
association with the IMFBZnegative bays and PMAFs, the radar cusp backscatter notably extend much further into the polar cap than the optical aurora.
4 Discussion
4.1 Boundary layer sources
From Fig. 2, we recall that on December 17 the aurora was diuse from 0830 to 0915 UT, with a discrete step increase in intensity at 0855 UT corresponding to a discrete step decrease in theBZcomponent of IMF. The second major activity change occurred at 0915 UT in response to an IMFBYregulated westward shift of the auroral activity centre, seen by the MSP as the onset of pulsed activity including the sequence of PMAFs. The third activity change seen by the MSP began at
~1005 UT, as a change in optical spectral content with
decreasing 630.0 nm and increasing 557.7 nm emission intensities (see Fig. 3). At this time Svalbard was located underneath a transition from pulsed red-dominated aurora on the west side to intense 557.7 nm discrete arc aurora on the east side (Fig. 4b). NOAA-12 ¯ew over Svalbard around 0841 UT cutting through the stable arc of relatively faint 630.0 nm aurora. The key particle signatures probed were similar to those Moen
et al.(1996) and Lockwood and Moen (1996) attributed to open LLBL. The particle data (not presented here) can be described as follows: the red-dominated aurora were populated by a high ¯ux of magnetosheath-type origin (integral ¯uxes of 300±460 eV electrons and 0.3± 2.35 keV ions, see Sect. 2.3) and a modest ¯ux of isotropic magnetospheric ions and electrons (>30keV, see Sect. 2.3). The equatorward edge of the auroral arc was collocated with a sharp cut-o in the magneto-sheath component bordering on the 100 keV electron trapping boundary. The characteristic electron energy within the arc was at or below the 300 eV sensitivity threshold of TED, while the ion energy was 3 keV at the equatorward border, exhibited a sharp decrease with latitude, and dropped to the energy threshold level of 300 eV during the arc crossing. The pulsed red-domi-nated activity west of Svalbard around 1010 UT was probed by NOAA-14 along the path illustrated in red in the bottom right frame of Fig. 4b. Particle characteris-tics similar to those of the NOAA-12 pass were measured (data not presented here). The red aurora was again populated with magnetosheath-type particles. The ion energy decreased from 8 keV to 1 keV with increasing latitude across the arc, and the equatorward
arc boundary and magnetosheath particle cut-o were again located poleward of the 100 keV electron trapping boundary. In accordance with the cumulative knowl-edge of polar cap boundary phenomena and the IMF control of the auroral morphology, the magnetosheath-like particle injection with energy dispersed ions pole-ward of the electron trapping boundary are key characteristic signatures of open LLBL/cusp ®eld lines (Lockwood et al., 1998). The discrete 557.7 nm arcs extending from the pulsed cusp/cleft aurora into the post-noon sector are likely footprints of R1 currents of BPS origin. This interpretation is in accord with the ®rst of two possibilities outlined by Milanet al.(1999) who based their interpretation on assumed locations of the open/closed ®eld line boundary. Keep in mind that the main objective of Milan et al. (1999) was to study boundary motions and ¯ow excitation.
For the December 24 case, we limit our interest to the 0905±1035 UT interval of ionospheric observations, corresponding to predominantly IMF BZ south condi-tions with a series of sharp polarity changes in IMFBY. The auroral morphology is intimately regulated by the IMF orientation and constitutes as such a prime example of type 1 cusp auroral activity according to Sandholtet al.(1998). Sequences of PMAFs and strong poleward ¯ows occur in response to negative bays in IMFBZ, whereas east±west movements take over during periods when IMF BY dominates. Moen et al. (1999) documented the IMF BY regulation of the convection pattern and the longitudinal location of the activity centre. The high 630.0 nm to 557.7 nm intensity ratio throughout this interval provides another ®rm indica-tion of magnetosheath particle injecindica-tions along IMF connected ®eld lines. Unfortunately, there were no suitable DMSP or NOAA crossings to calibrate the precipitation source on December 24.
Experience has shown that the LLBL, cusp and mantle precipitation regimes cannot be distinguished from each other in an electron stimulated auroral display (Moen et al., 1998; Sandholt et al., 1998). However, the most essential boundary when studying solar-terrestrial interactions is the open-closed ®eld line boundary. Based on the established criteria for open LLBL/cusp signatures, the radar cusp backscatter seen from 09±10 UT on December 17 and from 0920 and 1010 UT on December 24, bounded by the 630.0 nm activity on the equatorward side, occurred on opened magnetic ®eld lines. Our observations are in analogy with Pilkington et al. (1975) who reported a near collocation between the poleward HF curtain and the poleward trapping boundary for >40keV electrons.
4.2 Correlation between the CUTLASS³220 m s)1
spectral width boundary and 630.0 nm boundary observed by MSP
CGMLAT co-ordinate reference as used for the radar observations. The latter step involves an educated guess as to the emission altitude. The NYA MSP system has not been developed for subtracting background lumi-nosity and Milan et al. (1999) chose an intensity isocontour level to represent the 630.0 nm arc boundary. However, as the background intensity may dier considerably from one day to another, the isocontour intensity has to be set manually for each data set. During observation intervals of hours the background luminosity may be subject to large changes, which lead to systematic osets of the chosen isocountour bound-ary from the actual precipitation boundbound-ary. The
max-imum gradient method used here is insensitive to background luminosity and very reliably traces the equatorward boundary of 630.0 nm cusp activity. This improvement limits uncertainty in the arc boundary location to only that associated with the assumption of the 630.0 nm emission altitude. Furthermore, when the auroral band is located south of the observation site as here, the equatorward boundary is the southern bottom edge of the arc being scanned. Then the auroral height assumption is reduced to only estimating the emission cut-o height, a task with inherently much smaller uncertainty (it involves uncertainties of a fraction of the molecular scale height at relatively low temperatures, rather than of atomic scale heights at relatively high temperatures). Overall this dramatically reduces the uncertainty in boundary location, the scale height eect alone reducing the uncertainty to less than half. The average energy of cusp electrons is less than 220eV, but energies typically ranges from few tens of eV to~500 eV (Newell and Meng, 1988). The stopping altitudes for mono-energetic electron beams of 100 eV, 200 eV and 400eV, are 320km, 250and 200km, respectively (see e.g. Millwardet al., 1999). Allowing for both excitation by precipitating electrons and quenching by molecular species the 630.0 nm emission will con®ne the expected peak-emission altitude to~225±300 km. Millwardet al.
(1999) pointed out that the emission altitude may increase with latitude inside the cusp, from considerably lower than 250km at the equatorward edge to nearer 300 km at the poleward edge, this due to energy dispersion. Hence, the emission cut-o height is expect-ed not higher than 250km.
The aim of this work was to check whether enhanced spectral widths can serve as a marker of the cusp boundary. In the top panel of Fig. 9 the southernmost gate position of spectral widths ³220m s)1 has been plotted as a function of the 630.0 nm auroral boundary, assuming emission altitude of 250km for both the data sets. The plot includes only the periods of a well-established radar cusp boundary within the MSP ®eld of view, i.e. from 09±10 UT on December 17 and from 0920 and 1010 UT on December 24 (see Figs. 2 and 6). We would like to emphasise that the band of high-power cusp backscatter is associated with high spectral widths, i.e. that the equatorward edge of high (³220m s)1) spectral widths nearly coincide with the equatorward edge of steeply enhanced backscatter power as demonstrated by Milan et al. (1997). The boundary motions for December 17 and 24 are clustered around 71 and 73.5 CGMLAT, respectively. On both days the auroral activity was situated south of the MSP observation site located at 76 CGMLAT. The full line depicts a least-square ®t representation of the two data sets, and the dashed line serves as a guideline to co-location of the two boundaries. The trend is a clear. The gap between the two boundaries increases with latitude, with the radar cusp edge located poleward of the optical cusp boundary. If there were any physical relationship between the precipitation boundary and the radar cusp boundary, one might have expected that the distance between the two boundaries should be independent of
Fig. 4. a Selected colour-coded (ranging from blue to red with increasing intensity) all-sky images of the 630.0 nm aurora for the period 0850.09 UT to 0940.00 UT on December 17, 1995. The auroral emission is mapped onto a geographical grid assuming an emission altitude of 215 km. The images have been cut at 75°zenith angle. Theyellow squaresmark positions of gates with spectral widths
³220m s)1along CUTLASS Finland beams 5±11 from west to east.
bTheupper rowshows colour-coded all-sky images of the 630.0 nm aurora for the period 0950.35 UT to 1010.17 UT, and thebottom row shows corresponding images of the 557.7 nm aurora. An emission height of 150km has been assumed for the 557.7 nm emission, and these images have been cut at 80°zenith angle. Please note that the camera was not absolute calibrated and the colour coding should not be inter-compared. Thered linein thebottom right panelindicates the trajectory of a NOAA-14 pass
b
latitude, as would result from adjusting the emission height. On December 17 the aurora was less red-dominated than on December 24. This indicates that the electron precipitation was somewhat harder and in turn suggests a lower emission height on December 17 compared to December 24. The bottom panel of Fig. 9 illustrates the eect of lowering the emission height from 250km to 215 km for this December 17 data. The correlative coecient, r, remained nearly unchanged (0.962115 versus. 0.963262). Lowering the altitude is based on physics. The altitude to which it was lowered is
based on obtaining latitude independence of the sepa-ration between the best ®t line (dashed) and the solid line indicating boundary co-location. Latitude indepen-dence could also have been achieved by increasing the emission height on the December 24 data, but a bottom emission altitude of higher than 250km at the equator-ward cusp edge seems unrealistic (Millequator-wardet al., 1999). The large spread of data points (1 degree lati-tude = 110km) about the best ®t line seem to worsen with latitude, if there is any latitude dependence to be found. If the spread were due to a time varying emission
altitude of the 630.0 nm emission, the spread would have diminished towards the MSP site of 76 CGMLAT. A random variation in emission altitude between 215± 250km would introduce a scatter in auroral boundary location of ~0.7°around 70.5 CGMLAT (5°in latitude
south of Ny-AÊlesund) and~0.4°around 73.5 CGMLAT
(2.5° in latitude south of Ny-AÊlesund). The quite opposite trend in latitude spread around the best ®t lines in Fig. 9 indicates that the spread is rather being introduced by the physical nature of radar cusp back-scatter/ radio wave propagation, e.g.: (1) uncertainty in the geographic location of the radar echoes; (2) the 220m s)1 criterion used for the radar cusp boundary; (3) the generation mechanism of plasma irregularities.
Point (1) is related to the fact that we do not know the exact radio wave propagation path. Range determina-tion performed by the radars is based on the time-of-¯ight of radar returns. This provides an accurate measure of the length of the group path taken by the radar signal (also known as slant range or radar range), but this is an overestimate of the ground range to the scatter volume. A detailed knowledge of the electron density distribution within the radar's propagation environment would allow a ray-tracing analysis to transform from radar range to ground range accurately. Without this detailed knowledge, however, assumptions must be made regarding the characteristics of the propagation mode to the scatter volume. Such consid-erations, speci®cally whether radar signals propagate by the 0.5-F mode or 1.5-F mode, have been discussed at some length by Milanet al.(1997, 1998): near- and far-range scatter is expected to propagate by the 0.5-F and 1.5-F modes, respectively. For simplicity our analysis of SuperDARN data assumes that all echoes are 0.5-F mode returns, that signals propagate at the speed of light in vacuo, and that the ray path is a straight line, that is the eect of refraction is neglected. These assumptions tend to overestimate the range to more distant scatter if a realistic scattering altitude (~250km) is used in the
calculations, so to overcome this we further assume that
the scatter originates from the arti®cially high altitude of 400 km. This compromise is found to work well for most ranges, though the inaccuracy increases with greater distance. The accuracy of our range determina-tion can be tested with the Tromsù high power radio wave facility which arti®cially stimulates ionospheric irregularities at a known altitude and location from which the CUTLASS radars receive coherent backscat-ter (see e.g. Wright and Yeoman, 1999). At a range of 2000 km, the assumptions employed in the routine analysis discussed lead to a systematic overestimate in the range to the heater volume of some 60km (T. K. Yeoman, personal communication, 2000). This repre-sents the ®rst and only direct measurement of absolute range by a SuperDARN radar, but other studies have investigated the range accuracy between dierent prop-agation modes. These include: Milan et al.(1998) who examined a case in which propagation to the dayside auroral zone changed sharply between the 0.5-F and 1.5-F mode with little discernable change in range being observed; Andre et al. (1997) who compared observa-tions at dierent radar operating frequencies and demonstrated a range consistency of the order of 45 km or one standard range gate; and modelling work by Villainet al. (1985) which again estimated that range uncertainty was of the order of 45 km or less. Our overall conclusion is that for the distances of interest in the present study the range uncertainty due to the radar data analysis is no larger than 60km (corresponding to four 15 km gates on December 17 and two 30km range gates on December 24) and that this is likely to be an overestimate of the true range. Furthermore, for each event this overestimate will be systematic, that is the equatorward boundary of cusp backscatter, which is of particular interest for this study, will be displaced in latitude but its shape should remain essentially un-changed. We note in fact from Figs. 4 and 8 that the 630.0 nm and spectral width boundaries are very similar in shape, even when the boundary is undulating or changing. Thus, uncertainties in mapping the slant range to geographic location are expected to shift the bound-ary location by ~40±60 km, but are not expected to cause scatter of 1° as is the case in Fig. 9. Hence, we suggest that this spread is caused mainly by points (2) and (3) which will be illuminated further in Sect. 4.3 and 4.4.
4.3 Radar cusp discriminating criteria
The general trend seen from the 2D morphology (Figs. 4 and 8) is that once strong backscatter has developed at latitudes of red-dominated cusp aurora, the equator-ward edges of the 220m s)1 spectral width boundary and optical auroras are closely collocated and show the same motion. This indicates that the³220m s)1spectral width criterion serve as a robust ®lter to delineate the cusp activity boundary albeit there are some problems, in particular at the east and west ends of radar cusp activity (perhaps associated with geometry of viewing angle). Figure 10a±d shows radar Doppler spectra along
individual radar beam crossings of the cusp activity boundary, so we shall now consider boundary transition features in the spectra. Each spectrum has been self-normalised and the bar on the right side in each frame provides a crude indicator of the backscatter power. Figure 10a displays spectra from gates 15 to 30 along beam 9 sampled at 0910.43 UT on December 17. Beam 9 corresponds to the fourth beam stripe from right in the 0910.17 UT frame of Fig. 4a, i.e. related to the devel-oping phase of radar cusp backscatter. The ®ve yellow square gate positions south of the auroral arc
corre-spond to gates 16, 20±22 and 24, and gate 27 collocates with the auroral boundary. Gates 15, 17±19, 23, 25±26 were all discarded by the ³220m s)1 ®ltering and/or poor signal to noise ratio. For this particular case the radar cusp boundary is marked by the transition from a multi-peak to a single-peak spectrum. The backscatter power levels of gates 27±30embedded in the optical aurora are higher than gate 26 and below. The low backscatter power south of gate 27 may imply that spectra there are susceptible to noise and interference, which may account for the complex form of the spectra there. Figure 10b shows Doppler power spectra along beam 7 corresponding to the third beam stripe from left in the 1010.17 UT frame of Fig. 4b, and represent an example of an unclean boundary near the postnoon end of cusp aurora. The yellow squares in Fig. 4b from south to north along the beam stripe mark locations of gate 9, 19, 25±26, 28, 30, 34±41, 43±53 and 58. Letting our eye be guided by the 630.0 nm activity boundary we take gate 34 as being representative of the radar cusp boundary. Again the spectral width criterion failed to pick the boundary, which in this case stands out as an apparent change in the spectral shape, from a single peak to a broad arti®cial spectrum. The spectra of gates 34 and 35 look synthetic and are likely an artefact of the signal processing (see discussion later). The backscatter power remained high across the cusp activity boundary. Figure 10c, d presents radar power spectra from gate 15±30along beam 10and beam 11 corresponding to the fourth and the ®fth beam stripes from left in the 0932.24 UT frame of Fig. 8a. Let us ®rst consider beam 10in the 0932.24 UT frame of Fig. 8a. The ®ve gate positions seen south of the arc correspond to gates 11± 13 (not shown) and 15±16 (shown) in Fig. 10c. These are all single peaked spectra with spectral widths larger than 220m s)1. Gate 19 is the one that collocates with the arc boundary. However, the apparent change in spectral shape seen from a narrow single-peak in gate 17 to a multi-peak in gate 18 may suggest gate 18 to be a marker for the radar-cusp cleft boundary. Gate 18 was discard-ed due to a bad signal to noise ratio.A notable increase in backscatter power occurred at gate 20north of the auroral boundary. The broad and smoothed spectra at gates 19 and 21 are suggested to be an artefact of the signal processing. Gates 22±26 within the aurora provide good examples of broad complex spectra with high power and hence not susceptible to noise/interfer-ence problems that may in¯unoise/interfer-ence the spectral shapes when the backscatter power is low. Along beam 11 we see a prominent transition from narrow single peaked spectra from below gate 19 to broad spectra of various shapes from gate 19 and above. Gate 19 is the southernmost gate in the third beam stripe from left in the 0932.24 UT frame of Fig. 8a, and again, it is an arti®cially shaped spectrum that lines up with the optical boundary. It is also seen that a signi®cant increase in power occurs at the fourth gate north of the boundary.
Before we continue, in a similar manner, to inspect more CUTLASS Doppler spectra later, let us pause to consider the nature of the HF coherent backscatter
Fig. 8.a A sequence of colour-coded (blue to red with increasing intensity) 630.0 nm all-sky images for the 0918.53±0940.39 UT interval on December 24, 1995. Theyellow squaresmark positions of gates with spectral widths³220m s)1along CUTLASS Finland beams 7±13 from west to east.bA continuation ofa
b
echo. It has been known for some considerable time that strong ®eld-aligned plasma density structures are found in the cusp, and it has thus been natural to explore HF coherent echoes as a means of detection of the cusp. The HF echo comes from the total number of discrete coherent scatterers within the radar illuminated volume. If within a radar range resolution cell (volume de®ned by the radar pulse length and radar beam envelope), there are several scatterers all moving with identical velocity component along the radar line-of-sight, all these echoes will: (a) have the same Doppler shift; (b) appear at the same spectral shift; and (c) add to a clean narrow echo. However, Andre et al.(1999) demonstra-ted that this idealised picture may be signi®cantly disturbed by the electric ®eld noise commonly observed in the cusp (e.g. Maynard et al., 1991; Basinska et al., 1992). They simulated HF-observations of randomly
disturbed scatterers totally correlated but subjected to Pc1±Pc2 wave activity. This was to investigate the possible eect on HF radar ACFs of the step-like increase of the 0.2±2.2 Hz band activity observed collocated with the cusp precipitation boundary (Er-landson and Anderson, 1996; Dyrudet al., 1997). Their simulation results reveal that the broad multi-peaked cusp spectra may indeed be stimulated by the Pc1±Pc2 wave perturbation of the velocity ®eld. This is an artefact of under-sampling, i.e. that the radar sampling rate is less than the Nyquist frequency.
``Arti®cial spectra'' (e.g. at range gates 34±35 in Fig. 10b) are usually a consequence of an inherent system limitation. Once a pulse is transmitted, the receivers are to record the return signal for a length of time equivalent to the time taken for the signal to propagate to the maximum radar range and back again.
This, however, is longer than the inter-pulse spacing, and when the subsequent pulse is transmitted the receivers have to be turned o for a short duration. This leads to ``bad lags'' at some ranges (range gates). When the number of ``bad lags'' at a particular range become too great, the ACF becomes poorly de®ned, especially if strong backscatter power occurs at other range ranges (``cross-range'' noise). These poorly de-®ned ACFs lead to synthetic spectra. This happens preferentially at certain gates, e.g. 19 (Fig. 10c, d) and 34±35 (Fig. 10b). If too few lags are available the data are usually discarded by the ACF ®tting analysis.
Other contamination sources will on occasion occur as well. These will include both generic, e.g. ground clutter, and system speci®c with details dependent on the particular system and environment, e.g. receiver char-acteristics and ray propagation paths. The raw data shown here thus also have to have some limited number of range gates eliminated from consideration in the comparison. These were few enough to negligibly impact the ®ndings, and having no asymmetry led to no bias of the ®ndings.
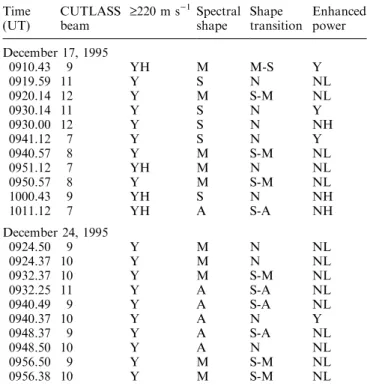
Let us now return to further examination of the HF radar echo characteristics, and their relationship to optical boundaries, for the remaining data presented here. We have manually inspected 17 more radar beam intersections of the cusp activity boundary and the observations are coded in Table 1. Column 3 and 4 yield spectral width and spectral shape of the southern-most cusp radar gate. Y, N, or YH in the third column refers to the ful®lment of the 220ms)1 spectral width criterion and stand for yes, no, or yes but high spectral widths across the boundary, respectively. S, M, or A in the fourth column refers to single-peak, multi-peak or arti®cial shape, respectively. The fourth column codes the transition in spectral shape across the boundary (the boundary marker gate has been compared to the neighbouring gate south of), e.g. S-M means a transi-tion from single to multi-peak, and N stands for no transition. The ®fth column describes change in back-scatter power across the boundary, where y(es) means enhanced power, and NH and NL indicates n(o) change in power, power stayed either h(igh) or l(ow). The spectral width enhancements readily appear to be the most characteristic feature of the cusp activity bound-ary. It should be noticed however that the boundary marker gate of enhanced spectral width may have all various shapes and cannot always be subscribed a physical meaning. On December 24 in particular, the good correlation between the spectral width enhance-ment boundary and the optical cusp boundary was aided by a well-de®ned sharp transition from narrow single peak to broad synthetic spectra. In four of the 21 cases the spectral width stayed high across the cusp auroral boundary. In the ®rst of these four cases a transition was seen in both shape and power, and in the last of them, a transition was seen only in the spectral shape. For the other two cases, a boundary was not apparent in the radar data at all. In most cases the backscatter power stayed low (NL) across the cusp boundary but a steep increase was seen a few gates
further north of the auroral cusp boundary. We interpret this as due to ®nite growth rate times of plasma irregularity formation (see Sect. 4.4 for more details). For the 21 cases in Table 1 we counted 341 gates of enhanced spectral widths north of the cusp boundary. Of these gates 67% had broad multi-peak, 20% broad single peak and 13% broad arti®cial spectra. It is beyond the scope of this study to systematically examine whether an identi®able signal to noise ratio can be de®ned, below which the multi-peaked spectra are so low in power that they are susceptible to noise/interference and become unreliable as indicators of boundaries.
Baker et al. (1995) found LLBL to be largely associated with single-peak spectra and the complex multi-peak spectra were addressed to cusp/mantle. As was pointed out in Sect. 4.1 by ground-based optical measurements we are not able to discriminate between cusp and LLBL. It may well be that the broad single-peak Doppler spectra address open LLBL. The diuse east±west edges of the radar cusp aurora reported by Baker et al. (1995) is consistent with our observations (see Figs. 4 and 8).
Table 1. The ®rst column gives sampling time for the beam number in the second column. Third column describes the southernmost gate of cusp activity with respect to the spectral width criterion, where Y (yes) means ³220m s)1, N (no) means <220m s)1, and YH (yes high across) means that also the neighbouring gate south of the cusp boundary had a spectral width
³220m s)1. Fourth column describes the shape of the radar Doppler spectrum of the southernmost gate of cusp activity, where S, M, A, are codes for single peak, multi-peak, arti®cial shape, respectively. The ®fth column describes the transition in shape across the cusp boundary, where e.g. M-S means a transition from multiple to single peak, and N stands for no change in shape. The sixth column speci®es change in power across the boundary, Y for enhanced power, NH for no change power stays high and NL for no change power stays low
Time (UT)
CUTLASS beam
³220m s)1Spectral shape
Shape transition
Enhanced power
December 17, 1995
0910.43 9 YH M M-S Y
0919.59 11 Y S N NL
0920.14 12 Y M S-M NL
0930.14 11 Y S N Y
0930.00 12 Y S N NH
0941.12 7 Y S N Y
0940.57 8 Y M S-M NL
0951.12 7 YH M N NL
0950.57 8 Y M S-M NL
1000.43 9 YH S N NH
1011.12 7 YH A S-A NH
December 24, 1995
0924.50 9 Y M N NL
0924.37 10 Y M N NL
0932.37 10 Y M S-M NL
0932.25 11 Y A S-A NL
0940.49 9 Y A S-A NL
0940.37 10 Y A N Y
0948.37 9 Y A S-A NL
0948.50 10 Y A N NL
0956.50 9 Y M S-M NL
4.4 Formation and drifts of radar backscatter irregularities
Radar cusp backscatter developed within the band of pre-existing 630.0 nm emissions both days. Bearing in mind that two conditions are to be met for HF backscatter to occur: (1) favourable radio wave propa-gation conditions, and (2) ®eld aligned irregularities. The onset on December 17 may appear to accompany intensi®cation of the optical aurora. However, that is clearly not the case on December 24. The IMF BZ
regulated onset of PMAFs occurred ~15 min prior to the development of radar cusp, and the radar cusp initially formed east of the brightest region of 630.0 nm luminosity (demonstrated by the upper left image in Fig. 8a). A successful ``®rst hop'' is mandatory for CUTLASS Finland to receive far range echoes from above Svalbard. Refraction (ray path) conditions are determined by the operating frequency and the F2 layer density pro®le (e.g. Milanet al., 1997). According to the backscatter occurrence statistics conducted by Milan
et al. (1997) for the same winter (1995/96), CUTLASS illumination of the ionosphere at Svalbard latitudes is typically limited to a 3 h interval starting at ~10UT. CUTLASS operated at the same frequency range (9.915 to 9.985 MHz) both days, and if the onset time is regulated by radio wave propagation conditions, we are left with the build up of F region plasma density to feed the near-noon F layer as the major controlling factor. This means that the solar zenith angle must be suciently high to accumulate adequate bottomside F region plasma densities for propagation path connec-tivity, and that corrotational or other transport of these plasma densities place them with reasonable repeatabil-ity in line with the propagation path from the CUT-LASS Finland transmitter site and the cusp re¯ection region above Svalbard. The solar zenith angle referred to Longyearbyen was )12.8° at the onset December 17
(0900 UT) and)12.7°on December 24 (0920 UT), very
repeatable and adequate for bottomside plasma to build up. The re¯ection height for the CUTLASS radar propagation path from the Finland site is at suciently low latitude (~62.5°±63.5°CGMLAT) that the bottom-side plasma densities at the local times here would be reasonably expected to reproduce on these two days. Thus, this is consistent with the simple interpretation that F region density for propagation connectivity was the ``switch'' for seeing the turn on of HF echoes, rather than the turn on of the irregularities themselves.
Three fundamentally dierent mechanisms are pres-ently thought to comprise the set of processes by which cusp irregularities are produced, although it is not known which one(s) dominate for particular common conditions. The gradient drift plasma instability mech-anism is known to occur for plasma drift, of only the right sign, across a steep plasma density gradient (perpendicular to the magnetic ®eld at high latitudes) (Keskinen and Ossakow, 1981, 1983). Later the theory of this basic gradient drift process was extended to include the eects of auroral currents at high latitudes on its quantitative thresholds and behaviour. These
have been proposed to be the dominant plasma structuring mechanisms in the southward IMF polar cap ionosphere. Velocity shear driven plasma instabil-ities are now also known to occur for suciently severe velocity shears (Basu et al., 1988, 1990) and are believed to dominate the northward IMF polar cap. Keskinen et al. (1988) has applied a Kelvin-Helmholtz instability theory to these latter instabilities, adding the re®nement of ionospheric-magnetospheric electrical coupling. Tsunoda (1988), in a broad review paper, has further suggested a ``stirring'' mechanism, that in eect leads to interchange of low density plasma ¯ux-tubes with high density. Although not discussed there, we note that a theoretical examination of ``stirring'' would have to include gradients perpendicular to the magnetic ®eld, of mobility or conductivity driven by particle precipitation, a term not yet included to our knowledge.
The HF radar measurements do not provide any direct means to distinguish between the dierent candi-dates of cusp plasma irregularity formation, but the combination of optics and CUTLASS may give us some insight though. The abrupt drop in backscatter power about 1020 UT on December 24 (see Fig. 6) corre-sponds to a near simultaneous drop in the line-of-sight away ¯ows and narrowing Doppler spectral widths. This is attributed to the IMFBZpolarity change from weakly negative to weakly positive observed some 17 min earlier by WIND under BY dominated conditions. The all-sky imagery con®rms that the movements of auroral intensi®cation were strictly westward without any sign of a poleward pull, the situation one would expect for the conditions of an extremely strong IMF BY domi-nance (~15 nT). The sudden fall in backscatter power is
taken to indicate that backscattering irregularities reduced forming. This would be consistent with the gradient drift instability process, which requires pole-ward plasma ¯ow to be active near the cusp precipita-tion boundary (see Introducprecipita-tion).
The gradient drift instability and current convective instability both requires a density gradient on which to operate (Ossakow and Chaturvedi, 1979; Chaturvedi and Ossakow, 1981). Observations and modelling dem-onstrated by Watermanet al.(1994) and Millwardet al. (1999) show that F-region density values of the order of 2 to 4´1011m)3 easily build up due to soft magneto-sheath precipitation. Recent observation by Walkeret al.
Sojka et al., 1994) in looking for the source of density gradients to feed irregularity formation processes here. Based on Sondrestromfjord ISR observations of plasma dynamics, combined with scintillation measurements of plasma irregularities, Basu et al.(1994) postulated that the gradient drift plasma instability mechanism gener-ates irregularities associated with discrete plasma den-sity enhancements in the cusp polar cap region, and that the shear-driven instability may generate irregularities in the intervening low-density regions. They calculated growth time for the gradient instability process operat-ing in weakly collisional plasma at 400 km altitude to be of the order of 30s. This likely explains why the radar cusp boundary is oset north of the precipitation boundary by a few tens of kilometres.
The radar and optical auroral activities lines up very well at the equatorward boundary, but radar cusp backscatter extends far north of the optical aurora, in particular when IMF BZhas signi®cant negative values associated with strong poleward ¯ows. This follows directly from the decay rates and well-known long lifetimes for irregularities in the dark polar cap (e.g. Basuet al., 1998). Note also that the radar cusp activity does not accompany the east±west dynamics of the optical events very well. These observations taken together indicate that backscatter irregularities are more long-lived than the optical events and that the irregu-larities formed convect with the plasma (see also Yeoman et al., 1997).
5 Summary and concluding remarks
A detailed study on the correlation between radar and optical cusp auroral morphology has been accomplished in a 2D perspective. The study is based on two December days of red-dominated type 1 cusp auroral activity associated with strong radar backscatter seen by the CUTLASS Finland HF radar above Svalbard. The
³220m s)1spectral width criterion proves to be a robust cusp identi®er. The ³220m s)1spectral width enhance-ment boundary lines up and correlates remarkably well with the type 1 cusp auroral boundary. A variety of boundary transitions was observed in the radar Doppler spectra, changing shape from narrow single-peak to broad multi-peak, narrow single-peak to broad arti®cial, or just a broadening of a single-peak spectrum. Largest discrepancies between the ³220m s)1 spectral width boundary and the optical cusp boundary are associated with the onset and fading of radar cusp aurora, but even in periods of strong backscatter, there is a one degree spread in collocation of the two boundaries. Our preliminary investigation indicates that a combination of spectral width and spectral shape may pin the radar cusp boundary more accurately. However, future work based on a larger data set will be necessary to ®rmly establish a re®ned set of criteria for identifying the cusp boundary by radar. The cusp is a very dynamic region, and the scattered picture of osets between the radar and optical cusp boundaries are partly due to factors like variable plasma drift and growth-time for plasma
instability to develop, plus uncertainties associated with positioning of radar gates and variability in the auroral emission altitude.
The onset time for radar cusp as seen by CUTLASS Finland above Svalbard near winter solstice at solar minimum conditions appears to be regulated by radio wave propagation conditions rather than lack of plasma irregularities. The abrupt fade in radar cusp backscatter on December 24, 1995 seems connected to an IMF BZ
polarity change, and was found consistent with switch-ing the gradient drift instability from an unstable (on) to a stable geometry (o). However, other instability processes cannot be ruled out. The combination of EISCAT Svalbard radar, CUTLASS and optics will open interesting new possibilities to conduct more direct studies of the relationship between cusp precipitation, formation of density gradients, and HF backscatter.
What we can unequivocally state however is that studies of this type can and should de®ne the degree to which HF coherent radar data can sense and track magnetospheric boundaries, in particular the cusp. We have identi®ed how to signi®cantly reduce the uncer-tainty of cusp boundary locations by optical techniques, especially for cases where the cusp boundary is south of the optical station. This advance follows from develop-ment here of new better approaches to processing the data. We have also identi®ed better criteria for inter-pretation of the HF coherent radar data, by better distinguishing between the three mechanisms that can produce the HF coherent radar echoes, rather than continue acceptance of dierent assumptions made by dierent workers leading to dierent interpretations of data. This advance follows from merging here recent ®ndings from two very dierent experimental tech-niques, to de®ne better the physical processes at work. This improved physical framework, more clearly de®ned by the need to ®t more observational constraints, should lead to stronger conclusions from HF radar data studies. In total, it is hoped that this work will speed the way to letting a broader community, use a larger base of data, with greater con®dence, to better under-stand dayside aurora, cusp, and dynamic boundary processes in the solar wind driven magnetosphere-ionosphere system.
Acknowledgements. The authors thank D. Evans for the NOAA observations, and K. Oglivie and R. Lepping for the key parameter WIND data used in this study. CUTLASS is supported by the Particle Physics and Astronomy Research Council (PPARC), UK, the Swedish Institute for Space Physics, and the Finnish Meteo-rological Institute, Helsinki. Financial support has provided by Norwegian Research Council, UNIS grant 9/963 and AFOSR task 2310G9. This work was initiated during JM's sabbatical stay at Air Force Research Laboratory, VSB, Hanscom AFB.
Topical Editor Denis Alcaycle thanks A. S Rodger and A. D. M Walker for their help in evaluating this paper.
References
AndreÂ, R., M. Pinnock, and A. S. Rodger, On the SuperDARN autocorrelation function observed in the ionospheric cusp, Geophys. Res. Lett.,26,3353, 1999.
Baker, K. B., R. A. Greenwald, J. M. Ruohoniemi, J. R. Dudeney, M. Pinnock, P. T. Newell, M. E. Greenspan, and C.-I. Meng,
Simultaneous HF-radar and MSP observations of the cusp, Geophys. Res. Lett.,17,1869, 1990.
Baker, K., J. Dudeney, R. Greenwald, M. Pinnock, P. Newell, A. Rodger, N. Mattin, and C.-I. Meng,HF radar signatures of the cusp and low-latitude boundary layer, J. Geophys. Res., 100,
7671, 1995.
Basinska, E. M., W. J. Burke, N. C. Maynard, W. J. Hughes, J. D. Winningham, and W. B. Hanson,Small-scale electrodynamics of the cusp with northward interplanetary magnetic ®eld,J. Geo-phys. Res.,97,6369, 1992.
Basu, Su., S. Basu, E. MacKenzie, P. F. Fougere, W. R. Coley, N. C. Maynard, J. D. Winningham, M. Sugiura, W. B. Hanson, and W. R. Hoegy,Simultaneous density and electric ®eld ¯uctuation spectra associated with velocity shears in the auroral oval, J. Geophys. Res.,93,115, 1988.
Basu, Su., S. Basu, E. MacKenzie, W. R. Coley, J. R. Sharber, and W. R. Hoegy,Plasma structuring by the gradient drift instability at high latitudes and comparison with velocity shear driven processes,J. Geophys. Res.,95,7799, 1990.
Basu, S., Su. Basu, P. K. Chaturvedi, C. M. Bryant, Jr.,Irregularity structures in the cusp/cleft and polar cap regions,Radio Sci.,29,
195, 1994.
Basu, S., E. J. Weber, T. W. Bullett, M. J. Keskinen, E. MacKenzie, P. Doherty, R. Sheehan, H. Kuenzler, P. Ning, and J. Bongiol-atti, Characteristics of plasma structuring in the cusp/cleft region at Svalbard,Radio Sci.,33,1885, 1998.
Chaturvedi, P. K., and S. L. Ossakow, The current convective instability as applied to the auroral ionosphere, J. Geophys. Res.,86,4811, 1981.
Davies, J. A., M. Lester, S. E. Milan, and T. K. Yeoman, A comparison of velocity measurements from the CUTLASS Finland radar and the EISCAT UHF system,Ann. Geophysicae,
17,892±902, 1999.
Dyrud, L. P., M. J. Engebretson, J. L. Posh, W. J. Hugues, H. Fukunishi, R. L. Arnoldy, P. T. Newell, and R. B. Horne,
Ground observations and possible source regions of two types of Pc1-2 micropulsations at very high-latitudes, J. Geophys. Res.,102,27 011, 1997.
Erlandson, R. E., and B. J. Anderson,Pc1 waves in the ionosphere: a statistical study,J. Geophys. Res.,101,7843±7857, 1996.
Greenwald, R. A., K. B. Baker, J. R. Dudeney, M. Pinnock, T. B. Jones, E. C. Thomas, J.-P. Villain, J.-C. Cerisier, C. Senior, C. Hanuise, R. D. Hunsucker, G. Sofko, J. Koehler, E. Nilsen, R. Pellinen, A. D. M. Walker, N. Sato, and H. Yamagishi,
DARN/SuperDARN: a global view of the dynamics of high-latitude ionospheric convection, Space Sci. Rev., 71, 761, 1995.
Hanuise, C., J. P. Villain, D. Gresillon, G. Cabrit, R. A. Greenwald, and K. B. Baker, Interpretation of HF radar ionospheric Doppler Spectra collective wave scattering theory, Ann. Geo-physicae,11,29, 1993.
Keskinen, M. J., and S. L. Ossakow,On the spatial power spectrum of the E´B gradient drift instability in ionospheric plasma clouds,J. Geophys. Res.,86,6987, 1981.
Keskinen, M. J., and S. L. Ossakow, Theories of high latitude ionospheric irregularities: a review, Radio Sci., 18, 1077, 1983.
Keskinen, M. J., H. G. Mitchell, J. A. Fedder, P. Satyanarayana, S. T. Zelesak, and J. D. Huba, Nonlinear evolution of the Kelvin-Helmholtz instability in the high-latitude ionosphere,J. Geophys. Res.,93,137, 1988.
Lepping, R. P., M. H. Acuna, L. F. Burlaga, W. M. Farrell, J. A. Slavin, K. H. Schatten, F. Mariani, N. F. Ness, F. M. Neubauer, Y. C. Whang, J. B. Byrnes, R. S. Kennon, P. V. Panetta, J. Scheifele, and E. M. Worley, The Wind magnetic ®eld investigation,Space Sci. Rev.,71,207, 1995.
Lockwood, M., and J. Moen,Ion populations on open ®eld lines within the low-latitude boundary layer: theory and observations during a dayside transient event,Geophys. Res. Lett.,23,2895, 1996.
Lockwood, M., P. E. Sandholt, S. W. H. Cowley, and T. Oguti,
Interplanetary magnetic ®eld control of dayside auroral activity and the transfer of momentum across the dayside magneto-pause,Planet. Space Sci.,37,1347, 1989.
Lockwood, M., S. Fuselier, A. D. M. Walker, and F. Sùraas, A summary of the NATO ASI on polar cap boundary phenomena, inPolar cap boundary phenomena Eds. J. Moen, A. Egeland, and M. Lockwood, NATO Advanced Study Institute Series, Kluwer Academic Press, Dordredt, vol. 509, p. 415, 1998.
Maynard, N. C., T. L. Aggson, E. M. Basinska, W. J. Burke, P. Craven, W. K. Peterson, M. Sugiura, and D. R. Weimer,
Magnetospheric boundary dynamics: DE-1 and DE-2 observa-tions near the magnetopause and cusp, J. Geophys. Res., 96,
3505, 1991.
Milan, S. E., T. K. Yeoman, M. Lester, E. C. Thomas, and T. B. Jones,Initial backscatter occurrence statistics from the CUT-LASS HF radars,Ann. Geophysicae,15,703, 1997.
Milan, S. E., T. K. Yeoman, and M. Lester, The dayside auroral zone as a hard target for coherent HF radars,Geophys. Res. Lett.,25,3717, 1998.
Milan, S. E., M. Lester, S. W. H. Cowley, J. Moen, P. E. Sandholt, and C. J. Owen,Meridian-scanning photometer, coherent HF radar, and magnetometer observations of the cusp: a case study, Ann. Geophysicae,17,159, 1999.
Millward, G. H., R. J. Moett, H. F. Balmforth, and A. S. Rodger,
Modeling of ionospheric eects of ion and electron precipitation in the cusp,J. Geophys. Res.,104,24 603, 1999.
Moen, J., D. Evans, H. C. Carlson, and M. Lockwood,Dayside moving auroral transients related to LLBL dynamics,Geophys. Res. Lett.,23,3247, 1996.
Moen, J., D. A. Lorentzen, and F. Sigernes, Dayside moving auroral forms and bursty proton auroral events in relation to particle boundaries observed by NOAA-12,J. Geophys. Res.,
103,14 855, 1998.
Moen, J., H. C. Carlson, and P. E. Sandholt, Continuous observation of cusp auroral dynamics in response to an IMF BYpolarity change,Geophys. Res. Lett.,26,1243, 1999. Newell, P. T., and C.-I. Meng,The cusp and the cleft/boundary
layer: low-altitude identi®cation and statistical local time variation,J. Geophys. Res.,93,14 549, 1988.
Ogilvie, K. W., D. J. Chornay, R. J. Fritzenreiter, F. Hunsaker, J. Keller, J. Lobell, G. Miller, J. D. Scudder, E. C. Sittler Jr., R. B. Torbert, D. Bodet, G. Needell, A. J. Lazarus, J. T. Steinberg, J. H. Tappan, A. Mavretic, and E. Gergin,SWE, a comprehen-sive plasma instrument for the Wind spacecraft,Space Sci. Rev.,
71,55, 1995.
Ossakow, S. L., and P. K. Chaturverdi, Current convective instability in the diuse aurora, Geophys. Res. Lett., 6, 332, 1979.
Pilkington, G. R., J. W. Munch, H. J. Braun, and H. G. MoÈller,
Comparison of ground HF backscatter and simultaneous particle and plasmapause measurements from a polar orbiting satellite,J. Atmos. Terr. Phys.,37,337, 1975.
Rodger, A. S., S. B. Mende, T. J. Rosenberg, and K. B. Baker,
Simultaneous optical and HF radar observations of the ionospheric cusp,Geophys. Res. Lett.,22,2045, 1995.
Ruohoniemi, J. M., R. A. Greenwald, K. B. Baker, and J. P. Villain,
Drift motions of small-scale irregularities in the high-latitude F region: an experimental comparison with plasma drift motions, J. Geophys. Res.,92,4553, 1987.
Sandholt, P. E., J. Moen, A. Rudland, D. Opsvik, W. F. Denig, and T. Hansen, Auroral event sequences at the dayside polar cap boundary for positive and negative IMFBY,J. Geophys. Res., 98,7737, 1993.