Annales Geophysicae (2004) 22: 807–817 SRef-ID: 1432-0576/ag/2004-22-807 © European Geosciences Union 2004
Annales
Geophysicae
On the relationship between aspect sensitivity, wave activity, and
multiple scattering centers of mesosphere summer echoes: a case
study using coherent radar imaging
J.-S. Chen1, P. Hoffmann2, M. Zecha2, and J. R¨ottger3,4
1Department of Electronic Engineering, Chienkuo Institute of Technology, Changhua 500, Taiwan 2Leibniz-Institut f¨ur Atmosph¨arenphysik, K¨uhlungsborn, Germany
3Max-Planck-Institut f¨ur Aeronomie, Katlenburg-Lindau, Germany
4Institute of Space Science, National Central University, Chung-Li 320, Taiwan
Received: 26 February 2003 – Revised: 3 July 2003 – Accepted: 4 September 2003 – Published: 19 March 2004
Abstract. A mesosphere-summer-echo layer, observed by
the OSWIN VHF radar (54.1◦N, 11.8◦E) with vertical and 7◦oblique radar beams, was examined using the method of coherent radar imaging (CRI). We disclosed the echo events having multiple scattering centers (MSC) in the radar volume by means of the high angular resolution of the CRI technique and found that the MSC events occurred more frequently in the upper portion of the echo layer. More examinations showed that the characteristics were different between the upper and lower portions of the layer. For example, the dif-ferences in echo power between vertical and oblique beams changed mostly from positive to negative along the increase of altitude, and strong turbulent echoes were seen in the up-per portion of the layer. These observations indicate that the aspect sensitivity of the echoes became less and less with the increase of altitude. Moreover, the scattering centers of the echoes were close to zenith for the lower portion of the layer but were usually several degrees from the zenith for the up-per portion of the layer. Observable wave-like variation in the scattering center was also seen in the upper part of the layer. Based on these features, we drew some conclusions for this case study: (a) the MSC events might result from the slanted layer/anisotropic structure tilted by short-wave activities, (b) the tilt angle of the layer structure could be 6◦–10◦, causing the echo power received by the 7◦oblique beam was larger than or comparable to that received by the vertical beam, and (c) short-wave activities not only tilted the layer structure, but also induced isotropic irregularities.
Key words. Meteorology and atmospheric dynamics
(mid-dle atmosphere dynamics). Radio science (interferometry; instruments and techniques)
Correspondence to:J. S. Chen (jschen@cc.ckit.edu.tw)
1 Introduction
Polar mesosphere summer echoes (PMSE, termed by R¨ottger et al., 1988) are intense radar echoes that occur only during the summer period (from the mid-May to the mid-August) near the height of mesopause in the polar region (Ecklund and Balsley, 1981). Similar radar echoes can also be seen at mid latitude (termed as MSE) (e.g. Czechowsky et al., 1979; Reid et al., 1989), which are sparser than the PMSE. Both PMSE and MSE were observed mainly at VHF band and at the Northern Hemisphere, although Woodman et al. (1999) showed the first observation in Antarctica. Inhomogeneity in electron density is commonly believed to be the cause of the PMSE/MSE, which are related to the charged particles and extremely low temperature in mesopause region. Reviews of the PMSE/MSE can be found in some articles (e.g. Cho and Kelley, 1993; Cho and R¨ottger, 1997).
COL6
SA3 SA6
COL5
COL4
SA2 SA5 E
COL3
COL2
SA1 SA4
COL1
ROW1 ROW2 ROW3 ROW4 ROW5 ROW6
Fig. 1.Configuration of OSWIN VHF radar (54.1◦N and 11.8◦E). The antenna array consists of 144 Yagi antennas (presented by short-slash lines) and can be divided into six subarrays (24 Yagis for each) for transmission and reception of SA and DBS observa-tions. The DBS operation contains two modes: COL and ROW. The antennas in each subarray are arranged as 6×4, 12×2, and 2×12 for the SA, COL, and ROW modes.
Table 1.Radar parameters used in observation.
Sampling resolution 300 m Coherent integration 5 Sampling time ∼0.015 s Range height 74 km–98 km
Acquisition sequence SA, COL(vertical, north, south); ROW (vertical, east, west); 7◦off-zenith for oblique beam;
∼16 s for each operational mode
the height range of 70 km and 90 km also showed a depen-dency of aspect sensitivity on altitude, in which larger aspect sensitivity was observed in the lower range (Lesicar et al., 1994; Vandepeer and Reid, 1995). These results have en-couraged further investigation of aspect sensitivity at meso-spheric height by means of various methods. For example, Chilson et al. (2002) measured the aspect sensitivity of the PMSE using the technique of coherent radar imaging (CRI) and showed the same height-dependent aspect sensitivity and its relationship with wave dynamics.
The CRI is an improved technique of spatial domain radar interferometry (RI or SDI). With multiple receivers (more than three) and sophisticated algorithms, the CRI can resolve multiple scattering centers in the radar scattering volume, which is not possible to achieve just using three receiving channels and traditional procedures of radar interferometry. The information of multiple scattering centers can be of great use to understand the scattering mechanisms and dynamics
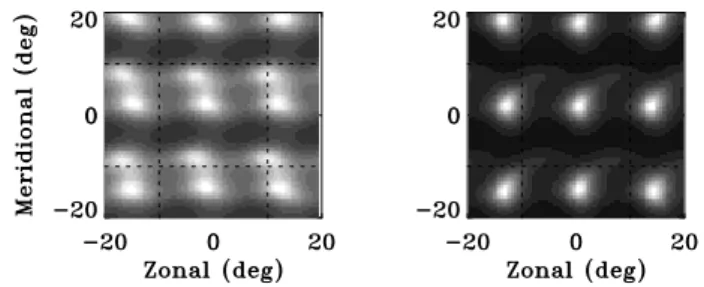
Fig. 2.Two maps of brightness distribution resulted from the CRI-Capon’s method.
of some phenomena, such as the PMSE in the atmosphere (Yu et al., 2001). In this study, we were interested in find-ing the relationship between aspect sensitivity, wave activ-ity, and multiple scattering centers for the PMSE/MSE. An MSE layer, which was observed by the OSWIN VHF radar on 15 July 2000, was examined in the study. More examina-tions are expected in the future. Radar facility and CRI tech-nique are described briefly in Sect. 2. Section 3 shows the observational results. Discussion and conclusions are given in Sects. 4 and 5, respectively.
2 Radar facility and CRI technique
2.1 OSWIN VHF radar
The OSWIN VHF Radar (54.1◦N, 11.8◦E), operated at a
central frequency of 53.5 MHz, is located near the small town of K¨uhlungsborn on the northern coast of Germany. The an-tenna array consists of 144 four-element Yagi anan-tennas or-dered in a squared grid (12×12) and can be divided into six subarrays for transmission and reception (Fig. 1). Six transmitting/receiving channels are linked to the six subar-rays. The transmitting half-power beam width is 6◦. Both the spaced antenna (SA) and Doppler beam swinging (DBS) operations are available. In the SA operation, the radar beam is vertical and each subarray consists of 4×6 Yagis. On the other hand, the array for the DBS operation is divided into six sections in north-south (12×2 Yagis for each) or east-west (2×12 Yagis for each) directions, which are distinguished into COL (column) and ROW (row) modes, respectively. Moreover, the radar beam used for the DBS operation can be steered to east and west in off-zenith angles of 7◦, 14◦,
and 21◦ (ROW mode), and to north and south in off-zenith
J.-S. Chen et al.: Study of mesosphere summer echoes using coherent radar imaging 809
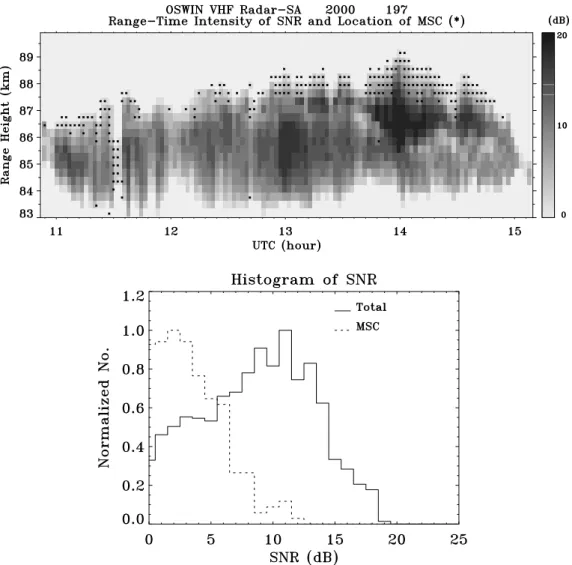
Fig. 3.Upper panel: height-time intensity plot of signal-to-noise ratio (SNR) of the MSE layer, with a 2-s time resolution (128 points) and for the SA data. Asterisks show the locations of the multiple-scattering-center events. Lower panel: histograms of SNR for all MSE echoes (solid line) and for MSC events (dashed line).
2.2 Coherent Radar Imaging (CRI)
The CRI technique was applied to the atmosphere in the early 1990 (Kudeki and S¨ur¨uc¨u, 1991). Some sophisticated algo-rithms, such as maximum entropy (Hysell, 1996; Hysell and Woodman, 1997), Capon’s method (e.g. Palmer et al., 1998), MUSIC (Multiple-Signal Classification) algorithm (H´elal et al., 2001), and Gaussian-blob fitting (Chau and Woodman, 2001), have demonstrated the superior ability of the CRI technique in revealing the structure of scattering media in the radar volume. Excellent descriptions/reviews of the CRI can be found in many papers (e.g. Yu et al., 2000; Chau and Woodman, 2001; and H´elal et al., 2001). In brief, the pur-pose of the CRI is to find the average signal power density (termed as brightness distribution) as a function of angle and Doppler shift from the signals received by spatially separated receivers. To this end, an appropriate weighting function vec-tor is introduced onto the signals received by different re-ceivers to form a synthesized beam. By changing the scan-ning direction in the weighting function vector, the angular direction of the synthesized beam varies as well. Among the above high-resolution algorithms, Capon’s method (Capon,
1969) was demonstrated to consume less time but still result in excellent brightness function (Yu et al., 2000). In view of this, Capon’s method was utilized in this study. Mathemat-ically, Capon’s method is obtained from the optimally con-strained approach; for the details of this method, see Palmer et al. (1998). The final equation for estimating the brightness value is
B(k, f )= 1
e+V−1e, (1)
where B is the brightness function, k is the wave num-ber vector in the direction where the radar beam is steered, k=(2π/λ)[sinθsinϕ sinθcosϕ cosθ], λ is the radar wavelength andθandϕare, respectively, the zenith and az-imuth angles of the steered radar beam,f is the Doppler fre-quency, the symbols of + and−1 represent Hermitian opera-tor and inverse of matrix, respectively. MatriceseandVhave the following forms:
Fig. 4.Same as Fig. 3, but with a 16-s time resolution (1024 points).
V(f )=
V11(f )V12(f )...V1n(f )
V21(f )V22(f )...V2n(f )
· · · ·
· · · ·
Vn1(f )Vn2(f )...Vnn(f )
, (2)
where D is the position vector of receiver antenna, upper index T is the transpose operator, Vis a visibility matrix defined by the visibility functionVij, whereVijis the
cross-correlation function of the signals received by receiversiand j. Notice that(1)and(2)deal with the brightness for each Doppler frequency. We can also estimate the brightness dis-tribution with the following equation
B(k)= 1
e+R−1e, (3)
where R is the matrix having the similar form as (2) but is composed of the cross-correlation functions of signals in time domain. No matter whetherRor Vis used, only the cross-correlation value at zero time lag is needed; (3) was employed in this study.
Once the brightness distribution as the function of angle is obtained, a two-dimensional Gaussian function can be used to fit the brightness distribution to find the mean angle of arrival of the echoes. We can also obtain the width of the brightness distribution by means of the deviation of the fit-ted Gaussian function. However, such fitting usually fails for the situation of multiple scattering centers. This shortcom-ing, nevertheless, becomes beneficial for the examination of single-scattering-center event, due to the exclusion of the sit-uation of multiple scattering centers in the fitting. To find the situation of multiple scattering centers, we used another approach that is presented in the next section.
J.-S. Chen et al.: Study of mesosphere summer echoes using coherent radar imaging 811
Fig. 5.Same as Fig. 3, but with a 16-s time resolution and for the ROW data (1024 points).
3 Observational results
3.1 Multiple-scattering-center event (MSC)
The procedure using a two-dimensional Gaussian function to fit the brightness distribution is obviously not available to find the multiple-scattering-center event (MSC). Chau and Woodman (2001) implemented a fitting technique using a number of anisotropic Gaussian blobs. Nevertheless, a di-rect investigation of the map of brightness distribution is no doubt a more reliable manner for our present study. More-over, the grating pattern, which depends on the configuration and baseline length of receiver antennas (Yu et al., 2000), should be recognized in determining the number of scattering centers from the brightness map. Figure 2 exhibits two typ-ical examples of brightness maps. The right panel of Fig. 2 shows a grating pattern with nine brightness centers within the angular region of±20◦, in which the central one is the true scattering center. The other case shown in the left panel of Fig. 2 is a two-blob pattern that repeats at different an-gular locations. Obviously, this is an MSC event (two scat-tering centers). In this way, we are able to find the MSC event. We implemented the above investigation for the data
Fig. 6.Scatter plots of echo power (EP) versus spectrum width (SW) for the data set shown in Fig. 3.
distribution. Nevertheless, the angular resolution in the re-solvable dimension is higher than that of SA mode. Figure 5 shows the result of ROW mode. As seen, the occurrences of MSC events were similar to those shown in Fig. 4. For the COL-mode data, same characteristic was also observed (not shown). Since the three observational modes show the same results, the MSC events observed were likely true. As for the differences between the occurrences of MSC events for short and long integration times, it will be discussed in Sect. 4.
3.2 Aspect sensitivity
There have been many methods that can examine the as-pect sensitivity of atmospheric irregularities, for example, comparison between echo power and spectrum width, and comparison between echo powers of vertical and oblique beams. Note that the latter method was applied to disclose the height-dependent aspect sensitivity of the PMSE/MSE (e.g. Czechowsky et al., 1988; Huaman and Balsley, 1998). Although the two methods are simple, they can give a sketch of aspect sensitivity of the refractivity irregularities.
3.2.1 Comparison between echo power and spectrum width
J.-S. Chen et al.: Study of mesosphere summer echoes using coherent radar imaging 813
Fig. 7.Histograms of echo power differences between the vertical and northern beams (left panel), the vertical and southern beams (middle panel), and the northern and southern beams (right panel), respectively, for the data set shown in Fig. 3.
literature, Blix (1999) categorized the two relationships as type I (direct correlation) and type II (inverse relationship), respectively. We continue using this classification in this pa-per. Figure 6 shows the scatter diagram of echo power versus spectrum width for each range gate. As seen, the scatter fea-ture varied with height. In the upper region, both types I and II can be seen clearly. In contrast, it is difficult to catego-rize the relationship between 84.2 km and 85.4 km due to an intermixture of the two types of relationships. In the region
J.-S. Chen et al.: Study of mesosphere summer echoes using coherent radar imaging 815 3.2.2 Comparison between the echo powers of vertical and
oblique beams
The three panels in Fig. 7 display the histograms of the echo power differences between the vertical and northern beams, the vertical and southern beams, and the northern and south-ern beams, respectively, for each sampling gate. One can ob-serve from the left two panels that the vertical echo powers were mostly larger than the oblique ones in the lower height but were smaller than those in the upper height, in which the height≈86.6 km can be the division. This feature indicates dissimilar echo structures between lower and upper portions of the echo layer. On the other hand, the histograms of the echo power difference between the northern and southern beams for each sampling gate, as shown in the right panel, were almost symmetric to zero value. This suggests that the echo structures seen by the two oblique beams, which were tilted symmetrically in the northern and southern directions, were similar. The feature that the predominance of vertical echo power decreases with height indicates that aspect sen-sitivity was enhanced in the lower portion of the echo layer and decreased with height. Note that this height-dependent characteristic of aspect sensitivity is in agreement with the mean behaviour of aspect sensitivity obtained from three-season data (Zecha et al., 2003). An interesting phenomenon in Fig. 7 is that the vertical echo powers were smaller than the oblique ones for the upper portion of the layer, which cannot be explained by pure isotropic structure. We will discuss this in more detail in the next section.
Same comparisons as Fig. 7 were also made for the verti-cal and eastern beams, vertiverti-cal and western beam, and east-ern and westeast-ern beams. The histograms (not shown) are sim-ilar to those of Fig. 7.
4 Discussion
The MSC events in the lower portion of the echo layer shown in Fig. 3 disappeared mostly when a longer integration time was used (as shown in Fig. 4). This feature can be explained by the fact that the scattering center in a long integration time is usually the average result of the echoes scattered/reflected from the whole irregular structure, while individual scatter-ing points in the irregular structure may be observed within a short time period. In contrast, the MSC events in the upper portion of the echo layer occurred almost continuously in the time domain, even though the integration time of estimation changed from 2 s (Fig. 3) to 16 s (Fig. 4), which points out a remarkable MSC structure. The interest is now turned to the cause of this MSC structure.
As mentioned, the vertical echo powers were mostly smaller than the oblique ones in the height range with many MSC events. This feature is difficult to explain with a pure isotropic structure. However, a tilted structure (layer or anisotropic irregularity) could be one potential cause. If the tilt angle of the structure is close to the off-zenith angle of the oblique beam, it is possible for the oblique beam to
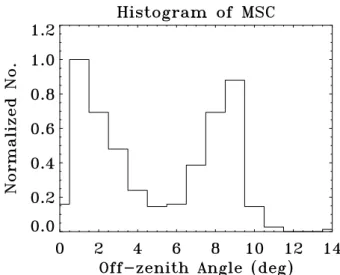
re-Fig. 9.Histogram of scattering centers for the multiple-scattering-center events.
ceive a stronger echo than the vertical beam. The question arises as to which mechanism tilts the echo structure. Wave activity, which can tilt the layer/anisotropic irregularity, can be a candidate. Because the off-zenith angle of the oblique beam is 7◦, the tilt angle of the layer/anisotropic irregular-ity shall also be several degrees. This means the waves with short-horizontal wavelengths and observable amplitudes are preferable to cause such a tilted structure. Yu et al. (2001) made a CRI simulation and demonstrated that short-wave ac-tivities, say, with a 20 km horizontal wavelength and 200 m amplitude, can cause the MSC event. Our observation is in agreement with such a simulation result.
fitting neglects the MSC events. As seen in Fig. 8, the scat-tering centers at the upper edge of the echo layer had larger off-zenith angles than others in the lower part of the layer and furthermore, varied violently. Also observed was the wave-like variation of the scattering center occurring just below the upper edge. The period of variation was about tens of min-utes. Based on these observations, the echoes in the upper portion of the MSE layer seem to come from the direction of a fairly large off-zenith angle, and such a result could be closely related to the short-wave activities.
To find more information about the echo structure, we also examined the MSC events. For the data observed by 16 s SA mode, the two-scattering-center event was only found. How-ever, the cases with three and four scattering centers were often seen in the data of ROW and COL modes. This differ-ence should be due to the coarser spatial resolution of the SA mode (2×3 configuration) than the ROW/COL mode (6×1 or 1×6 configuration). However, the SA-mode data were used here because they can provide two-dimensional angle of scattering center. We measured the off-zenith angle of scattering center directly from the map of brightness dis-tribution (as those shown in Fig. 2). A resultant histogram of scattering centers is shown in Fig. 9. Amazingly, the off-zenith angles were grouped into two locations: one was close to the zenith and the other was around 8◦far away the zenith. Although not very precise, the 8◦group suggests that the tilt angle of the echo structure may be close to the pointing direc-tion of the oblique beam (7◦off zenith), causing the stronger
echo received by the oblique beam while the weaker echo is received by the vertical beam. We can perform a simple estimation, as follows, to validate the large tilt angle of the layer caused by short-wave activities. Inspection of Fig. 8 found that in the upper portion the period of variation in the scattering center was about tens of minutes. This indicates that the oscillation period of the wave motion was also about tens of minutes. Inspecting the vertical velocity field (not shown) of the present data set, the vertical motions with sev-eral meters per second were often found, which are in agree-ment with the observations published in the literature (e.g. Hoppe and Fritts, 1995; Fritts and Hoppe, 1995). By assum-ing a wave motion with a 20-min oscillation period and 4-m/s vertical velocity amplitude, one can estimate a vertical ex-cursion≈1.5 km by integrating 4 sin(π t /600)fromt=0 s to 600 s (600 s is the half period of the wave motion). Assuming that the wave motion has a horizontal wavelength of 20 km, then the tilt layer caused by the wave motion will have a tilt angle of tan−1(1.5 km/10 km) or approximately 8.5◦. This comes out in rather good agreement with Fig. 9.
Finally, after the observation that the MSC events come with the coexistence of the echoes from isotropic and highly anisotropic irregularities, it is natural to draw a conclusion for this case that short-wave activities not only tilted the echo structures but also caused turbulent irregularities.
In this study the multiple-scattering-center (MSC) events were examined using the technique of coherent radar imag-ing (CRI). In the case study, many MSC events were found to occur in the upper portion of the MSE layer. In the upper re-gion it was also found that (1) both echoes from isotropic and anisotropic irregularities coexisted, (2) the echoes of-ten came from the direction of a large off-zenith angle, (3) the echo power of vertical beam was usually smaller than that of oblique beam, and (4) there were observable short-wave activities. These features indicate that (a) the MSC events might result from the slanted layer/anisotropic struc-tures tilted by short-wave activities, (b) the tilt angle of the layer/anisotropic structure might be close to the off-zenith angle (7◦) of the oblique beam, causing the echo power re-ceived by the oblique beam to be larger than or comparable to that received by the vertical beam, (c) short-wave activ-ities not only tilted the layer/anisotropic structures but also induced isotropic irregularities. Conclusions (b) and (c) can explain the characteristic of less aspect sensitivity in the up-per portion of the echo layer.
More investigations of the MSE/PMSE using the CRI technique are worth carrying out in the future, which will verify the results presented in this paper. The examination can focus on the MSC events and their relationship to the echo structures associated with short-wave activities.
Acknowledgements. J.-S. Chen was supported by the Ministry of Education of the Republic of China (Taiwan) and the Leibniz-Institut f¨ur Atmosph¨arenphysik (IAP) at K¨uhlungsborn of Germany for his stay in Germany. J.-S. Chen thanks the National Science Council of the Republic of China for continuing research on this topic under the grand NSC91-2111-M-270-001. Moreover, the au-thors wish to thank D. Keuer and H. Bardey for assistance in oper-ating the OSWIN VHF radar at K¨uhlungsborn, and W. Singer and J. Bremer for stimulating discussion. Topical Editor U.-P. Hoppe thanks two referees for their help in evaluating this paper.
References
Blix, T. A.: Small scale plasma and charged aerosol variations and their importance for polar mesosphere summer echoes, Adv. Space Res., 24, 537–546, 1999.
Capon, J.: High-resolution frequency-wavenumber spectrum anal-ysis, Proc. IEEE, 57, 1408–1419, 1969.
Chau, J. L and Woodman, R. F.: Three-dimensional coherent radar imaging at Jicamaca: comparison of different inversion tech-nique, J. Atmos. Terr. Phys., 63, 253–261, 2001.
Chen, J.-S., R¨ottger, J., and Chu, Y.-H.: System Phase calibration of VHF spaced antennas using the echoes of aircraft incorporat-ing with frequency domain interferometry technique, Radio Sci., Vol. 37, No. 5, 2002.
J.-S. Chen et al.: Study of mesosphere summer echoes using coherent radar imaging 817
Cho, J. Y. N. and Kelley, M. C.: Polar mesosphere summer echoes: Observations and current theories, Rev. Geophys., 31, 243–256, 1993.
Cho, J. Y. N., and R¨ottger, J.: An updated review of polar meso-sphere summer echoes: Observations, theory and their relation-ship to noctilucent clouds and subvisible aerosols, J. Geophys. Res., 102, 2001–2020, 1997.
Czechowsky, P., R. R¨uster, and G. Schmidt, Variations of meso-spheric structures in different seasons, Geophys. Res. Lett., 6, 459–462, 1979.
Czechowsky, P., Reid, I. M., and Rster, R.: VHF radar measure-ments of the aspect sensitivity of the summer polar mesopause over Andenes (69◦N, 16◦E) Norway, Geophys. Res. Lett., 15, 1259–1262, 1988.
Czechowsky, P., and R¨uster, R.: VHF radar observations of turbu-lent structures in the polar mesopause region, Ann. Geophys., 15, 1028–1036, 1997.
Ecklund, W. L. and Balsley, B. B.: Long-term observations of the arctic mesosphere with the MST radar at Poker Flat, Alaska, J. Geophys. Res., 86, 7775–7780, 1981.
Fritts, D. C. and Hoppe, U.-P.: High-resolution measurements of vertical velocity with the european incoherent scatter VHF radar, 2, spectral observations and model comparisons, J. Geophys. Res., 100, 16 827–16 838, 1995.
Fukao, S., Sato, T., Harper, R. M., and Kato, S.: Radio wave scat-tering from the tropical mesosphere observed with the Jicamaca radar, Radio Sci., 15, 447–457, 1980.
Gage, K. S. and Green, J. L.: Evidence for specular reflection from monostatic VHF radar observations of the stratosphere, Radio Sci., 13, 991–1001, 1978.
H´elal, M. C., Luce, H., and Spano, E.: Radar imaging and high-resolution array processing applied to a classical VHF-ST pro-filer, J. Atmos. Solar-Terr. Phys., 63, 263–274, 2001.
Hocking, W. K.: The spaced antenna drift method, Handbook for MAP, vol. 9, 171–186, SCOSTEP Secr., Univ. of Ill., Urbana, 1983.
Hoppe, U.-P., Fritts, D. C., Reid, I. M., Czechowsky, P., Hall, C., and Hansen, T. L.: Multiple-frequency studies of the high-latitude summer mesosphere: Implication for scattering pro-cesses, J. Atmos. Terr. Phys., 52, 907–926, 1990.
Hoppe, U.-P. and Fritts, D. C.: High-resolution measurements of vertical velocity with the European incoherent scatter VHF radar, 1. Motion field characteristics and measurement biases, J. Geo-phys. Res., 100, 16 813–16 825, 1995.
Hooper, D. A. and Thomas, L.: The small-scale structure of VHF mesospheric summer echo layers observed at mid-latitudes, Ann. Geophys., 15, 1037–1047, 1997.
Huaman, M. M. and Balsley, B. B.: Long-term-mean aspect sen-sitivity of PMSE determined from poker flat MST radar data, Geophys. Res. Lett., 25, 947–950, 1998.
Hysell, D. L.: Radar imaging of equatorial F region irregularities with maximum entropy interferometry, Radio Sci., 31, 1567– 1578, 1996.
Hysell, D. L. and Woodman, R. F.: Imaging coherent backscatter radar observations of topside equatorial spread F, Radio Sci., 32, 2309–2320, 1997.
Kudeki, E. and S¨ur¨uc¨u, F.: Radar interferometric imaging of field-aligned plasma irregularities in the equatorial electrojet, Geo-phys. Res. Lett., 18, 41–44, 1991.
Latteck, R., Singer, W., and H¨offner, J.: Mesosphere summer echoes as observed by VHF radar at K¨uhlungsborn (54◦N), Geo-phys. Res. Lett., 26, 1533–1536, 1999.
Lesicar, D., Hocking, W. K., and Vincent, R. A.: Comparative stud-ies of scatterers observed by MF radars in the southern hemi-sphere mesohemi-sphere, J. Atmos. Terr. Phys., 56, 581–591, 1994. Nastrom, G. D. and Eaton, F. D.: Turbulence eddy dissipation rates
from radar observations at 5–20 km at white sand missile range, NM, J. Geophys. Res., 102, 19 495–19 505, 1997.
Palmer, R. D., Gopalam, S., Yu, T.-Y., and Fukao, S.: Coherent radar imaging using capon’s method, Radio Sci., 33, 1585–1598, 1998.
Reid, I. M., Czechowsky, P., R¨uster, R., and Schmidt, G.: First VHF radar measurements of mesopause summer echoes at mid-latitudes, Geophys. Res. Lett., 16, 135–138, 1989.
R¨ottger, J. and Vincent, R. A.: VHF radar studies of tropospheric velocities and irregularities using spaced antenna technique, Geophys. Res. Lett., 5, 917–920, 1978.
R¨ottger, J., La Hoz, C., Kelly, M. C., Hoppe, U. P., and Hall, C.: The structure and dynamics of polar mesosphere summer echoes observed with the EISCAT 224 MHz radar, Geophys. Res. Lett., 15, 1353–1356, 1988.
R¨ottger, J. and La Hoz, C.: Characteristics of polar mesosphere summer echoes (PMSE) observed with the EISCAT 224 MHz radar and possible explanations of their origin, J. Atmos. Terr. Phys., 52, 893–906, 1990.
Thomas, L., Astin, I., and Prichard, T.: The characteristics of VHF echoes from the summer mesopause region at mid-latitudes, J. Atmos. Terr. Phys., 54, 969–977, 1992.
Thomas, L. and Astin, I.: The form of metre-scale turbulence at mesopause heights in summer, J. Atmos. Terr. Phys., 56, 467– 478, 1994.
Vandepeer, B. G. W. and Reid, I. M.: Some preliminary results ob-tained with the new adelaide MF doppler radar, Radio Sci., 30, 1191–1203, 1995.
Woodman, R. F., Balsley, B. B., Aquino, F., Flores, L., Vazquez, E., Sarango, M., Huaman, M., and Soldi, H.: First observations of polar mesosphere summer echoes in Antarctica, J. Geophys. Res., 104, 22 577–22 590, 1999.
Yu, T.-Y., Palmer, R. D., and Hysell, D. L.: A simulation study of coherent radar imaging, Radio Sci., 35, 1129–1141, 2000. Yu, T.-Y., Palmer, R. D., and Chilson, P. B.: An investigation of
scattering mechanisms and dynamics in PMSE using coherent radar imaging, J. Atmos. Sol., Terr. Phys., 63, 1797–1810, 2001. Zecha, M., R¨ottger, J., Singer, W., Hoffmann, P., and Keuer, D.: Scattering properties of PMSE irregularities and refinements of velocity estimates, J. Atmos. Sol., Terr. Phys., 63, 201–214, 2001.