A Regression Approach for Forecasting
Vendor Revenue in Telecommunication
Industries
Aida Mustapha *1, Farhana M. Fadzil #2
* Faculty of Computer Science and Information Technology,
Universiti Tun Hussein Onn Malaysia, 86400 Parit Raja, Batu Pahat, Malaysia. 2 [email protected]
# Faculty of Computer Science and Information Technology, Universiti Putra Malaysia, 43400 UPM Serdang, Selangor, Malaysia.
Abstract—In many telecommunication companies, Entrepreneur Development Unit (EDU) is responsible to manage a big group of vendors that hold contract with the company. This unit assesses the vendors’ performance in terms of revenue and profitability on yearly basis and uses the information in arranging suitable development trainings. The main challenge faced by this unit, however, is to obtain the annual revenue data from the vendors due to time constraints. This paper presents a regression approach to predict the vendors’ annual revenues based on their previous records so the assessment exercise could be expedited. Three regression methods were investigated; linear regression, sequential minimal optimization algorithm, and M5rules. The results were analysed and discussed.
Keyword- Linear Regression, Sequential Minimal Optimization Algorithm, M5rules I. INTRODUCTION
In telecommunication industries, companies have to strategize in developing successful contractors because they represent the company’s reputation. One common strategy is by monitoring the vendor’s achievement based on their revenues and profitability. The company, in turn, will plan remedial actions for cases of non-performance or under-non-performance. Managing a big group of vendors is not without challenge. Reporting has always been the hindering block because it is a time-consuming manual affair. To expedite the planning process, a data mining approach is proposed to predict the revenues for current year based on the availability of revenue data from previous years. This will complement the tedious exercise of chasing figures from the vendors.
Among many data mining techniques such as the classification, rule mining, sequential pattern discovery, clustering, and anomaly detection, a prediction technique is most suitable for this very task. In the past, Kotsiantis [1] attempted to predict the students’ placement from 354 Hellenic Open University (HOU) student records. The research applied three algorithms, which were Linear Regression, Sequential Minimal Optimization Algorithm and M5rules. From these algorithms, the research concluded that M5rules had the highest performance in predicting students’ performance with the lowest mean absolute error. Following [1], this paper is also set to predict the vendors’ revenue for the current year of 2014 using the same regression algorithms.
The remaining of this paper is organized as follows. Section II presents three regression methods that will be used in this research, which are Linear Regression, Sequential Minimal Optimization Algorithm (SMOReg) and M5rules. Section III presents the experimental setup, including the dataset. Section IV discusses the results and finally Section V concludes the research.
II. REGRESSION METHODS
Regression analysis is a data mining technique that is used to extract models for predicting numbers. It predicts a certain numerical outcome based on a set of given input. One common example is to predict house value based on location, number of rooms, lot size, and other factors. In this research, the revenue for current year is predicted based on revenues from previous years. Following [1], the regression algorithms under study include the Linear Regression, Sequential Minimal Optimization Algorithm, and M5rules.
A. Linear Regression
Linear regression is the simplest yet powerful algorithm for predicting values of a variable from the existing values of another variable. There are two lines of regression (X and Y). The formulae for this algorithm is represented by Y = a + bX where a (coefficient) and b (constant value) are known as intercept and slope of the equation, respectively. They are used to predict the new value of variable Y when value of variable X is known as shown in Equation 1.
where
= ∑∑ − ∑ ∑− ∑
and
=∑ − ∑
B. Sequential Minimal Optimization Algorithm for Regression (SMOReg)
Sequential Minimal Optimization Algorithm for Regression is an effective method for training support vector machines (SVMs) on classification tasks as well as regression problems. The formula for this algorithm is shown in Equation 2.
, + (2)
C. M5Rules
M5Rules algorithm produces propositional regression rules in IF-THEN rule format using routines for generating a decision list from M5Model trees [3]. The algorithm is able to deal with both continuous and nominal variables, and obtains a linear model of the data. The models created by M5 are multivariate linear models. M5Rules algorithm generates a decision list for regression problems using divide-and-conquer. This technique identifies a rule that covers instances in the class, separate them and continues with those that are left.
III. EXPERIMENTS
This paper attempted to assess the best regression algorithm in predicting the vendors’ revenue for the year 2014. The result will help EDU to formulate a plan for the vendor development. All three regression algorithms; Linear Regression, Sequential Minimal Optimization Algorithm (SMOReg) and M5rules were executed using an open source software tool, which is the Waikato Environment for Knowledge Analysis (WEKA) [2].
A. Dataset
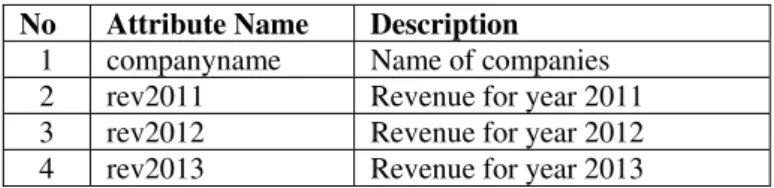
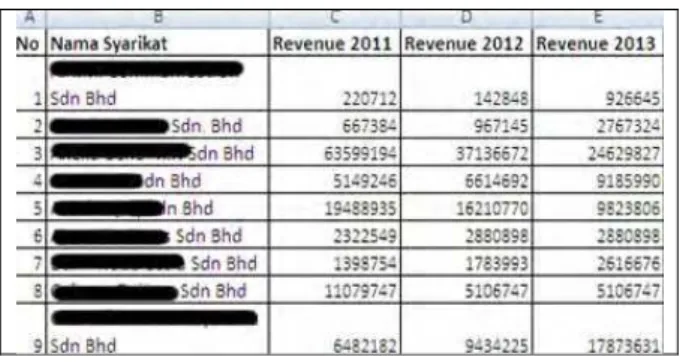
In this study, data were sourced from the vendor database in a telecommunication company that covers financial records from 2011 until 2013. A total of 527 instances of vendors’ records have been extracted from Vendor table. The original table consists of 13 attributes. Some of the unnecessary attribute have been removed during pre-processing stage. The final set of attributes is shown in Table I.
B. Data Pre-processing
Before pre-processing, the raw data were incomplete, inconsistent, and contain many errors. In this research, the first step executed was data cleaning, whereby data is cleansed by smoothing the noisy data, resolving the inconsistencies in the data, and filling in missing values. A number of attributes such as contact person, identification number, position, address, state and other unnecessary attributes were removed during data reduction step in pre-processing.
TABLE I Dataset Attributes
No Attribute Name Description 1 companyname Name of companies 2 rev2011 Revenue for year 2011 3 rev2012 Revenue for year 2012 4 rev2013 Revenue for year 2013
Fig. 1. Actual dataset after pre-processing
C. Comparison Criteria
The comparison of results was made on the basis of the following criteria:
1) Correlation Coefficient (CC): Thisindicates the relationship between independent variables of power and direction. The value should be between -1 and +1. The positive value means a direct directional relation and the negative values means a reverse directional relation. If the CC value is zero it indicates that there isn’t any relationship between variables. The formula is shown in Equation 3.
=
=∑ − ̅− 1 −
=∑ − 1− ̅
=∑ − 1−
(3)
2) Mean Absolute Error (MAE): This is the average of the difference between predicted and actual value in all test cases [3]. The formula for calculating MAE is shown in Equation 4, assuming the actual output is a and the expected output is c.
| − | + | − | + ⋯ + | − | (4)
3) Root Mean Squared Error (RMSE): Thisis used to measure the differences between values predicted by a model and the actual values [3]. It is just the square root of the mean square error as shown in Equation 5.
− + − + ⋯ + − (5)
For numerical prediction, RMSE is one of the most commonly used measures. The result is produced by calculating the average of the squared differences between each computed value and its corresponding correct value. The RMSE is simply the square root of the mean squared error. It gives the error value the same dimensionality as the actual and predicted values. In the experiments, both MAE and RMSE were calculated for each regression algorithm. If MSE and RMSE values are close to zero, error rate becomes the minimum. However, for each case study, acceptable error rates of MSE or RMSE are different.
IV. RESULTS AND DISCUSSIONS
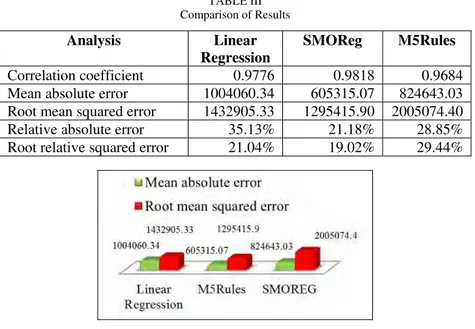
TABLE III Comparison of Results
Analysis Linear Regression
SMOReg M5Rules
Correlation coefficient 0.9776 0.9818 0.9684 Mean absolute error 1004060.34 605315.07 824643.03 Root mean squared error 1432905.33 1295415.90 2005074.40 Relative absolute error 35.13% 21.18% 28.85% Root relative squared error 21.04% 19.02% 29.44%
Fig. 2. Results comparison
The regression line resulted from the Linear Regression will always contain error because independent variables are never perfect predictors of the dependent variables. There are many uncontrollable factors that might affect the results. The visualization views for all three algorithms are presented in Fig. 3(a) – 3(c).
In addition, to prove that M5Rules is the most appropriate algorithm to use for predicting vendors’ revenue for year 2014, the variances between the actual and predicted revenues are recorded in Table III. M5Rules is able to deal with both continuous and nominal variables, and obtains a linear model of the data [5]. From the result shown in the table, M5Rules produced the nearest value to the actual compared to Linear Regression and SMO. Hence, it is proven that M5Rules is the most appropriate algorithm for predicting the revenue 2014 compared to the other algorithms.
TABLE IIIII
Variance analysis between actual and predicted revenue
Predicted Revenue 2013 Revenu
e 2012
Revenu e 2013
Linear Regressio
n
SMOReg M5Rules
2948078 227547 7
3206347 3256752 2946437
Differences 930870 981275 670960
V. CONCLUSION
This paper analyzed vendors’ performance by using three different regression algorithms, which are Linear Regression, Sequential Minimal Optimization Algorithm (SMOReg), and M5rules. The results showed that the ability of data mining tasks in helping EDU to predict vendors’ performance and to identify groups of non-performance and under-non-performance. This will in turn help to improve their non-performance in earlier stage.
From the results of the analysis, it is proven that M5rules is the most appropriate for predicting vendors’ performance with the lowest mean absolute error and lowest relative absolute error. Further study that focuses on the criteria that affect vendors’ performance can be done in future with more relevant and better data.
REFERENCES
[1] S. B. Kotsiantis, “Use of Machine Learning Techniques for Educational Proposes: A Decision Support System for Forecasting
Students’ Grades,” Artificial Intelligence Review, vol. 37, pp. 331–344, 2012.
[2] I. H. Witten, F. Eibe, and M. A. Hall, Practical Machine Learning Tools and Techniques, Burlington: USA, 2011.
[3] H. Duggal and O. Singh, “Comparative Study of the Performance of M5-Rules Algorithm with Different Algorithms”, Journal of
Software Engineering and Applications, vol. 5, pp. 270-276, 2012.
[4] E. Osmanbegovic and M. Suljic, “Data Mining Approach for Predicting Student Performance”, Journal of Economics and Business,
vol. 10, no. 1, 2012.
[5] S. Kotsiantis, A. Kostoulas, S. Lykoudis, A. Argiriou, and K. Menagias, “Using Data Mining Techniques for Estimating Minimum,