Evaluation for Long Term PM
10Concentration Forecasting using
Multi Linear Regression (MLR) and Principal Component Regression (PCR) Models
Samsuri Abdullah a, Marzuki Ismail a, Si Yuen Fong a and Al Mahfoodh Ali Najah Ahmed b a
School of Marine Science and Environment, Universiti Malaysia Terengganu, 21030 Kuala Terengganu, Malaysia
b
Faculty of Engineering, Universiti Tenaga Nasional, 43650, Bangi, Selangor, Malaysia
Abstract
Air pollution in Peninsular Malaysia is dominated by particulate matter which is demonstrated by having the highest Air Pollution Index (API) value compared to the other pollutants at most part of the country. Particulate Matter (PM10) forecasting models development is crucial because it allows the authority and citizens of a community to take necessary actions to limit their exposure to harmful levels of particulates pollution and implement protection measures to signiicantly improve air quality on designated locations. This study aims in improving the ability of MLR using PCs inputs for PM10 concentrations forecasting. Daily observations for PM10 in Kuala Terengganu, Malaysia from January 2003 till December 2011 were utilized to forecast PM10 concentration levels. MLR and PCR (using PCs input) models were developed and the performance was evaluated using RMSE, NAE and IA. Results revealed that PCR performed better than MLR due to the implementation of PCA which reduce intricacy and eliminate data multi-collinearity.
Keywords: particulate matter; forecasting; air quality; Kuala Terengganu; Malaysia
1. Introduction
Air quality in developing country such as Malaysia has decreased gradually due to rapid urbanization, industrialization and population growth (Latif et al., 2011). Air pollution ensued from the emissions and transmission of air pollutants in the atmosphere which resulting in the ambient concentrations. Air pollution possesses threat not only to human but also to environment. Air pollution is dominated by particulate matter in Peninsular Malaysia which is proven always having the highest Air Pollution Index (API) value compared to the other pollutants such as ground level ozone (O3), carbon monoxide (CO), nitrogen dioxide (NO2) and sulphur dioxide (SO2) at most part of country. Particulate matters (PM) comprises of suspended solid and liquid elements in the air from natural and anthropogenic sources. Sea salt, windblown dust, spores and pollen are natural particulate matters whilst anthropogenic sources comprises of smoke, fumes and soot construction sites, mining operations (Dockery, 2009). Various scientiic studies have explained particle exposure as the source of numerous health problems including premature death in people with heart or lung disease, nonfatal heart attacks, irregular heartbeat, aggravated asthma, decreased lung function, and increased respiratory symptoms such as irritation of the airways, coughing, or dificulty breathing (Cadelis et al., 2014;
Correia et al., 2013; Fang et al., 2013; Atkinson et al., 2010; Meister et al., 2012; Shin, 2007).
Regression techniques had been used for a long time as forecasting tools in many fields, especially in air pollution forecasting. Regression has two main advantages; simple computation and ease of implementation (Zhang, 2003). It determines the lin-ear relationship between selected parameters, which the models established might be less accurate in forecasting complex situation. In the case of PM10, after being emitted from sources, are subjected by several factors which then made it complex in the atmosphere. The development of Principal Component Regression (PCR), which combines PCA and MLR, is one of the ways to solve this problem. In PCR, the input of the model is the resulting output of PCA which are termed as Principal Component (PCs). In each PCs, the variables are orthogonal and uncorrelated to each other. Purpose of this research is to improve the extrapolative ability of MLR by PCs inputs for PM10 concentrations forecasting. This model is very useful at the local level to gives information which allows the authority and citizens of a community to take necessary actions to limit their exposure to harmful levels of particulates pollution and implement protection measures to significantly improve air quality on designated locations.
The international journal published by the Thai Society of Higher Education Institutes on Environment
E
nvironment
A
sia
102
S. Abdullah et al. / EnvironmentAsia 9(2) (2016) 101-110
2. Materials and Methods
2.1 Study area
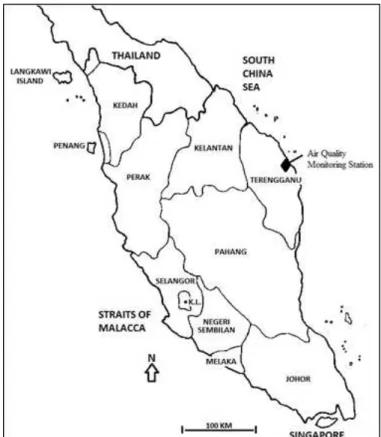
State of Terengganu is situated in the east coast of Peninsular Malaysia, adjacent to South China Sea. Air quality monitoring station for Kuala Terengganu is situated at SK Pusat Chabang Tiga (N05˚18.455’; E103˚07.213’) (Ismail et al., 2015) as shown in Fig. 1. This air quality monitoring station is primarily affected by motor vehicles emissions, particularly in morning and late afternoon whilst the meteorological condition in this region is inluence by the South West monsoon, North East monsoon and the inter monsoon seasons.
2.2 Monitoring records
Data for this study encompass of 9 consecutive years (January 200-December 2011). Particulate matter with aerodynamic diameter less than 10 μm of previous day (PM10,t-1 μg/m
3
), ambient temperature (°C), relative humidity (%), wind speed (m/s), carbon monoxide (CO, ppm), nitrogen dioxide (NO2, ppm) and suphur dioxide (SO2, ppm) are the seven daily
averaged parameters used to gain a better understanding of PM10 variability. The monitoring records were provided by the Air Quality Division, Department of Environment (DOE), Ministry of Natural Resources and Environment of Malaysia. Alam Sekitar Malaysia Sdn. Bhd (ASMA) was contracted to perform air quality monitoring in Malaysia on behalf of DOE. For PM10, β-ray attenuation mass monitor (BAM-1020) was utilized to measure its concentration (Afroz et al., 2003). Microsoft Excel Spreadsheet® was used for tabulation of data and SPSS® was utilize for data analysis. Problem in equipment during data measurement may lead to missing values (Noor and Zainudin, 2008). In this study, the missing data were just being removed as the data has less than 10% incomplete data rows (Table 1).
The deletion of observations with missing values is the common approach in handling the data (Razak
et al., 2014) as long as the minimum data capture criterion in the data is ≥ 90% completeness (maximum 10% of missing data) per year in study period (Voukantsis et al., 2011). All the data captured within each year in this study fulill this benchmark.
(N05˚18.455’; E103˚07.213’)
β (N05˚18.455’; E103˚07.213’)
Figure 1. Location of the air quality monitoring station in Kuala Terengganu, Terengganu
103
2.3. Principal Component Analysis (PCA) method
PCA is a statistical technique where it performs the transformation of a set of data that might correlate on each other to another set of data which uncorre-lated linearly by orthogonal conversion concept, which the result is known as principal components (PCs) (Abdul-Wahab et al., 2005). The number of PCs will be equal or less than the number of original parameters. In general, the result of irst PC comprises highest variance which igured that the PC has more variability in the data set.
Generally, PCA is written as (Ul-Sauie et al., 2013):
(1)
Where is the principal component and is the loading of the observed variable
2.4 Multiple Linear Regression (MLR) analysis
MLR fitting a linear equation, explaining the relationship between dependent and independent
parameters in a data set. This relationship is expressed in mathematical equation. Generally, the equation of MLR is as follows (Kovač-Andrić et al., 2009):
(2)
Where is from 1 to are coeficients of regression, are the independent parameters and is stochastic error related with the regression. Over the years, the MLR has been used in PM10 concentration forecasting as well as forecasting the ozone concentration in Malaysia, which take into account the meteorological factors and other gasses pollutants.
2.5 Principal Component Regression (PCR)
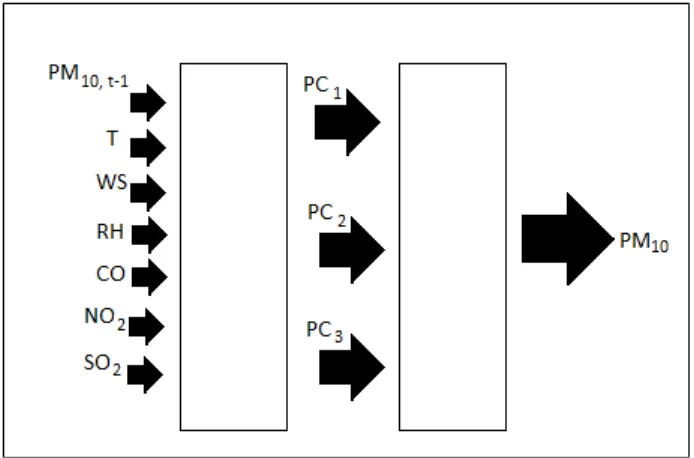
PCR is a hybrid of PCA and MLR. PCR is a statistical technique, which can reveal the inherent linear structure of a dataset and thus reduce the dimension of predicting variables. In this study, PCA was used as a feature selection method for clustering the descriptors and choosing the best group of them as input for the MLR. The architecture of this hybrid model is visualized in Fig. 2.
S. Abdullah et al. / EnvironmentAsia 9(2) (2016) 101-110
., 2014) as long as the minimum data capture criterion in the data is ≥ 90%
���=�1��� + �2� �2 + … + �����
��� ��ℎ ��� ��
Kovač Andrić
� � ∑�� �� �� ��
� � ��
��
., 2014) as long as the minimum data capture criterion in the data is ≥ 90%
��� � ��� � � � �����
ere ��� i ��ℎ ��� ��
Kovač Andrić
� � ∑�� �� �� ��
� � ��
��
., 2014) as long as the minimum data capture criterion in the data is ≥ 90%
��� �1��� + �2� � �����
��� he ��ℎpr ��� ��
Kovač Andrić
� � ∑�� �� �� ��
� � ��
��
., 2014) as long as the minimum data capture criterion in the data is ≥ 90%
��� � ��� � � � �����
��� ��ℎ and ��� ��
Kovač Andrić
� � ∑�� �� �� ��
� � ��
��
., 2014) as long as the minimum data capture criterion in the data is ≥ 90%
��� � ��� � � � �����
��� ��ℎ ��� able ��
Kovač Andrić
� � ∑�� �� �� ��
� � ��
��
., 2014) as long as the minimum data capture criterion in the data is ≥ 90%
��� � ��� � � � �����
��� ��ℎ ��� ��
Kovač Andrić
�=� ∑�� �� �� ��
ere � i � ��
�� chasti
., 2014) as long as the minimum data capture criterion in the data is ≥ 90%
��� � ��� � � � �����
��� ��ℎ ��� ��
Kovač Andrić
� � + ∑��=1�� ��+ ��
� 1 to �, bi ar ��
�� elated wit
., 2014) as long as the minimum data capture criterion in the data is ≥ 90%
��� � ��� � � � �����
��� ��ℎ ��� ��
Kovač Andrić
� � ∑�� �� �� ��
� � on,��
�� years, th
., 2014) as long as the minimum data capture criterion in the data is ≥ 90%
��� � ��� � � � �����
��� ��ℎ ��� ��
Kovač Andrić
� � ∑�� �� �� ��
� � ��
and �� concen
Table 1. The percent of incomplete data rows for all parameters at Kuala Terengganu air quality station
s
., 2014) as long as the minimum data capture criterion in the data is ≥ 90%
��� � ��� � � � �����
��� ��ℎ ��� ��
Kovač Andrić
� � ∑�� �� �� ��
� � ��
��
Figure 2. Architecture of a PCR model
ics 2003 2004 2005 2006 2007 2008 2009 2010 2011
(N05˚18.455’; E103˚07.213’)
β
Figure 2. Architecture of a PCR model
ics 2003 2004 2005 2006
Year % of incomplete data rows
2003 0.27 2004 9.84 2005 0.82 2006 0.82 2007 1.64 2008 9.29 2009 4.11 2010 3.29 2011 4.38
., 2014) as long as the minimum data capture criterion in the data is ≥ 90%
��� � ��� � � � �����
��� ��ℎ ��� ��
Kovač Andrić
� � ∑�� �� �� ��
� � ��
��
104
S. Abdullah et al. / EnvironmentAsia 9(2) (2016) 101-110
3. Results and Discussion
3.1 Statistical characteristics of PM10
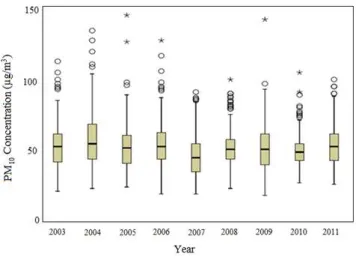
The PM10 maximum daily average concentration is in 2005 with the value of 146 μg/m3
, whilst minimum daily average is 17 μg/m3
in 2009. Table 2 summarized the descriptive statistics during the study period for PM10 concentration. Comparing the PM10 concentration graphically is best performed by constructing the boxplot (Ramli et al., 2010), and this is shown in Fig. 3. The highest mean daily concentration of PM10 was recorded in 2004 with the value of 56.34 μg/m3
(22.00 - 135.00 μg/m3
), while the lowest was in 2007 with 45.34 μg/m3 (18.00 - 91.00 μg/m3
). Malaysian national ambient air quality standards for daily 24 h average PM10 concentration is 150 μg/m3
(Department of Environment Malaysia, 2011) and all PM10 concentrations from this study were found to be within the Recommended Malaysian Air Quality Guidelines (RMAQG). However, the averaged daily concentration of PM10 exceeded the value of 50 μg/m3
imposed by European Commission for PM10, except for year 2007 (45.34 μg/m3) and year 2010 (49.27 μg/m3
). This is due to particulate emission from motor vehicles, industries and dust being released in the study area (Azmi et al., 2010).
3.2 Principal Component Analysis
The requirement for PCA is that the Kaiser- Meyer-Olkin (KMO) of Sampling Adequacy be greater than 0.50 and Bartlett’s Test of Sphericity
(<0.001) (Ul-Sauie et al., 2013). The KMO value is 0.608, greater than 0.5 for this study and therefore the PCA can be performed and Bartlett’s Test of Sphericity value is <0.001 which satisfies the requirements (Table 3).
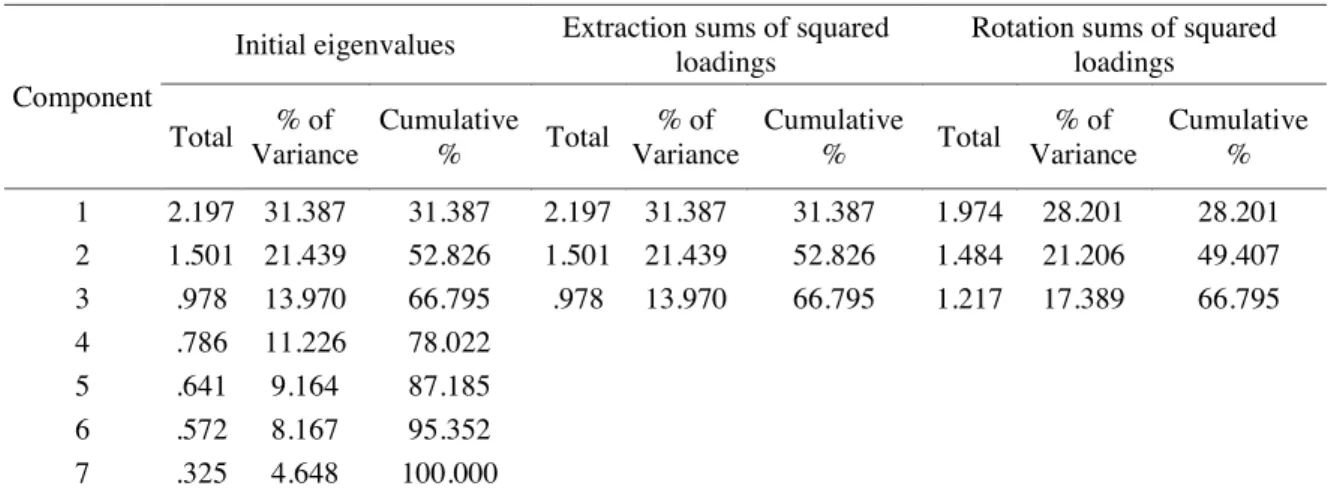
There are 7 parameters in data set before extraction process. Each parameter is explained in terms of its initial eigenvalues and its variance (percentage). The selection of PCs is based on eigenvalues (must greater than 1), but the third eigenvalue (0.978) is found to be close to 1, therefore this third PC is also selected as a factor. These three factors accounted for 66% of percentage reliability. The selected factors are equalized and the structures are optimized by rotation in the PCA. Percentage variance of Factor 1 is higher than Factor 2 and 3, with 31.39%, 21.44%, and 13.97% respectively before the extraction process, while 28.20%, 21.21%, and 17.39% respectively for the same Factor after extraction process. The eigenvalues before extraction, after extraction, and after rotation with the associated linear component is tabulated in Table 4.
Table 5 shows rotated matrix utilizing Kaiser Normalization. This matrix explains the parameters that falls onto respective PCs. The output is suppressed with values less than 0.4. The parameters consist in each PC may be positive or negative sign. PC-1 is associated with positive contribution from motor vehicles emissions (CO, NO2, PM10, t-1) and negative contributions of wind speed. Kuala Terengganu is considered as urban background and the monitoring station is located near the city. The major pollution in urban area mainly comes from the motor vehicles or trafic (Azmi et al., 2010). Thus it indicates that PC-1 is associated with local trafic sources. PC-2 is composed of PM10, t-1 in positive contribution and wind speed and negative inluences of relative humidity. The contributions of PM10, t-1 in this PC explained that there exists re-suspension of coarse particles. The re-suspension coarse particles comes mainly from street dust and road surfaces (Voukantsis et al., 2011). Chan and Kwok (2001) reported that several meteorological factors affecting the mass concentration of particulates such as
Table 2. Summary of descriptive statistic for Kuala Terengganu, Terengganu
Descriptive statistics 2003 2004 2005 2006 2007 2008 2009 2010 2011
Mean 51.77 56.34 51.97 52.93 45.34 50.74 50.77 49.27 52.41
Median 51.79 54.21 51.25 52.50 43.83 49.83 49.33 48.04 51.71
Std. Deviation 15.49 17.88 15.94 15.95 15.02 13.44 16.46 11.02 13.76
Variance 239.95 319.72 253.93 254.54 225.65 167.61 270.78 108.86 189.31
Minimum 20 22 23 18 18 22 17 26 25
105 prevailing wind direction, relative humidity, and rainfall. Wind speed and relative humidity are on the same PC because one of the biggest inluence on wind speed is relative humidity (Malaysian Meteorological Department, 2012). PC-2 expresses the specific seasonal characteristics within the data. Thus, PC-2 is known as factor of speciic seasonal characteristics. PC-3 is accounted by positive contributions of SO2 and temperature. The SO2 may come from the industrial activities or open combustion. The concentration of SO2 could also be from direct emission of motor vehicles especially lorries and buses that burns diesel oil since this study area is located near the city center of Kuala Terengganu (Dominick et al., 2012). Hence, PC-3 can be expressed as a combination of local traffic and industrial emissions.
3.3 Models development
The analysis of the air quality data and meteorological data sets are then continued by applying MLR and PCR for development of statistsical model to accurately forecast PM10
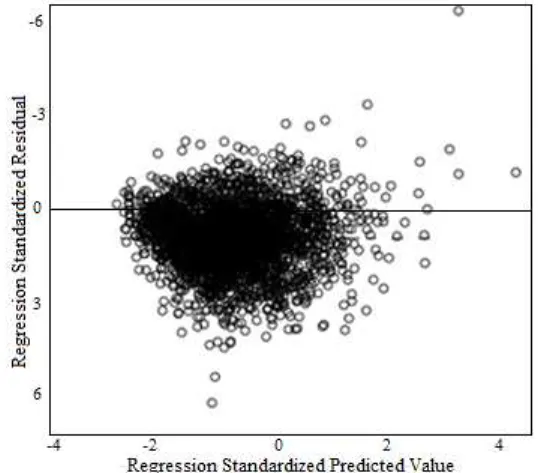
concentration. MLR and PCR models summary is depicted in Table 6. The best model for MLR is obtained with R2 (0.953), while best model for PCR with R2 (0.963) which the R2 of PCR is higher than MLR. This result is similar with previous studies performed by (Sousa et al., 2007; Ul-Sauie et al., 2013). The Variance Inlation Factor (VIF) in lieu of the independent variables for MLR (1.103 - 1.884) and PCR (1.094 - 3.916), respectively. The VIF for both models shows that the data set has no multicollinearity issue as all the values is less than 10. Furthermore, both models have no problems with irst order autocorrelation as the Durbin Watson statistic values evaluated were 1.553 (MLR) and 1.7595 (PCR), correspondingly. The acceptability of developed models is decided based on the residuals. Models are said to be not reliable if the residuals have obvious pattern.
The normal distribution of residuals with zero mean and constant variance were indicated in Figs. 4 and 5. Residuals were contained in horizontal band which indicates that the variance are constant and uncorrelated as shown in Figs. 6 and 7.
y.
re
Table 3. KMO and Bartlett’s Test
Kaiser-Meyer-Olkin Measure of Sampling Adequacy. .608
Bartlett's Test of Sphericity Approx. Chi-Square 3779.127
Df 21
Sig. .000
Figure 3. Box plots for daily PM10concentrations in Kuala Terengganu
y.
106 The predicted daily PM10 concentrations for the model derived for Kula Terengganu were plotted in Figs. 8 and 9 against the observed values to determine a goodness-of-it of the models. The regression lines showing 95% conidence interval were also drawn. Most of the points fall in the range of 95% conidence interval. Lines A and C are the upper and lower 95% conidence limit for regression model. The accuracy of the predicted model for Kuala Terengganu is 95%. PCR model performed better than MLR model with R2value of 0.963 and 0.953 respectively.
3.4 Performance comparison
Performance Indicators (PI) was utilized to determine the performance of both models. The values of error measures of Root Mean Square Error (RMSE) and Normalized Absolute Error (NAE) are smaller for PCR than MLR. The value of the accuracy measures of Index of Agreement is higher for PCR than MLR. Results from this performance error measures and accuracy measures shows that the PCR is better than MLR. Therefore, PCR provides better PM10 concentration forecasting than MLR in Kuala Terengganu. Table 7 depicted the performance indicator values.
4. Conclusions
The daily data of gaseous pollutant, i.e. SO2, NO2, CO and meteorological factors from year 2003 to 2011 were used to develop two models; one is MLR whilst the other is PCR. The original data was used for the input of MLR and running the PCA. The results of PCA comprises of 3 PCs were then used as input for developing PCR model. It was found that, PC-1 is associated with emission from motor vehicles, PC-2 associated with seasonality and PC-3 is a combination of local traffic and industrial activities. The best fitted models with R2 value for MLR (0.953) and PCR (0.963) were establish. The performance of models were compared by performance indicator of RMSE, NAE and IA. Results show that PCR model performed better for PM10 concentration forecasting at study area with lower RMSE and NAE, and higher IA rather than MLR model. Therefore, it can be concluded that the incorporation of PCA into the MLR model is very useful in reducing the number of inputs and decreased model complexity.
S. Abdullah et al. / EnvironmentAsia 9(2) (2016) 101-110
Table 4. Total variance explained
Component
Initial eigenvalues Extraction sums of squared loadings
Rotation sums of squared loadings
Total % of Variance
Cumulative
% Total
% of Variance
Cumulative
% Total
% of Variance
Cumulative %
1 2.197 31.387 31.387 2.197 31.387 31.387 1.974 28.201 28.201
2 1.501 21.439 52.826 1.501 21.439 52.826 1.484 21.206 49.407
3 .978 13.970 66.795 .978 13.970 66.795 1.217 17.389 66.795
4 .786 11.226 78.022
5 .641 9.164 87.185
6 .572 8.167 95.352
7 .325 4.648 100.000
886 736
570 644
521 537
797
Table 5. Rotated component matrix
Component
1 2 3
CO 0.886
NO2 0.736
PM10, t-1 0.570 0.644
WS -0.521 0.537
RH -0.797
T .765
107
Table 6. Summary model for PM10concentration forecasting based on original parameters and PCA as inputs
hod
-Figure 4. Standardized residual analysis of PM10 MLR
Figure 6. Testing assumption of variance and uncorrelated with mean equal to zero for MLR
Figure 5. Standardized residual analysis of PM10 PCR
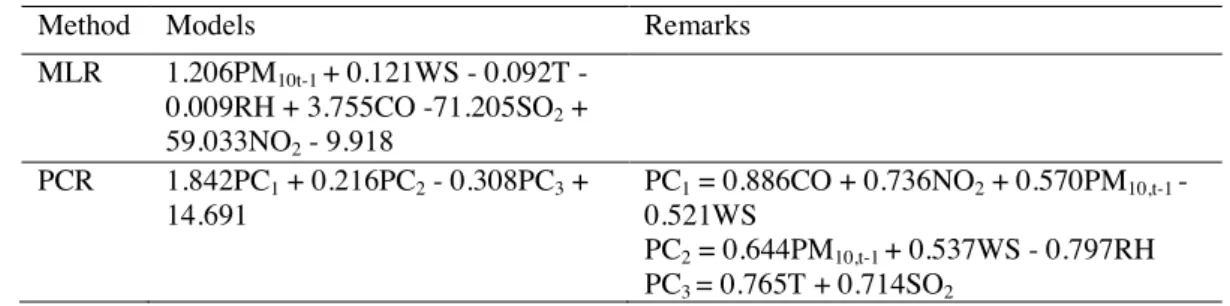
Method Models Remarks
MLR 1.206PM10t-1+ 0.121WS 0.092T -0.009RH + 3.755CO -71.205SO2+ 59.033NO2- 9.918
PCR 1.842PC1+ 0.216PC2- 0.308PC3+ 14.691
PC1= 0.886CO + 0.736NO2+ 0.570PM10,t1 -0.521WS
108
S. Abdullah et al. / EnvironmentAsia 9(2) (2016) 101-110
r
4
Table 7. Summary performance indicator between MLR and PCR models
r
4
Performance indicator MLR PCR
RMSE 2.93 2.88
NAE 0.0484 0.0429
IA 0.967 0.975
r
4
Figure 7. Testing assumption of variance and uncorrelated with mean equal to zero for PCR
Figure 8. Scatter plot of predicted PM10 concentration (μg/m 3
) against observed PM10 concentration (μg/m3) for Kuala Terengganu for MLR
109 Acknowledgments
This study was funded by Fundamental Research Grant Scheme (FRGS) FRGS/2/2013/STWN01/UMT/02/1 (VOT 59312) and Universiti Malaysia Terengganu Scholarship Scheme (BUMT). The authors also would like to thank the Air Quality Division, Malaysian Department of Environment (DOE) for the air quality data.
References
Abdul-Wahab SA, Bakheit CS, Al-Alawi SM. Principal component multiple regression analysis in modelling of ground-level ozone and factors affecting its concentrations. Environmental Modeling and Software 2005; 20(10): 1263-71.
Afroz R, Hassan MN, Ibrahim NA. Review of air p o l l u t i o n a n d h e a l t h i m p a c t s i n M a l a y s i a . Environmental Research 2003; 92(2): 71-77.
Atkinson RW, Fuller GW, Anderson HR, Harrison RM, Armstrong B. Urban ambient particle metrics and health: a time-series analysis. Epidemiology 2010; 21(4): 501-11.
Azmi SZ, Latif MT, Ismail AS, Juneng L, Jemain AA. Trend and status of air quality at three different monitoring stations in the Klang valley, Malaysia. Air Quality, Atmosphere and Health 2010; 3(1): 53-64.
Cadelis G, Tourres R, Molinie J. Short-term effects of the particulate pollutants contained in Saharan dust on the visits of children to the emergency department due to asthmatic conditions in Guadeloupe (French Archipelago of the Caribbean). PLOS ONE 2014; 9(3): e91136.
Chan LY, Kwok WS. Roadside suspended particulates at heavily traficked urban sites of Hong Kong - seasonal variation and dependence on meteorological conditions. Atmospheric Environment 2001; 35(18): 3177-82.
Correia AW, Pope III CA, Dockery DW, Wang Y, Ezzati M, Dominici F. Effect of air pollution control on life expectancy in the United States: an analysis of 545 U.S. counties for the period from 2000 to 2007. Epidemiology 2013; 24(1): 23-31.
Dockery DW. Health effects of particulate air pollution. Annals of Epidemiology 2009; 19(14): 257-63. Dominick D, Juahir H, Latif MT, Zain SM, Aris AZ. Spatial
assessment of air quality patterns in Malaysia using multivariate analysis. Atmospheric Environment 2012; 60: 172-81.
Fang Y, Naik V, Horowitz LW, Mauzerall DL. Air pollution and associated human mortality: the role of air pollutant emissions, climate change and methane concentration increases from the preindustrial period to present. Atmospheric Chemistry and Physics 2013; 13: 1377-94.
Ismail M, Abdullah S, Fong SY. Time series analysis of Particulate Matter (PM10) concentration in Kuala Terengganu of Peninsular Malaysia. International Congress on Natural Sciences and Engineering 2015; 229-42.
Kovač-Andrić E, Brana J, Gvozdić V. Impact of meteorological factors on ozone concentrations modelled by time series analysis and multivariate statistical methods. Ecological Informatics 2009; 4(2): 117-22.
Latif MT, Azmi SZ, Noor ADM, Ismail AS, Johnny Z, Idrus S, Mohamed AF, Mokhtar MB. The impact of urban growth on regional air quality surrounding the Langat River Basin, Malaysia. Environmentalist 2011; 31: 315-24.
Malaysian Meteorological Department. [homepage on the Internet]. 2012 [cited 2015 Mar 10]. Available from: http://www.met.gov.my.
Meister K, Johansson C, Forsberg B. Estimated short-term effects of coarse particles on daily mortality in S t o c k h o l m , S w e d e n . E n v i r o n m e n t a l H e a l t h Perspectives 2012; 120(3): 431-36.
Noor NM, Zainudin ML. A review: missing values in environmental data sets. Proceeding of International Conference on Environment. 2008.
Ramli NA, Ghazali NA, Yahaya AS. Diurnal luctuations of ozone concentrations and its precursors and prediction of ozone using multiple linear regressions. Malaysian Journal of Environmental Management 2010; 11(2): 57-69.
Razak NA, Zubairi YZ, Yunus RM. Imputing missing values in modelling the PM10 concentrations. Sains Malaysiana 2014; 43(10); 1599-607.
Shin DC. Health effects of ambient particulate matter. Journal of the Korean Medical Association 2007; 50(2): 175-82.
Sousa SIV, Martins FG, Alvin-Ferraz MCM, Pereira MC. Multiple linear regression and artiicial neural networks based on principal component to predict ozone concentrations. Environmental Modeling and Software 2007; 22(1): 97-103.
Ul-Sauie AZ, Yahaya AS, Ramli NA, Rosida N, Hamid HA. Future daily PM10 concentrations prediction by combining regression models and feedforward backpropagation models with principle component analysis (PCA). Atmospheric Environment 2013; 77: 621-30.
110 Zhang G.P. Time series forecasting using a hybrid
ARIMA and neural network model. Neurocomputing 2003; 50: 159-75.
Received 10 January 2016 Accepted 24 May 2016
Correspondence to
Associate Professor Dr. Marzuki Ismail School of Marine Science and Environment, Universiti Malaysia Terengganu,
21030 Kuala Terengganu, Terengganu,
Malaysia
Tel: +609 668 3548 Fax: +609 669 4669
E-mail: [email protected]