Sho
rt
R
ep
or
t
J. Braz. Chem. Soc., Vol. 21, No. 4, 760-763, 2010. Printed in Brazil - ©2010 Sociedade Brasileira de Química 0103 - 5053 $6.00+0.00
*e-mail: [email protected]
Improving the Computational Eficiency of the Successive Projections Algorithm
by using a Sequential Regression Implementation: A Case Study Involving NIR
Spectrometric Analysis of Wheat Samples
Anderson S. Soares,a Arlindo R. Galvão Filho,a Roberto K. H. Galvãoa and
Mário César U. Araújo*,b
aInstituto Tecnológico de Aeronáutica, Divisão de Engenharia Eletrônica,
12228-900 São José dos Campos-SP, Brazil
bUniversidade Federal da Paraíba, CCEN, Departamento de Química, CP 5093,
58051-970 João Pessoa-PB, Brazil
Este artigo propõe uma implementação de regressões seqüenciais para o algoritmo das projeções sucessivas (APS), que é uma técnica de seleção de variáveis para regressão linear múltipla. Para ilustração, apresenta-se um exemplo envolvendo a determinação de proteína em trigo por espectrometria no infravermelho próximo. As previsões do modelo resultante exibiram um coeiciente de correlação de 0.989 e um RMSEP (erro médio quadrático de predição) de 0.2% m/m na faixa de10.2-16.2% m/m. A implementação proposta proporcionou ganhos computacionais de até cinco vezes.
This short report proposes a sequential regression implementation for the successive projections algorithm (SPA), which is a variable selection technique for multiple linear regression. An example involving the near-infrared determination of protein in wheat is presented for illustration. The resulting model predictions exhibited a correlation coeficient of 0.989 and an RMSEP (root-mean-square error of prediction) value of 0.2% m/m in the range 10.2-16.2% m/m. The proposed implementation provided computational gains of up to ive-fold.
Keywords: successive projections algorithm, multivariate calibration, sequential regressions, computational eficiency, near-infrared spectrometry, wheat
Introduction
The successive projections algorithm (SPA) is a variable selection technique designed to minimize multicollinearity problems in multiple linear regression (MLR).1 In several
applications concerning UV-Vis,1,2 ICP-OES,3 FT-IR4 and
NIR spectrometry,4-8 SPA was found to provide models with
good predictive performance. It has also been successfully employed in other fields such as QSAR (quantitative structure activity relationships)9 and classiication.10,11
A graphic user interface for SPA is freely available at <http://www.ele.ita.br/~kawakami/spa>.
SPA comprises three main phases.7,12 Phase 1 consists
of projection operations carried out on the matrix of instrumental responses. These projections are used to generate chains of variables with successively more
elements. Each element in a chain is selected in order to display the least collinearity with the previous ones. In Phase 2, candidate subsets of variables are extracted from the chains and evaluated according to the predictive performance of the resulting MLR model. Such a performance can be assessed by using cross-validation or a separate validation set.13 Finally, Phase 3 consists of
a variable elimination procedure aimed at improving the parsimony of the model.7,12
Soares et al. 761 Vol. 21, No. 4, 2010
another coniguration is employed. However, it is clear that Phase 2 is the holdup for the overall computational eficiency of SPA.
The present work is aimed at improving the eficiency of Phase 2 in SPA by using a sequential regression procedure proposed elsewhere.14 The computational gain
thus obtained is demonstrated in an example involving a large NIR dataset of wheat samples.
Background and theory
Notation
Matrices are represented by bold capital letters and scalars by italic characters. The matrix X of instrumental response data has dimensions (N × K), where N and K
denote the number of calibration samples and spectral variables, respectively. The kth column of X corresponds
to variable x
k. Phase 2 of SPA evaluates subsets with
one up to M variables, where M can be speciied by the analyst under the restriction M≤ min(N − 1, K) for mean-centered data. The hat symbol (^) indicates an estimated value.
Successive projections algorithm
Phase 1 of SPA consists of projection operations involving the columns of matrix X. These operations are used to form K chains with M variables each. The irst element of the kth chain corresponds to x
k. Each
subsequent element in the chain is selected in order to display the least collinearity with the previous ones.1
In Phase 2, each chain is used to deine M candidate subsets of variables. The mth subset corresponds to the m
irst variables in the chain. These candidate subsets are then evaluated according to a suitable criterion that takes into account their relation with the dependent variable
y, which was not employed in the projection operations. For this purpose, metrics associated to the prediction ability of the resulting MLR model can be employed.7
The third and inal phase is a backward elimination procedure aimed at discarding variables that do not signiicantly contribute towards the prediction ability of the MLR model.7,12
Sequential regressions formulation
Without loss of generality, let us assume that {x1, x2, …, x
M} (in this order) is a chain of variables obtained
in Phase 1 of SPA. In Phase 2, these variables are used to obtain M progressively larger MLR models, starting from a single-variable (x1) model, followed by models with two (x1, x2), up to M (x1, x2, …, x
M) variables. Each
of these models can be obtained by a least-squares
regression procedure, independently from the others. Such a process requires the inversion of progressively larger matrices.15 The sequential regressions formulation
described below reduces computational workload by avoiding the need for such inverse calculations.
The sequential regressions formulation starts from a single-variable model of the form y = b1
(1)x
1 + ε
y|x1, where
b1(1) is the regression coeficient and εy|x1 is the residue.
An offset term is not included, under the assumption that the data have been mean-centered. Superscripts (1) and
y|x1 denote that one independent variable is employed in the model and that y is regressed on x1, respectively. The least-squares estimate of b1
(1) is given by15
(1)
where yi, xi,1 represent the values of y and x1 for the ith
calibration object, respectively.
By using a similar notation, the two-variable model is written as y = b1(2)x
1 + b2
(2)x
2 + ε
y|x1,x2. In order to obtain
b^1
(2) and b^
2
(2), x
2 is initially regressed on x1 according to
a model of the form
(2)
The coeficient estimate d^
1
x2|x1 can be calculated by
univariate regression as
(3)
Then, as shown elsewhere,14b^ 1 (2) and b^
2
(2) can be obtained
as
, (4)
where
(5)
and
(6)
Improving the Computational Eficiency of the Successive Projections Algorithm J. Braz. Chem. Soc. 762
where m ranges from 2 to M. For this purpose, the new independent variable x
m is initially regressed on x1, x2, …, xm – 1 according to a model of the form
(7)
The b coeficients of the m-variable model are then calculated as
(8)
(9)
where
(10)
(11)
A similar sequential procedure14 can be employed to
calculate the d coeficients involved in the regression of
x
m on x1, x2, …, xm – 1.
Experimental
NIR data set
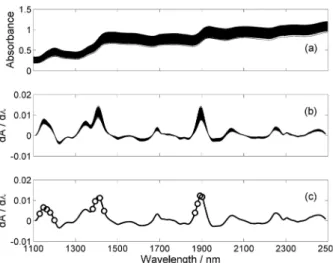
The dataset employed in this work consists of 775 Vis-NIR spectra of whole-kernel wheat, which were used as shoot-out data in the 2008 International Diffuse Relectance Conference (http://www.idrc-chambersburg. org/shootout.html). Protein content was chosen as the parameter of interest. The spectra were acquired in the range 400-2,500 nm with a resolution of 2 nm. In the present work, only the NIR region in the range 1,100-2,500 nm was employed. In order to remove undesirable baseline features, irst derivative spectra were calculated by using a Savitzky-Golay filter with a 2nd order polynomial and an 11-point window.17 The resulting
derivative spectra comprised 690 spectral variables. The Kennard-Stone (KS) algorithm18,19 was applied
to the derivative spectra to separate data into calibration, validation and prediction sets with 389, 193 and 193 samples, respectively. The validation set was employed to guide the selection of variables in Phase 2 of SPA. The prediction set was only used in the inal performance assessment of the MLR model.
Computational setup
All calculations were carried out by using a desktop computer with an Intel Core Duo processor (2.13 GHz) and 3 GB RAM memory. The Matlab 6.5 software platform was employed throughout. The standard (i.e., non-sequential) regression calculations were done by using the left division (or “backslash”) operator, which is a built-in function of Matlab.16
Results and Discussion
Figures 1a and 1b present the original and derivative spectra, respectively. As can be seen, the original spectra presented undesirable baseline features, which were removed by the derivative procedure.
Figure 2 presents the time required for completion of Phase 2 as a function of the maximum number M
of variables to be selected. For M = 200, for instance, regressions involving one up to 200 variables were carried out. As can be seen, the computational time increases with
M, but the increase is less pronounced if the sequential regression procedure is employed. For M = 200, for example, the proposed procedure reduces the time by a factor of approximately three. Such a computational gain becomes even more substantial for larger M, rising to ive for M = 388.
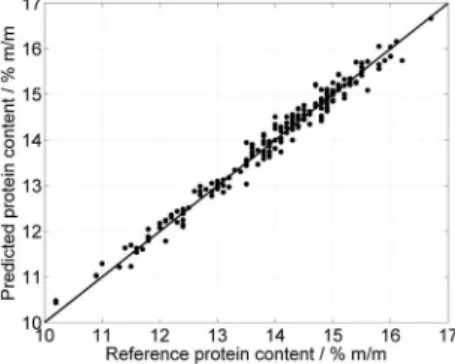
By applying SPA with M = 388, 13 variables were selected, as indicated in Figure 1c. Figure 3 compares the model predictions with the reference values of protein content for the prediction set. There is good agreement between predicted and reference values, as indicated by a correlation coeficient of 0.989. Moreover, the root-mean-square error of prediction (RMSEP)12,17 is 0.2% m/m, which
Soares et al. 763 Vol. 21, No. 4, 2010
is small as compared to the range of protein content in the prediction set (10.2-16.2%, m/m).
Conclusions
This paper proposed a new implementation of the successive projections algorithm (SPA) based on the use of a sequential regression procedure. This procedure was employed in Phase 2 of SPA, which is the computational bottleneck of the overall algorithm. For illustration, a large dataset of NIR spectra was employed for determination of protein in wheat. In this case, SPA selected 13 out of 690 spectral variables. The resulting model provided good predictions, with a correlation coeficient of 0.989 and an RMSEP value of 0.2% m/m in the range 10.2-16.2%, m/m. The proposed sequential regression implementation provided substantial gains (up to ive-fold) in computational eficiency as compared to the original SPA formulation.
Acknowledgments
This work was supported by FAPESP (Grants 2006/58850-6 and 2007/57803-7), CAPES (PROCAD Grant 0081/05-1) and CNPq (MSc scholarship and research fellowships).
References
1. Araújo, M. C. U.; Saldanha, T. C. B.; Galvão, R. K. H.; Yoneyama, T.; Chame, H. C.; Visani, V.; Chemom. Intell. Lab. Syst.2001, 57, 65.
2. Dantas Filho, H. A.; Souza, E. S. O. N.; Visani, V.; Barros, S. R. R. C.; Saldanha, T. C. B.; Araújo, M. C. U. ; Galvão, R. K. H.; J. Braz. Chem. Soc.2005, 16, 58.
3. Galvão, R. K. H.; Pimentel, M. F.; Araujo, M. C. U.; Yoneyama, T.; Visani, V.; Anal. Chim. Acta2001,443, 107.
4. Honorato, F. A.; Galvão, R. K. H.; Pimentel, M. F.; Neto, B. B.; Araújo, M. C. U.; Carvalho, F. R.; Chemom. Intell. Lab. Syst.2005, 76, 65.
5. Breitkreitz, M. C.; Raimundo Jr, I. M.; Rohwedder, J. J. R.; Pasquini, C.; Dantas Filho, H. A.; José, G. E.; Araújo, M. C. U.; Analyst2008,128, 1204.
6. Dantas Filho, H. A. D.; Galvão, R. K. H.; Araújo, M. C. U.; Silva, E. C.; Saldanha, T. C. B.; José, G. E.; Pasquini, C.; Raimundo Jr., I. M.; Rohwedder, J. J. R.; Chemom. Intell. Lab. Syst.2004, 72, 83. 7. Galvão, R. K. H.; Araújo, M. C. U.; Fragoso, W. D.; Silva, E. C.;
José, G. E.; Soares, S. F. C.; Paiva, H. M.; Chemom. Intell. Lab. Syst.2008, 92, 83.
8. Pereira, A. F. C.; Pontes, M. J. C.; Gambarra, N. F. F.; Santos, S. R. B.; Galvão, R. K. H.; Araújo, M. C. U.; Food Res. Int.2008, 41, 341.
9. Akhlaghi, Y.; Kompany-Zareh, M.; J. Chemom.2006, 20, 1. 10. Pontes, M. J. C.; Galvão, R. K. H.; Araújo, M. C. U.; Moreira, P. N.
T.; Pessoa Neto, O. D.; José, G. E.; Saldanha, T. C. B.; Chemom. Intell. Lab. Syst.2005, 78, 11.
11. Gambarra Neto, F. F.; Marino, G.; Araújo, M. C. U.; Galvão, R. K. H.; Pontes, M. J. C.; Medeiros, E. P.; Lima, R. S.; Talanta2009, 77, 1660. 12. Galvão, R. K. H.; Araújo, M. C. U. In Comprehensive Chemomics:
Chemical and Biochemical Data Analysis; Brown, S.; Tauler, R.; Walczak, B., eds.; Elsevier: Oxford, 2009.
13. Galvão, R. K. H.; Araújo, M. C. U.; Silva, E. C.; José, G. E.; Soares, S. F. C.; Paiva, H. M.; J. Braz. Chem. Soc.2007, 18, 1580. 14. Gusnanto, A.; Pawitan, Y.; Huang, J.; J. Chemom.2003, 17, 174. 15. Draper, N. R.; Smith, H.; Applied Regression Analysis, 3rd ed.,
Wiley: New York, 1998.
16. Matlab Function Reference, vol.1, The Mathworks: Natick, MA, 2002.
17. Beebe, K. R.; Pell, R. J.; Seasholtz, B.; Chemomics - A Pratical Guide, Wiley: New York, 1998.
18. Kennard, R. W.; Stone L. A.; Technometrics1969, 11, 137. 19. Kanduc, K. R.; Zupan, J.; Majcen N.; Chemom. Intell. Lab. Syst.
2003, 65, 221.
Received: August 19, 2009
Web Release Date: December 15, 2009
FAPESP helped in meeting the publication costs of this article. Figure 2. Time for completion of Phase 2 in SPA with (a) original and
(b) proposed formulation. The inset presents an expanded view of the initial part of the graph.