AMTD
7, 5829–5882, 2014Long-term AOD-PMX
relationships in north-nentral Spain
Y. S. Bennouna et al.
Title Page
Abstract Introduction
Conclusions References
Tables Figures
◭ ◮
◭ ◮
Back Close
Full Screen / Esc
Printer-friendly Version
Interactive Discussion
Discussion
P
a
per
|
Discus
sion
P
a
per
|
Discussion
P
a
per
|
Discussion
P
a
per
|
Atmos. Meas. Tech. Discuss., 7, 5829–5882, 2014 www.atmos-meas-tech-discuss.net/7/5829/2014/ doi:10.5194/amtd-7-5829-2014
© Author(s) 2014. CC Attribution 3.0 License.
This discussion paper is/has been under review for the journal Atmospheric Measurement Techniques (AMT). Please refer to the corresponding final paper in AMT if available.
Relationships between columnar aerosol
optical properties and surface particulate
matter observations in north-central
Spain from long-term records (2003–2011)
Y. S. Bennouna1, V. Cachorro1, M. A. Burgos1, C. Toledano1, B. Torres1,2, and A. de Frutos1
1
Atmospheric Optics Group (GOA), University of Valladolid (UVA), Valladolid, Spain
2
Laboratoire d’Optique Amosphérique (LOA) – UMR8518, Université des Sciences et Technologies de Lille, Villeneuve d’Ascq, France
Received: 11 April 2014 – Accepted: 21 May 2014 – Published: 11 June 2014
Correspondence to: Y. S. Bennouna ([email protected])
AMTD
7, 5829–5882, 2014Long-term AOD-PMX
relationships in north-nentral Spain
Y. S. Bennouna et al.
Title Page
Abstract Introduction
Conclusions References
Tables Figures
◭ ◮
◭ ◮
Back Close
Full Screen / Esc
Printer-friendly Version
Interactive Discussion
Discussion
P
a
per
|
Discus
sion
P
a
per
|
Discussion
P
a
per
|
Discussion
P
a
per
|
Abstract
This work examines the relationships between Aerosol Optical Depth (AOD) and Par-ticulate Matter (PMX) parameters, based on long records (2003–2011) of two nearby sites from the AERONET and EMEP networks in the north-central area of Spain. The climatological annual cycle of PM10 and PM2.5 present a bimodality which might be
5
partly due to desert dust intrusions, a pattern which does not appear in the annual cy-cle of the AOD. In the case of the AOD, this bimodality is likely to be masked because of the poor sampling of sunphotometer data as compared to PMX(67 % of days against 90 %), and this fact stresses the necessity of long-term observations. In monthly series, significant interannual variations are observed and most extrema coincide, however the
10
bimodal shape remains relatively stable for PMX. Significant and consistent trends were found for both datasets likely associated to a decrease of desert dust apportionment until 2009. PM10and AOD daily data are moderately correlated (0.56), a correlation im-proving for monthly means (0.70). In the case of strong desert dust events day-to-day correlation is not systematic, therefore an extensive analysis on PMX, fine-PM ratio,
15
AOD and associated Ångström exponent (α) is carried out.
1 Introduction
Airborne ambient particles represent a considerable environmental factor of risk for human health. Indeed, epidemiological studies have extensively shown statistical as-sociation between the exposure to particulate air pollution and adverse health effects
20
(Pope III, 2000).
A common reference indicator for particulate air quality is the concentration of partic-ulate matter (PM) at ground level which is given in units of mass per unit volume of air. Since the health impact of particulate air pollution appears to relate most consistently with aerodynamic diameters, which determines the capability of airborne particles to
25
AMTD
7, 5829–5882, 2014Long-term AOD-PMX
relationships in north-nentral Spain
Y. S. Bennouna et al.
Title Page
Abstract Introduction
Conclusions References
Tables Figures
◭ ◮
◭ ◮
Back Close
Full Screen / Esc
Printer-friendly Version
Interactive Discussion
Discussion
P
a
per
|
Discus
sion
P
a
per
|
Discussion
P
a
per
|
Discussion
P
a
per
|
size fractions. Although determining the PM size-fraction that has the strongest po-tential impact on health remains a controversial issue (Harrison and Yin, 2000), PM size fraction is the most available and commonly used metric in epidemiologic studies for assessing health effects associated with ambient particles (Osornio-Vargas et al., 2011).
5
With this respect, PM10 also often called “inhalable particles” (Brown et al., 2013), refers to particle fraction with aerodynamic diameters less than 10 µm. In the same way, PM2.5 or “fine particles” is another measure of particulate matter. The latter is associated to hazardous effect, having far greater efficiency than “coarse particles” (2.5–10 µm) to penetrate the respiratory system till the alveolar regions (Brown et al.,
10
2013). Consequently, PM10is usually used as a standard for measuring aerosol loading while PM2.5is rather commonly used to relate health and visibility impacts (Higgins and Wickman, 2009).
With the aim to protect public health and environment, various national and inter-national institutions have set limits and guide values for the concentration of various
15
PM size fractions. The WHO (World Health Organisation) recommends PM limit lev-els for annual mean and 24 h mean of respectively 20 µg m−3and 50 µg m−3for PM
10, 10 µg m−3 and 25 µg m−3 for PM2.5 (WHO, 2006). Current European air quality stan-dards for PM are still above these limits. The annual mean PM10 should not exceed 40 µg m−3(limit value set in 2005), and a daily limit value of 50 µg m−3may only be
ex-20
ceeded 7 days a year. Besides, the current European directive (2008/50/EC) fixes the annual maximum targeted value for PM2.5 to 25 µg m−3 in 2015 (EC, 2008). Although
so far this objective has not been achieved at all sites (EEA, 2012), decreasing trends in yearly averaged have been observed in many countries of Europe (Cusack et al., 2012; Galindo et al., 2013; EMEP, 2011). These reductions are certainly in a great part
at-25
AMTD
7, 5829–5882, 2014Long-term AOD-PMX
relationships in north-nentral Spain
Y. S. Bennouna et al.
Title Page
Abstract Introduction
Conclusions References
Tables Figures
◭ ◮
◭ ◮
Back Close
Full Screen / Esc
Printer-friendly Version
Interactive Discussion
Discussion
P
a
per
|
Discus
sion
P
a
per
|
Discussion
P
a
per
|
Discussion
P
a
per
|
To support the regional agencies in their labor of advertisement and AQ Directive compliance duties, a significant effort has been dedicated to the implementation of continuous ground-based in-situ monitoring networks to measure pollution associated to this type of particles/size fraction. Since 1999, all European countries are required to maintain dense PM10measurements for urban agglomerations of relevant size (EC,
5
1999, 2008). Besides, other networks such as the European Monitoring and Evaluation Programme (EMEP) network have been established with the objective to study Long-Distance Atmospheric Pollution, thus providing governments with quantitative informa-tion on the transport of air pollutants across nainforma-tional boundaries, resulting deposiinforma-tion and concentration levels (Tørseth et al., 2012; Borowiak and De Saeger, 1996). In order
10
to measure only pollution at regional level, the location of EMEP stations must follow a number of requirements: (a) be situated in a rural area, (b) be away from buildings and (c) far enough from industrial sources of pollutants (minimum 40 km), (c) exclude valleys and peaks. The concentrations of PM10and PM2.5are monitored at many sites of the EMEP network. The data provided by such networks can be used not only to
15
quantify the concentration of these particle fractions, but also to investigate relations between them and to compare their elemental/chemical composition. Despite all these efforts, PM observations are too scarce to resolve the large spatial and temporal vari-ation and thus limit the potential of enviromental and health assessment for regulating impacts.
20
Although detailed measurements can only be achieved in situ, observations of at-mospheric aerosols can also be provided by remote sensing techniques. On ground, dense sunphotometer networks such as NASA’s AERONET (Aerosol Robotic Network) created in the 1990’s provides a continuous database of aerosol remote sensed mea-surements at more than nearly 400 sites around the globe (Holben et al., 1998). Such
25
AMTD
7, 5829–5882, 2014Long-term AOD-PMX
relationships in north-nentral Spain
Y. S. Bennouna et al.
Title Page
Abstract Introduction
Conclusions References
Tables Figures
◭ ◮
◭ ◮
Back Close
Full Screen / Esc
Printer-friendly Version
Interactive Discussion
Discussion
P
a
per
|
Discus
sion
P
a
per
|
Discussion
P
a
per
|
Discussion
P
a
per
|
wavelength. Hence, this parameter does not directly quantifies the particle loading, as it is obtained by vertically integrating the aerosol concentration weighted with the ef-fective cross-sectional area of those interacting (by scattering and absorption) with the solar radiation at the wavelength of interest (Ramanathan et al., 2001).
Remote sensing from space satellite is the only technology capable to achieve full
5
spatial coverage. Despite the fact that satellite measurements (AOD) are not as accu-rate as ground-based ones, they represent a cost-effective method to improve the in-sight in PM spatial distribution and transport patterns, especially in a context of increas-ing availability of satellite observations (Kokhanovsky et al., 2007). Moreover, aerosol information has started to be retrieved from space a few decades ago over ocean and
10
more recently over land (King et al., 1999).
The availability of PM concentration spatiotemporal maps is crucial for a better un-derstanding of the underlying natural processes and an adequate assessment of PM effects. For this reason, in the recent years there has been a great interest for studies using satellite AOD to monitor and assess air quality. Nevertheless, the AOD is a
com-15
plex function of the aerosol mass concentration, mass extinction efficiency, relative hu-midity, and vertical distribution of aerosols, and several authors have investigated the relationships between the latter and PMX. Some of these studies are based on ground-based AOD measurements (Cachorro and Tanre, 1997; Pelletier et al., 2007; Schaap et al., 2009; Estellés et al., 2012) such as those from AERONET operational network,
20
known to provide well calibrated data and often used for the validation of satellite in-version algorithms. In other works, PMX data are directly derived from satellite AODs (Kokhanovsky et al., 2009; Koelemeijer et al., 2006; Zhang et al., 2009; Al-Saadi et al., 2005; Vidot et al., 2007). These lead to remote sensing of PMXusing MODIS (Moderate Resolution Imaging Spectroradiometer), MISR (Multi-angle Imaging
SpectroRadiome-25
AMTD
7, 5829–5882, 2014Long-term AOD-PMX
relationships in north-nentral Spain
Y. S. Bennouna et al.
Title Page
Abstract Introduction
Conclusions References
Tables Figures
◭ ◮
◭ ◮
Back Close
Full Screen / Esc
Printer-friendly Version
Interactive Discussion
Discussion
P
a
per
|
Discus
sion
P
a
per
|
Discussion
P
a
per
|
Discussion
P
a
per
|
A characteristic source of aerosols from natural origin affecting Southern Europe is the dust transported from the Sahara and Sahel deserts. In particular, because of its proximity to the African continent and favorable atmospheric circulation, the area of the Iberian Peninsula is frequently affected by strong episodes of desert dust, when airmasses are advected from the Saharan desert to the Iberian Peninsula under
spe-5
cific synoptic conditions (Artíñano et al., 2001; Rodríguez et al., 2001; Escudero et al., 2005). These dust outbreaks have an important impact on air quality, and some studies have highlighted that most PM10exceedance observed at regional background stations are associated whith those events (Rodríguez et al., 2004; Escudero et al., 2007). Desert dust intrusions are also detected by remote measurement techniques using
10
sunphotometers, based on the AOD and its spectral wavelength dependence with the Ångström exponent parameter (Vergaz, 2001; Vergaz et al., 2005; Lyamani et al., 2005; Cachorro et al., 2006; Toledano et al., 2007b; Cachorro et al., 2008; Toledano et al., 2009). Moreover, owing to the dry climate and scarcity of precipitations the particles accumulate in the atmosphere. Two different types of episodes associated with
min-15
eral dust can be linked to the increase of PM concentrations in the central area of the Iberian Peninsula: regional recirculation during summer months and long-range trans-port processes from spring to autumn time (Coz et al., 2009; Querol et al., 2004).
The objective of this work is to investigate in details the relations between PMX and AOD data in the northern central area of Spain, through the use of two nearby regional
20
background sites from the EMEP and AERONET networks. Indeed, such relations have been studied in the case of urban atmospheres, but it has not been done for relatively clean atmospheric backgrounds such as it is the case here, and furthermore with the highest levels of PMX attributed to desert dust intrusions. Besides, it is the first time to our knowledge that such long records are used for this kind of study taking into
25
AMTD
7, 5829–5882, 2014Long-term AOD-PMX
relationships in north-nentral Spain
Y. S. Bennouna et al.
Title Page
Abstract Introduction
Conclusions References
Tables Figures
◭ ◮
◭ ◮
Back Close
Full Screen / Esc
Printer-friendly Version
Interactive Discussion
Discussion
P
a
per
|
Discus
sion
P
a
per
|
Discussion
P
a
per
|
Discussion
P
a
per
|
(PM2.5/PM10) for surface observations. The whole analysis is thus carried out with respect to the climatological aerosol types (e.g. continental, desert, maritime, biomass burning).
The paper starts by briefly introducing the region of study and follows by a description of the different datasets. The results present an analysis of the annual cycle,
interan-5
nual variability, and trends of PMXsize fractions in relation to those of the AOD. These parameters are examined in parallel with the information of the Ångström exponent and fine-PM ratio in order to address the foundings in terms of aerosol size and type. The correlation results between these parameters are also presented both for daily data and monthly averages.
10
2 Region of study and measurement sites
The locations of the two sites used in this study are presented in Fig. 1. The towns of Peñausende (41.24◦N 5.90◦W, 985 m a.s.l.) and Palencia (41.99◦N, 4.52◦W,
750 m a.s.l.) belong to the autonomous community of “Castilla y León” (CyL). This re-gion, situated in the north central part of the Iberian Peninsula lies on the northern
15
plateau of Spain (Castilian Plateau) which has on average an altitude of 700 m, and is crossed by the Duero River forming a narrow valley. The Castilian Plateau is sur-rounded by moutains of almost uniform height (Pinto et al., 2001). These mountains stand as topographic barriers reducing greatly Atlantic and Mediterranean influences thus leading to the continental climate characterizing this region (Del Rio et al., 2007).
20
The CyL region extends over a large territory (94 193 km2) with an area of about a fifth of Spain it is the third European region in size. It is the most sparsely populated region of the country with a density around 27 hab km−2. The biggest metropolitan center of the region is Valladolid (∼400 000 habitants), the capital of the region. About 50 km to the north-east of Valladolid, Palencia, the capital of its own province, is a small
25
AMTD
7, 5829–5882, 2014Long-term AOD-PMX
relationships in north-nentral Spain
Y. S. Bennouna et al.
Title Page
Abstract Introduction
Conclusions References
Tables Figures
◭ ◮
◭ ◮
Back Close
Full Screen / Esc
Printer-friendly Version
Interactive Discussion
Discussion
P
a
per
|
Discus
sion
P
a
per
|
Discussion
P
a
per
|
Discussion
P
a
per
|
to the province of Zamora is situated at 26 km of Zamora (∼65 000 habitants). Both Palencia and Peñausende, are relatively well isolated from big urban and industrial centers, Valladolid being the closest of relevant size, and can therefore be classified as rural regional background stations. Such sites are particularly useful to detect and characterize the impact of desert dust outbreaks (Coz et al., 2009).
5
3 Datasets
At Peñausende, PMXmeasurements have been carried out continuously since 2001 by means of gravimetric methods. The samples are collected on quartz fiber filters using MCV-PM1025 high-volume samplers operating at an average flow rate of 30 m3h−1 with 10 µm/2.5 µm cut-off inlets. Sample treatment, analytical procedures and quality
10
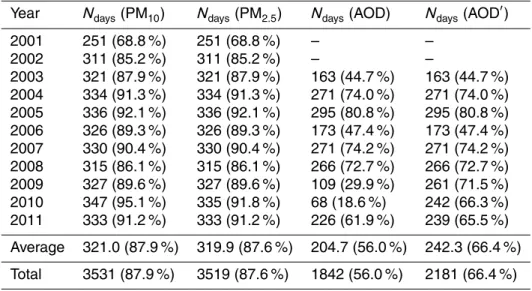
assurance are performed according to the details described in the EMEP Manual for Sampling and Chemical Analysis (EMEP, 1996). PM10 and PM2.5sampling is carried out on a daily basis (one PM10 and one PM2.5, 24 h sample/day). Table 1 sums up the number of EMEP PMX measurements available by year. On average for a year, data are provided about 88 % of the time, with a minimum of 251 days in 2001 when the
15
station started operation, and a maximum of 347 (95 %) in 2007. It can be seen that PM2.5was also continuously measured with PM10, except for the year 2010, for which 12 days are missing. For the full period between 2001–2011, this leads to totals of 3531 and 3519 days for PM10 and PM2.5 datasets respectively, and to totals of 2969 and 2957 respectively, considering the restricted period 2003–2011 used in this study.
20
A CIMEL sunphotometer located at the outskirts of Palencia (University Campus, Technical Superior School of Forestry and Agricultural Engineering) and operating in the frame of AERONET-EUROPE (Holben et al., 1998; Goloub et al., 2012), has been providing continuous aerosol measurements from 2003 to 2011 with the exception of 15 months between 2009 and 2010. For climatological and trend analysis (Sects. 4.1
25
AMTD
7, 5829–5882, 2014Long-term AOD-PMX
relationships in north-nentral Spain
Y. S. Bennouna et al.
Title Page
Abstract Introduction
Conclusions References
Tables Figures
◭ ◮
◭ ◮
Back Close
Full Screen / Esc
Printer-friendly Version
Interactive Discussion
Discussion
P
a
per
|
Discus
sion
P
a
per
|
Discussion
P
a
per
|
Discussion
P
a
per
|
though, the original dataset of Palencia which does not include the completion by Au-tilla data was used. Table 1 shows data counts of daily data by year, prior and after completion of the Palencia dataset. The AERONET data used in this study are “cloud screened” and “quality assured” Level 2 data (Smirnov et al., 2000), and in addition the data have been post-corrected for calibration errors. The AOD accuracy for Level 2
5
AERONET is about 0.01 in the visible and near infrared, and about 0.02 in the ultravi-olet (Eck et al., 1999). It must also be recalled that for this dataset all days presenting less than 3 available measurements were filtered out from the time series.
4 Results
4.1 Climatological annual cycle AOD-PM
10
The objective of the paper being to analyze PMX data in relation with AOD-Alpha pa-rameters, from now on the EMEP datasets are restricted to common years, and there-fore related to the restricted period 2003–2011, including 2969 out of 3531 days of data for PM10, and 2957 days of data for PM2.5.
In Fig. 2, the 9 year climatological annual cycle for PM10 is represented with that
15
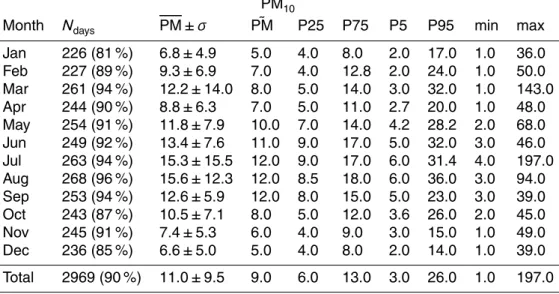
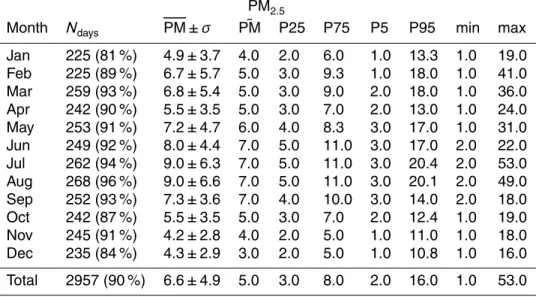
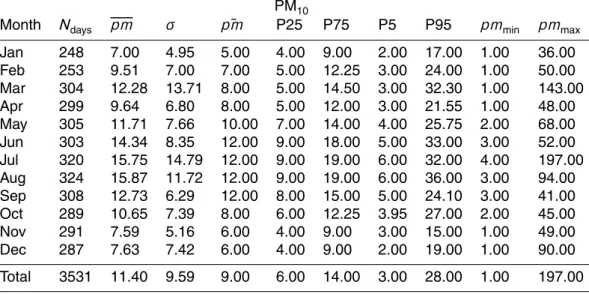
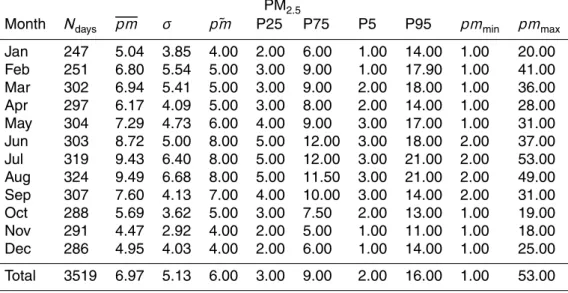
of the AERONET AOD at 440 nm. Associated statistical values of PMX are reported in Table 2 for PM10 and correspondingly in Table 3 for PM2.5. As an indication, the corresponding statistics for the complete PM dataset are enclosed in annex Tables A1 and A2, as well as related plot in Fig. A1. For the AOD, Fig. 2b have been recalculated from a previous study on AERONET data (Bennouna et al., 2013) using the original
20
dataset of Palencia with no data from Autilla. The difference between these results and those of that other work are shown in the annex section in Fig. A2.
At Peñausende, PM10 is on average 11.0±9.5 µg m−3over the full period, and 6.6± 4.9 µg m−3 for PM
2.5, and such values highlight the very clean conditions of the area. As shown on Fig. 2a the climatological cycle of PM10 is characterized by high values
25
AMTD
7, 5829–5882, 2014Long-term AOD-PMX
relationships in north-nentral Spain
Y. S. Bennouna et al.
Title Page
Abstract Introduction
Conclusions References
Tables Figures
◭ ◮
◭ ◮
Back Close
Full Screen / Esc
Printer-friendly Version
Interactive Discussion
Discussion
P
a
per
|
Discus
sion
P
a
per
|
Discussion
P
a
per
|
Discussion
P
a
per
|
August of 12.2 µg m−3and 15.6 µg m−3respectively. Although it is not shown here, the climatological curve of PM2.5presents the same variations and shape, with two maxima (6.8 µg m−3 and 9.0 µg m−3) occurring in the same months (see Table 3). This leads
to a relative minimum in April of 8.8 µg m−3 for PM10 and 5.5 µg m−3 for PM2.5. The bimodality reflects clearly the seasonal cycle/frequency of mineral dust outbreaks over
5
The Iberian Peninsula which are frequent in summer, and generally in late-winter/early-spring (bearing in mind that March-April-May months refer to late-winter/early-spring) (Querol et al., 2009; Cachorro et al., 2013).
Indeed, many previous studies have already highlighted the fact that most high PM10 events are associated to the arrival of high-Saharan dust air masses over the Iberian
10
Peninsula (Rodríguez et al., 2001; Escudero et al., 2005, 2007; Querol et al., 2009). Particularly in summer when the mixing layer is higher, vertical mixing between the lower levels of the troposphere with high atmospheric air masses originating from North Africa is favored (Dayan and Miller, 1989). Although the summer occurrence of desert intrusions has been extensively studied, those of winter/spring are also of relevance as
15
shown here. This behavior can be almost extended to the entire Iberian Peninsula with a decreasing gradient from south to north, as explained hereafter with the behavior of the AOD.
The most obvious difference between the mean annual cycle of AOD and PMX is precisely the presence of these two modes, instead of one for the AOD (Bennouna
20
et al., 2013). Indeed, in spring no maximum emerges in the case of the AOD. Moreover it must be noted that the variation is not well defined for the first six months of the year (January–June) with a very irregular increase from to 0.09 in January to 0.16 in June. On the contrary, the decrease from summer to fall is more regular and becomes steeper when the fall starts. In order to possibly explain the shape difference between the AOD
25
AMTD
7, 5829–5882, 2014Long-term AOD-PMX
relationships in north-nentral Spain
Y. S. Bennouna et al.
Title Page
Abstract Introduction
Conclusions References
Tables Figures
◭ ◮
◭ ◮
Back Close
Full Screen / Esc
Printer-friendly Version
Interactive Discussion
Discussion
P
a
per
|
Discus
sion
P
a
per
|
Discussion
P
a
per
|
Discussion
P
a
per
|
found that the climatological curves of coinciding days also lead to similar results for all curves (not shown here) and therefore no conclusion can be drawn on that aspect.
However, the bimodality of the climatological annual cycle for the AOD has already been observed at a site of the Iberian Peninsula, located in the south-western coast of Spain, in the area of the Gulf of Cadiz near the city of Huelva (Bennouna et al., 2011). In
5
this area of the Iberian Peninsula, mineral dust events are more frequent and stronger (Toledano et al., 2007b). Figure 3b presents the climatological annual cycle of PM10, PM2.5 and AOD (440 nm) based on data from two southern EMEP and AERONET sites, Barcarrota (38.47◦N, 6.92◦W, 393 m a.s.l., Badajoz) and El Arenosillo (37.10◦N, 6.73◦W, 0 m a.s.l., Huelva) for the same period as above (2003–2011). For comparison
10
purposes, Figure 3a indicates also the same results for Peñausende-Palencia, includ-ing those already shown in Fig. 1. The AOD annual cycle at El Arenosillo was already presented in a former study but for the period 2000–2010 (Bennouna et al., 2011). For the results shown here, due to the end of El Arenosillo site operations in 2010, the time series was extended to 2011 using the data from a new nearby (10 km) AERONET site
15
in Huelva which is meant to replace the El Arenosillo site. As it can be seen, like for Peñausende, at Barcarrota, PM10 presents two maxima. At El Arenosillo, the AOD also shows a maximum in March, and two summer maxima in June and August with similar values. Thus, the climatological cycle of AOD/PMXis likely to be modulated by African dust intrusion with a south-north gradient. The two maxima in the AOD are separated
20
by a local minimum in July which has been discussed in a number of other studies (Bennouna et al., 2011; Ortiz de Galisteo et al., 2013).
This behavior is consistent with the analysis of the AOD annual cycle attributed to mineral dust transport over the Atlantic using satellite data, which has also shown the presence of several maxima depending on both latitude and longitude (Kaufman et al.,
25
AMTD
7, 5829–5882, 2014Long-term AOD-PMX
relationships in north-nentral Spain
Y. S. Bennouna et al.
Title Page
Abstract Introduction
Conclusions References
Tables Figures
◭ ◮
◭ ◮
Back Close
Full Screen / Esc
Printer-friendly Version
Interactive Discussion
Discussion
P
a
per
|
Discus
sion
P
a
per
|
Discussion
P
a
per
|
Discussion
P
a
per
|
4.2 Variability and trends
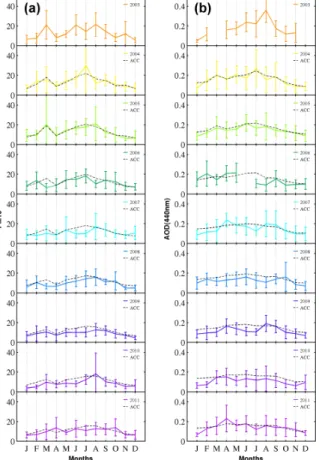
In order to investigate year-to-year variations, Fig. 4 presents the annual cycle of the previous parameters for each year together with the climatological curve as it gets built from the accumulation of prior years. The PM10 annual cycle (Fig. 4a) for each year is in general similar to the mean climatological annual cycle, which indicates small shape
5
variations from one year to another, making the accumulated values relatively stable. This can be seen from the “accumulated” curve which changes very little from the first (top) to the last (bottom). The same is also observed when extending the time series back to 2001 when Peñausende started operations. The spring maximum occurs in March for most of the years (2003, 2004, 2005, 2009 and 2010), and a few times in
10
February (2006, 2008), but rarely in April (2011) or May (2007). It should be noted that the spring maximum is much higher in the first years (2003–2005) than later on. In 2009, PM10 values are particularly low and no clear maximum appears. In summer, a single peak is usually observed alhough some years can present two peaks. The absolute maximum in summer is generally observed in August (2003, 2005, 2007, 2008
15
and 2010), but also in July (2004). For the whole period, the highest peak in summer is observed in July 2004, which corresponds to the strongest desert dust intrusion ever recorded over the Iberian Peninsula (Cachorro et al., 2008). As regards secondary maxima in summer, in general they are found in June (e.g. 2003, 2008). More rarely, peaks can also be found in early-fall such as it is the case in 2008 an 2011.
20
On the contrary, the annual cycle of the AOD can be very different from one year to another (Fig. 4b), and this can also be observed in the evolution of anomalies in the next Figure. In Fig. 4b, the “accumulated” curve shows two maxima in the first years, but then is smoothed as the position of the maxima moves. Nevertheless, most PM10 maxima coincide with those of the AOD. Exceptions are observed though for the
25
AMTD
7, 5829–5882, 2014Long-term AOD-PMX
relationships in north-nentral Spain
Y. S. Bennouna et al.
Title Page
Abstract Introduction
Conclusions References
Tables Figures
◭ ◮
◭ ◮
Back Close
Full Screen / Esc
Printer-friendly Version
Interactive Discussion
Discussion
P
a
per
|
Discus
sion
P
a
per
|
Discussion
P
a
per
|
Discussion
P
a
per
|
The same monthly means are presented this time to show their evolution in Fig. 5. At first sight, a clear decrease for both the AOD and PM10 can be observed. This can also be seen in the anomaly time series which indicates that from 2008 on, positive anomalies become rare as compared to pre-2008, and hence most monthly anomalies are negative in the last four years. This fact, which has already been noted for the AOD
5
in a previous work (Bennouna et al., 2013) and corroborated here by PMX data, lead to a trend analysis exercise that was not done in that other paper.
The existence of linear trends in PMX and AOD data has been tested using the rank-based non-parametric Seasonal Kendall Trend Test (SKTT) using the implemen-tation for MATLAB “Mann–Kendall Test with Sen’s Slope Method for data with Serial
10
Dependance” provided by Jeff Burkey (http://www.mathworks.com). The SKTT is an extended version of the standard Mann–Kendall, also called Kendall’s tau test (Mann, 1945; Kendall, 1975; Hirsch and Slack, 1984), which is robust in the case of data pre-senting strong seasonality. To quantify the magnitude of these trends, this analysis was therefore applied on the monthly values. All the results for the slopes and their
15
associated significance (pvalue) are reported in Table 6.
Based on all available PM data (2001–2011), it was found that PM10 decreases at a significant rate/slope of 0.42 µg m−3year−1, and this would represents a 31 %
reduc-tion during the full period 2001–2011. In the case of PM2.5the trend calculation leads to a significant rate/slope of 0.38 µg m−3year−1, and thus a reduction of 43 % over the
20
full period. This result is in perfect agreement with (Cusack et al., 2012) for the same site but during a slightly shorter period (2002–2010), finding a reduction of 42 % for PM2.5. However, for the coarse mass fraction or PM2.5−10, the weak negative slope that is found here is not significant (see Table 6). In a previous study on the same period but ending a year earlier, (Barmpadimos et al., 2012) also found a lack of significance
25
AMTD
7, 5829–5882, 2014Long-term AOD-PMX
relationships in north-nentral Spain
Y. S. Bennouna et al.
Title Page
Abstract Introduction
Conclusions References
Tables Figures
◭ ◮
◭ ◮
Back Close
Full Screen / Esc
Printer-friendly Version
Interactive Discussion
Discussion
P
a
per
|
Discus
sion
P
a
per
|
Discussion
P
a
per
|
Discussion
P
a
per
|
of the climatological annual cycle presented above. During the period 2001–2011, the AOD also presents a statistically significant decreasing trend of 0.0041 per year.
The decreasing trend is also clearly noticeable in Fig. 6a and Table 4 when look-ing directly at the annual averages of PM10, decreasing from 15.1 µg m−3 in 2001 to 10.1 µg m−3in 2011 (i.e. 33 % reduction). Besides, the variations of PM
2.5annual mean
5
are again similar to those of PM10, which is decreasing from 9.9 µg m−3 in 2001 to 5.2 µg m−3in 2011 (cf. Fig. 6 and Table 5). However, this graph reveals a new behavior
which was not obvious in the previous monthly timeseries, as it seems that the trend slope is inverted in the last 3–4 year. For PMX data it is not so clear when the slope inversion takes place but it seems to be rather between 2008–2010. For AOD data the
10
trend change is much clearer as shown by the steep slopes around the minimum value, which according to the AOD curve might be taking place in 2009 or 2010. To make an appropriate recalculation of the trend for the adequate period, a more accurate deter-mination of the location of this minimum is needed. The method proposed to resolve this problem is illustrated in subsequent findings.
15
With Fig. 6b, it is intended to estimate the contribution of the desert dust aerosol to the decreasing trend that is observed. The contribution is obtained by doing the diff er-ence between the quantities calculated including and excluding days with desert dust aerosols. The days with desert dust aerosols have been identified using the inventory of desert dust event carried out by Cachorro et al. (2013) for the period 2003–2011,
20
which is based on a manual inspection of both AOD (at Palencia and Autilla) and PMX (at Peñausende) with the support of other sources of information such as backtrajec-tories, satellite images, synoptic maps and forecasts from transport models.
As it can be seen, the contribution of desert dust aerosols to the total aerosol load provides consistent results for PM10and AOD. According to PM10, since the beginning
25
AMTD
7, 5829–5882, 2014Long-term AOD-PMX
relationships in north-nentral Spain
Y. S. Bennouna et al.
Title Page
Abstract Introduction
Conclusions References
Tables Figures
◭ ◮
◭ ◮
Back Close
Full Screen / Esc
Printer-friendly Version
Interactive Discussion
Discussion
P
a
per
|
Discus
sion
P
a
per
|
Discussion
P
a
per
|
Discussion
P
a
per
|
North Atlantic Oscillation (NAO) index starting in 2006, which is consistently correlated with the trends observed in PMX, and in particular in North-East Spain. Such a negative anomaly revealed by the NAO index has not been observed since the 1950s.
For the AOD, the variations are similar except for years 2005 and 2006 where the contribution drops suddenly from 20 % to less than 10 %, whereas PM10 contribution
5
remains relatively high with a magnitude close to that of the previous years. For 2006, this can be easily explained by the fact that almost two complete months of data are missing and precisely the months of June and July. These months known to be often affected by desert dust intrusion are critical for the representativity of the annual mean and for this reason, the obtained contribution to the AOD is lower than it should be
10
actually. This is demonstrated in Fig. 7a which shows that when using only coinciding daily data series for all parameters, the agreement between dust contributions to PMX and AOD is significantly improved for 2006.
In 2005, the problem is slightly different because it is related this time to a strong desert dust event. During this episode, which took place on 19 and 20 March 2005,
15
PM10 records present an extremely high value of 112 and 143 µg m−3 respectively, and it must be highlighted that such a strong event represents no less than 38 % of the annual contribution of desert dust, and therefore can affect considerably the re-sult. Despite such records of PM10, it was found that the AOD at 440 nm remains at the value of 0.21 and 0.26 (α=0.38, 0.29) for those days, which does not reflect the
20
intensity of the intrusion. Indeed, as a comparison, it could be mentioned that for the 24 and 25 July 2004, PM10data was as high as 197 and 130 µg m−3respectively, with corresponding AOD (440 nm) of 0.89 and 0.75 (α=0.11, 0.19) (Cachorro et al., 2008). However, 19 and 20 March 2005 were particularly cloudy, and only few AOD measure-ments were available. The poor sampling and possible failure of the cloud screening
25
AMTD
7, 5829–5882, 2014Long-term AOD-PMX
relationships in north-nentral Spain
Y. S. Bennouna et al.
Title Page
Abstract Introduction
Conclusions References
Tables Figures
◭ ◮
◭ ◮
Back Close
Full Screen / Esc
Printer-friendly Version
Interactive Discussion
Discussion
P
a
per
|
Discus
sion
P
a
per
|
Discussion
P
a
per
|
Discussion
P
a
per
|
more realistic ones (AOD (440 nm)∼0.8), all contributions curves agree better. Hence, the difference observed in 2005 results from a combination of sampling issues at dif-ferent time scales. On one hand daily sampling of the AOD leeds to missing days in the timeseries, and on the other hand instantaneous sampling of the AOD leeds to an unrealistic representation of one of the strongest events of that year.
5
To sum up on the disagreements found for both years 2005 and 2006, it appears obvious that PMX data are more reliable than AOD data for the trend analysis due to sampling issues. However, when these issues are artificially overcome, it is important to point out the remarkable agreement in the long-term evolution of the desert dust contribution for all parameters which is obtained here.
10
Given these very last results, the trends were newly calculated with the same method as above, but this time for different periods ending in 2009 where the minimum of desert dust contribution to the annual mean was found for all parameters. The reason for taking several different periods instead of simply calculating the trend back to the be-ginning of the dataset, is to make sure there is consistency between PMX dataset and
15
AOD dataset since one starts a few years earlier than the other. Consequently the trend calculations for PMXdata were not only performed for 2001–2011 and 2001–2009, but also for 2003–2009 and 2003–2011, as shown in Table 6. It is found here, as expected, that there is no inconsistency in PMX when comparing the trend results for the two periods ending in 2011 and starting either in 2001 or 2003. In these cases, for each
20
parameter, the results on both slopes and associated p values are sensibly similar. The same is observed when comparing periods 2001–2009 with 2003–2009, though the slopes are slightly smaller when a fewer number of years is considered. Therefore there is only little influence on the trend calculation when using a dataset starting in 2003 instead of 2001. The trends calculated from the AERONET dataset can thus be
25
AMTD
7, 5829–5882, 2014Long-term AOD-PMX
relationships in north-nentral Spain
Y. S. Bennouna et al.
Title Page
Abstract Introduction
Conclusions References
Tables Figures
◭ ◮
◭ ◮
Back Close
Full Screen / Esc
Printer-friendly Version
Interactive Discussion
Discussion
P
a
per
|
Discus
sion
P
a
per
|
Discussion
P
a
per
|
Discussion
P
a
per
|
account. But the most interesting result is to notice that the trends become more signif-icant when considering periods ending in 2009 as compared to those ending in 2011. Hence, this corroborates again and in another way the existence of a trend inversion in 2009. The best trend estimation considered here corresponds to the most signif-icant decrease with rate values of 0.49 µg m−3year−1, 0.37 µg m−3year−1 and 0.005
5
per year, for PM10, PM2.5 and AOD parameters respectively. Although and as it is the case also for all other parameters, p values are decreasing for PM2.5−10, for periods ending in 2009, the corresponding slopes obtained remain unsignificant in all cases. For PM2.5−10, the lowest p value and the largest slope is found for 2001–2009, with
p=0.19 and s=−0.07. This might be explained by the uncertainty on PM2.5−10
pa-10
rameter, first because the coarse particles represent a very small portion of PM10, and second because the values of PM10recorded at Palencia from which PM2.5−10 values are derived, are often particularly low in a region under such clean conditions (see also below sections). As a result, the values obtained for PM2.5−10 are often close to the limit of detection and therefore subject to large uncertainties.
15
4.3 Relations PM10-PM2.5, PMX-AOD and PM2.5/PM10-Alpha
Figure 8 shows the scatterplot of PM10and PM2.5data measured at Peñausende. Daily PM10 and PM2.5data are strongly associated with a correlation coefficient of 0.87 and a slope of 1.63, due to the rural and remote character of the station. It is also impor-tant here to notice the presence of several isolated points with very high PM10 levels
20
(>50 µg m−3) which correspond to strong desert dust intrusions. The same graph is
shown for the monthly means in Fig. 8b, and an even higher correlation coefficient of 0.93 is found with a similar value of 1.51 for the slope. For the coarse mass fraction in Fig. 8c and d, the correlation and slope results are similar to those obtained for the fine fraction. This graph also shows that a single type of aerosol is likely to contribute
25
AMTD
7, 5829–5882, 2014Long-term AOD-PMX
relationships in north-nentral Spain
Y. S. Bennouna et al.
Title Page
Abstract Introduction
Conclusions References
Tables Figures
◭ ◮
◭ ◮
Back Close
Full Screen / Esc
Printer-friendly Version
Interactive Discussion
Discussion
P
a
per
|
Discus
sion
P
a
per
|
Discussion
P
a
per
|
Discussion
P
a
per
|
as compared to PM2.5, suggests that there is always a remaining fine mode aerosol in the background air.
The relationship between PM10 and AOD is presented in Fig. 9. As expected, these two parameters are found to be moderately correlated (Fig. 9a) with a correlation co-efficient of 0.56 for the daily data lying between the 95 % confidence interval (0.53–
5
0.59). It should be noted that although the linear regression was not constrained to pass through the origin, the value at the origin falls within the error limits of PMX mea-surements. The correlation is improved when considering the monthly means (Fig. 9b) rising up to 0.70. Here, it must be noted that the monthly means were computed us-ing all available daily data from the individual datasets. When these monthly means
10
are calculated using only coinciding days, the obtained results are sensibly the same (R=0.69,Y =58.2X+2.9), and therefore are not affected by the sampling difference in the daily data.
Scatter diagrams of AOD vs. Alpha help to identify the aerosol type referring to the climatological aerosol models e.g. continental, desert, maritime, biomass burning
15
(Eck et al., 1999; Vergaz, 2001). The classification of aerosol types in a given area can be based on different criteria depending on the characteristics of the location, e.g. geographical situation, emission sources (Hess et al., 1998; Dubovik et al., 2002; Vergaz et al., 2005; Toledano et al., 2007a). Figure 10 presents the scatterplot of Alpha (440 nm) vs. AOD (440 nm) for the site of Palencia, both for daily averages in Fig. 10a
20
and c and instaneous measurements (every 15 min) in Fig. 10b, d. In addition, the cor-responding range of PM10 (Fig. 10a and c) and fine-PM ratio (Fig. 10b and d) is also represented by the colorscale. Here the fine-PM ratio refers to the ratio of PM2.5 with respect to PM10. It should be noted that in instantaneous graphs (Fig. 10c and d), for a given day the same value of PMXand PM2.5/PM10ratio is used for each AOD-Alpha
25
AMTD
7, 5829–5882, 2014Long-term AOD-PMX
relationships in north-nentral Spain
Y. S. Bennouna et al.
Title Page
Abstract Introduction
Conclusions References
Tables Figures
◭ ◮
◭ ◮
Back Close
Full Screen / Esc
Printer-friendly Version
Interactive Discussion
Discussion
P
a
per
|
Discus
sion
P
a
per
|
Discussion
P
a
per
|
Discussion
P
a
per
|
As it can be seen, most AOD-Alpha daily averages (65 %) are in the range of 0.0–0.2 and 1.0–2.0 respectively (see also Fig. 12a and d), which are typical of a clean con-tinental area. For low values of the AOD (<0.10), PM10 is generally below 10 µg m−3 (Fig. 10a). The highest values of PM10 (>80 µg m−3) are found for Alpha values below
0.5 and high AODs which correspond to intense desert dust intrusions. As shown in
5
Fig. 10b, these episodes are also associated with the lowest PM2.5/PM10 ratio values (0.3–0.4), which can also be observed for Alpha up to 0.7. For Alpha values above 1, the ratio values are usually above 0.4. However between 0.7 and 1.5, the ratio spans over a wide range of values which probably indicate the presence of mixed-aerosol (Desert–Continental) and aged-desert resulting from recirculation processes. However
10
due to the sparcity of daily data, it is easier to identify the different types of aerosols when looking at the instantaneous plots. In particular, the horizontal branches associ-ated with the desert dust aerosols (in the lower part) and the biomass burning (in the upper part) appear more clearly in Fig. 10c and d. For more details on the distribution of the different types of events over time, these graphs are also provided by years in
15
the Appendix to this paper (Figs. B1 and B2).
In Fig. 11a, both PM10 and PM2.5are represented as a function of the binned AOD at 440 nm, in the interval 0–1 by steps of 0.05, using the 1698 coinciding data. Each point of the curve corresponds to the mean of PMX for a given bin of AOD, and the associated standard deviation is represented by vertical bars. Before commenting the
20
results of this figure, it should be noted that the apparent increase of the fine-PM ratio in the first AOD bin is an artefact of the AERONET data, as AOD values near zero become comparable to the uncertainty of the measurement which is∼0.01 at 440 nm. As it can be seen, PMX increases slowly and regularly as the AOD reaches about 0.2, but above this value small maximums start to appear, one around 0.25 and another at
25
0.4, the highest peak being found for the AOD bin centered at 0.5 with nearly 50 µg m−3
and 25 µg m−3for PM
AMTD
7, 5829–5882, 2014Long-term AOD-PMX
relationships in north-nentral Spain
Y. S. Bennouna et al.
Title Page
Abstract Introduction
Conclusions References
Tables Figures
◭ ◮
◭ ◮
Back Close
Full Screen / Esc
Printer-friendly Version
Interactive Discussion
Discussion
P
a
per
|
Discus
sion
P
a
per
|
Discussion
P
a
per
|
Discussion
P
a
per
|
strong events, as it is the case for that of July 2004 (Cachorro et al., 2008). These results are corroborated by Fig. 11b which is analogous to Fig. 11a but this time with the fine-PM ratio instead of PMX. Indeed, the fine-PM ratio presents minima in the same AOD bin where the maxima are observed for the PMX. For low AODs the fine-PM ratio remains of about 0.6 and drops as low as 0.45 for the AOD bin centered at 0.5. The
5
slight increase in PMX-AOD observed in the previous graph for low AODs is reflected here in the constant part of the ratio independent from the AOD. The fine-PM ratio can reach 0.3 for very high AODs, but as mentioned before, this only reflects the case of extreme desert dust outbreaks. Figure 11a and b allow to underline the problem for AOD values above 0.5, as PMXdata decrease significantly where it would be expected
10
to increase with the AOD. This explains the fact that there is no systematic day-to-day correlation during strong desert dust events due to the different atmospheric scenarios associated to the desert intrusions e.g. dust layer altitude, synoptic conditions and deposition processes.
Figure 11c and d present analogous graphs where the same data are binned
accord-15
ing to Alpha values. Like in the case of AOD binned data, the first points are artefacts of the measurements and must be ignored. As expected, PMX average and standard deviation are the highest for low Alpha values which correspond to the occurrence of desert dust intrusions. PMX data decrease rather monotonically as Alpha values get high and then become stable for Alpha values above around 0.7. These results
high-20
light the anticorrelation AOD-Alpha with that of PMX-Alpha, especially since PMX and AOD data appear better correlated in the absence of desert dust aerosol (AOD<0.5). Conversely, fine-PM ratio increases with increasing Alpha, and it is important to em-phasize on the clear correlation between this two quantities as shown by the nearly monotonical increase of Alpha with increasing values of fine-PM ratio. It can also be
25
AMTD
7, 5829–5882, 2014Long-term AOD-PMX
relationships in north-nentral Spain
Y. S. Bennouna et al.
Title Page
Abstract Introduction
Conclusions References
Tables Figures
◭ ◮
◭ ◮
Back Close
Full Screen / Esc
Printer-friendly Version
Interactive Discussion
Discussion
P
a
per
|
Discus
sion
P
a
per
|
Discussion
P
a
per
|
Discussion
P
a
per
|
In Fig. 12, the same graphs have been produced this time using binned values of AOD and Alpha. This representation allows to characterize statistically PMXdata within a range of AOD-Alpha. Under very clean conditions (AOD<0.1), PM10 values are al-ways below 10 µg m−3with a standard deviation that usually does not exceed 5 µg m−3,
and in general a PM2.5/PM10 ratio in the range of 0.5–0.7 with a standard deviation
5
around 0.15. For moderately clean conditions (0.10<AOD<0.20), PM10 values are slightly higher with values ranging between 10 and 20 µg m−3 and the ratio remains
though in the same range as compared to the extremely clean case. When polluted airmass reach the region (AOD>0.20, α >1.5) and the fine-PM ratio is in general above 0.7.
10
High AOD (>0.20) associated with Alpha values below 0.5 indicates clearly the pres-ence of desert dust aerosol, for which as expected the highest values of PMX are observed over the region, and associated ratio data is often below 0.4. It should be noted that for these cases the ratio values and their associated standard deviations appear quite heterogenous. This is likely due to the delay existing between the
detec-15
tion/observation of a dust episode at the surface and over the entire column. Indeed, when the time series of desert dust episodes are examined in detail, the maximum values of AOD and PMXfor a given event often do not coincide in time.
5 Conclusions
In this study, long-term data of two rural background sites of the north-central region
20
of Spain have been used to relate PMXand AOD. This region is characterized by very clean background conditions affected by the intrusions of desert dust in spring and summer. The climatological annual cycle of PMX present a bimodality which could be strongly influenced by the occurrence of desert dust intrusions over the Iberian Peninsula, taking place mainly in late winter/early spring and in the summer. However
25
AMTD
7, 5829–5882, 2014Long-term AOD-PMX
relationships in north-nentral Spain
Y. S. Bennouna et al.
Title Page
Abstract Introduction
Conclusions References
Tables Figures
◭ ◮
◭ ◮
Back Close
Full Screen / Esc
Printer-friendly Version
Interactive Discussion
Discussion
P
a
per
|
Discus
sion
P
a
per
|
Discussion
P
a
per
|
Discussion
P
a
per
|
data series could also confirm the existence of such a bimodality in the AOD as well. To further investigate the possible causes for this bimodality in the seasonal variations the effect of desert dust must be removed from the the annual cycle, and such a study requires the use of a detailed inventory for desert dust events, this is the object of a paper in preparation.
5
When the interannual variability is examined, it appears that most maxima and min-ima of AOD and PMX coincide. It is also observed that there is a significant variation from one year to another although the shape of the annual cycle is much more stable in the case of PMXas compared to the AOD. The contribution of desert dust to the annual means confirmed the existence of a decrease ending in 2009 for all parameters, while
10
the desert dust apportionment seem to increase again in the last years. This recent increase should be verified in the future with additional years of data. The decreasing trend in PMX had already been detected by other authors not only at Peñausende but also at other sites of Europe but for periods ending in 2010 at the latest, and therefore without taking into account the trend inversion observed here. This work points out the
15
reduction of desert dust apportionment as a non negligible factor for the observed de-crease in PMX in regions affected by desert dust, while previous studies attribute it to consequences of the application of regulation policies and to the european economical crisis of the last six years. The negative trends obtained for PM10, PM2.5and the AOD were all significant except for the coarse part PM2.5−10, for which a decreasing trend
20
was also observed but with no significance. The small values of this parameter which result in subsequent large associated uncertainties can explain such results.
The correlation between PMXand AOD daily data is rather moderate and clearly im-proved when considering monthly means. This may be explained by the poor sampling of sunphotometer data as compared to PMX. The availability of longer data series in
25
AMTD
7, 5829–5882, 2014Long-term AOD-PMX
relationships in north-nentral Spain
Y. S. Bennouna et al.
Title Page
Abstract Introduction
Conclusions References
Tables Figures
◭ ◮
◭ ◮
Back Close
Full Screen / Esc
Printer-friendly Version
Interactive Discussion
Discussion
P
a
per
|
Discus
sion
P
a
per
|
Discussion
P
a
per
|
Discussion
P
a
per
|
surface data are highly correlated and other for which deposition breaks down this cor-relation. However, synergy between surface in situ and columnar remote sensed data demonstrated to provide useful information for the aerosol type characterization, and consistent results have been obtained in that sense when combining primary parame-ters with derived ones such as fine-PM ratio and Ångström exponent.
5
The Supplement related to this article is available online at doi:10.5194/amtd-7-5829-2014-supplement.
Acknowledgements. The authors are grateful to EMEP for providing observations from their network. Special thanks also go to NASA/GSFC, PHOTONS/LOA and RIMA/GOA people for their long-standing collaboration and for operating and maintaining the AERONET-EUROPE
10
network. The research leading to these results has received funding from the European Union Seventh Framework Programme (FP7/2007e2013) under grant agreement Nr. 262254 [ACTRIS]. Financial supports from the Spanish MINECO (projects of ref. CGL2011-23413, CGL2012-33576) are also gratefully acknowledged. We also thank the Environmental Council of the CyL Regional Government (Consejería de Medio Ambiente, Junta de Castilla y León) for
15
supporting this research.
References
Al-Saadi, J., Szykman, J., Pierce, R. B., Kittaka, C., Neil, D., Chu, D. A., Remer, L., Gumley, L., Prins, E., Weinstock, L., Macdonald, C., Wayland, R., Dimmick, F., and Fishman, J.: Improv-ing national air quality forecasts with satellite aerosol observations, B. Am. Meteorol. Soc.,
20
86, 1249–1261, 2005. 5833
AMTD
7, 5829–5882, 2014Long-term AOD-PMX
relationships in north-nentral Spain
Y. S. Bennouna et al.
Title Page
Abstract Introduction
Conclusions References
Tables Figures
◭ ◮
◭ ◮
Back Close
Full Screen / Esc
Printer-friendly Version
Interactive Discussion
Discussion
P
a
per
|
Discus
sion
P
a
per
|
Discussion
P
a
per
|
Discussion
P
a
per
|
Artíñano, B., Querol, X., Salvador, P., Rodríguez, S., Alonso, D. G., and Alastuey, A.: Assess-ment of airborne particulate levels in Spain in relation to the new EU-directive, Atmos. Envi-ron., 35, S43–S53, 2001. 5834
Barmpadimos, I., Keller, J., Oderbolz, D., Hueglin, C., and Prévôt, A. S. H.: One decade of parallel fine (PM2.5) and coarse (PM10–PM2.5) particulate matter measurements in Europe:
5
trends and variability, Atmos. Chem. Phys., 12, 3189–3203, doi:10.5194/acp-12-3189-2012, 2012. 5841
Bennouna, Y., Cachorro, V., Toledano, C., Berjón, A., Prats, N., Fuertes, D., Gonzalez, R., Rodrigo, R., Torres, B., and de Frutos, A.: Comparison of atmospheric aerosol climatologies over southwestern Spain derived from AERONET and MODIS, Remote Sens. Environ., 115,
10
1272–1284, doi:10.1016/j.rse.2011.01.011, 2011. 5839
Bennouna, Y., Cachorro, V., Torres, B., Toledano, C., Berjón, A., de Frutos, A., and Alonso Fernández Coppel, I.: Atmospheric turbidity the annual cycle of aerosol optical depth over north-center Spain with ground (AERONET) and satellite (MODIS) remotely sensed data, Atmos. Environ., 67, 352–364, 2013. 5837, 5838, 5841, 5880
15
Borowiak, A. and De Saeger E.: Harmonization of air quality measurements at European Union level, Analyst, 121, 1247–1248, 1996.
Brown, J. S., Gordon, T., Price, O., and Asgharian, B.: Thoracic and respirable particle def-initions for human health risk assessment, Particle and Fibre Toxicology, 2013, 10–12, doi:10.1186/1743-8977-10-12, 2013. 5832
20
Cachorro, V. E. and Tanre, D.: The correlation between particle mass loading and extinction: application to desert dust aerosol content estimation, Remote Sens. Environ., 60, 187–194, 1997. 5831
Cachorro, V. E., Vergaz, R., de Frutos, A. M., Vilaplana, J. M., Henriques, D., Laulainen, N., and Toledano, C.: Study of desert dust events over the southwestern Iberian Peninsula in year
25
2000: two case studies, Ann. Geophys., 24, 1493–1510, doi:10.5194/angeo-24-1493-2006, 2006. 5833
5834
Cachorro, V., Toledano, C., Prats, N., Sorribas, M., Mogo, S., Berjón, A., Torres, B., Rodrigo, R., De la Rosa, J., and De Frutos, A.: The strongest desert dust intrusion mixed with smoke
30
AMTD
7, 5829–5882, 2014Long-term AOD-PMX
relationships in north-nentral Spain
Y. S. Bennouna et al.
Title Page
Abstract Introduction
Conclusions References
Tables Figures
◭ ◮
◭ ◮
Back Close
Full Screen / Esc
Printer-friendly Version
Interactive Discussion
Discussion
P
a
per
|
Discus
sion
P
a
per
|
Discussion
P
a
per
|
Discussion
P
a
per
|
Cachorro, V., Burgos, M. A., Bennouna, Y., Toledano, C., Herguedas, A., González Orcajo, J., and de Frutos, A. M.: Inventario del Aerosol Desértico en la Región de Castilla y León (2003– 2012), in: Proceedings of the 1st Iberian Meeting Aerosol Science and Technology (RICTA) 2013, (ISBN: 978-989-20-3962-6), 2013. 5838, 5842
Coz, E., Gómez-Moreno, F. J., Pujadas, M., Casuccio, G. S., Lersch, T. L., and Artíñano, B.:
5
Individual particle characteristics of North African dust under different long-range transport scenarios, Atmos. Environ., 43, 1850–1863, 2009. 5834, 5836
Cusack, M., Alastuey, A., Pérez, N., Pey, J., and Querol, X.: Trends of particulate matter (PM2.5)
and chemical composition at a regional background site in the Western Mediterranean over the last nine years (2002–2010), Atmos. Chem. Phys., 12, 8341–8357,
doi:10.5194/acp-12-10
8341-2012, 2012. 5831, 5841
Dayan, U. and Miller, J.: Meteorological and Climatological Data From Surface and Upper Air Measurements for the Assessment of Atmospheric Transport and Deposition of Pollutants in the Mediterranean Basin: a Review, Tech. rep., Map technical Reports Series, vol. 30 UNEP, WMO (1989), 137 pp., 1989. 5838
15
Del Rio, S., Fraile, R., Herrero, L., and Penas, A.: Analysis of recent trends in mean maximum and minimum temperatures in a region of the NW of Spain (Castilla y León), Theor. Appl. Climatol., 90, 1–12, 2007. 5835
Dubovik, O., Holben, B., Eck, T. F., Smirnov, A., Kaufman, Y. J., King, M. D., Tanré, D., and Slutsker, I.: Variability of absorption and optical properties of key aerosol types observed in
20
worldwide locations, J. Atmos. Sci., 59, 590–608, 2002. 5846
EC: Directive 1999/30/EC of the European Parliament and of the Council (22 April 1999) re-lating to limit values for sulphur dioxide and oxides of nitrogen, PM and lead in ambient air, Official Journal of the European Communities, L 163, 41–60, 1999. 5832
EC: Directive 2008/50/EC of the European Parliament and of the Council (21 May 2008) on
Am-25
bient Air Quality and Cleaner Air for Europe, Official Journal of the European Communities, L 151, 1–44, 2008. 5831, 5832
Eck, T., Holben, B., Reid, J., Dubovik, O., Smirnov, A., O’Neill, N., Slutsker, I., and Kinne, S.: Wavelength dependence of the optical depth of biomass burning, urban, and desert dust aerosols, J. Geophys. Res., 104, 31333–31349, 1999. 5837, 5846
30
AMTD
7, 5829–5882, 2014Long-term AOD-PMX
relationships in north-nentral Spain
Y. S. Bennouna et al.
Title Page
Abstract Introduction
Conclusions References
Tables Figures
◭ ◮
◭ ◮
Back Close
Full Screen / Esc
Printer-friendly Version
Interactive Discussion
Discussion
P
a
per
|
Discus
sion
P
a
per
|
Discussion
P
a
per
|
Discussion
P
a
per
|
http://www.nilu.no/projects/ccc/manual/index.html (last access: 10 March 2014), 1996. 5836
EMEP: EMEP/CCC-Report 4/11, EMEP Transboundary Particulate Matter in Eu-rope Status report 2011, Norwegian Institute for Air Research, available at: http://www.nilu.no/projects/ccc/reports/emep4-2011.pdf (last access: 10 March 2014),
5
2011. 5831
Escudero, M., Castillo, S., Querol, X., Avila, A., Alarcón, M., Viana, M., Alastuey, A., Cuevas, E., and Rodríguez, S.: Wet and dry African dust episodes over eastern Spain, J. Geophys. Res., 110, D18208, doi:10.1029/2004JD004731, 2005. 5834, 5838
Escudero, M., Querol, X., Ávila, A., and Cuevas, E.: Origin of the exceedances of the European
10
daily PM limit value in regional background areas of Spain, Atmos. Environ., 41, 730–744, 2007. 5834, 5838
Estellés, V., Martínez-Lozano, J. A., Pey, J., Sicard, M., Querol, X., Esteve, A. R., Utril-las, M. P., Sorribas, M., Gangoiti, G., Alastuey, A., and Rocadenbosch, F.: Study of the correlation between columnar aerosol burden, suspended matter at ground and
chemi-15
cal components in a background European environment, J. Geophys. Res., 117, D04201, doi:10.1029/2011JD016356, 2012. 5833
Galindo, N., Gil-Moltó, J., Varea, M., Chofre, C., and Yubero, E.: Seasonal and interannual trends in PM levels and associated inorganic ions in southeastern Spain, Microchem. J., 110, 81–88, 2013. 5831
20
Goloub, P., Cachorro, V., Cuevas, E., Blarel, L., Berjón, A., Toledano, C., Podvin, T., Lapionack, A., Guirado, C., Ramos, R., González, R., and Fuertes, D.: The AERONET-Europe calibration facility: access within the ACTRIS project, in: Proceeding of the European Aerosol Confer-ence (EAC 2012), Granada, Spain, 2012. 5836
Harrison, R. M. and Yin, J.: Particulate matter in the atmosphere: which particle properties are
25
important for its effects on health?, Sci. Total Environ., 249, 85–101, 2000. 5831
Hess, M., Koepke, P., and Schult, I.: Optical properties of aerosols and clouds: the software package OPAC, B. Am. Meteorol. Soc., 79, 831–844, 1998. 5846
Higgins, D. and Wickman, T.: Air Resource Report For the NW Sands Project, 2009. 5831 Hirsch, R. M. and Slack, J. R.: A nonparametric trend test for seasonal data with serial
depen-30
dence, Water Resour. Res., 20, 727–732, 1984. 5841