Abstract— This paper presents an indoor propagation model that uses image-based ray-tracing with a quasi-3D approach. A fast 2D algorithm finds the most relevant rays lying in the horizontal plan of the indoor environment. Then, every path is converted into five rays that lie in the vertical plane. As a consequence, the third-dimension effect is considered in the field computation. Comparisons were made with measurements for a typical indoor scenario and the quasi-3D approach results showed to be as good as the results obtained by a full 3D ray-tracing tool. With this approach, it is possible to have a computational cost comparable to that of a 2D algorithm, without significant impairment in the accuracy compared to results obtained with a 3D tool.
Index Terms—Indoor propagation, quasi-3D, ray-tracing.
I. INTRODUCTION
With the impressive growth in wireless systems due to the new generation technologies, the need
for a suitable design before their implantation becomes essential. Hence, the use of an electromagnetic
prediction model represents an important design procedure.
Ray-tracing models using Geometrical Optic (GO) and Uniform Theory of Diffraction (UTD)
present good results both in indoor and outdoor urban environments [1]-[5]. It is worth to point out
that, in indoor scenarios, it is common to use ray-tracing models neglecting diffraction [6], [7].
Two-dimensional models have been an interesting option, providing good results for certain scenarios.
However, in general, these 2D models yield large errors due, for example, to height differences
between transmitting and receiving antennas.
This paper presents a quasi-3D ray-tracing model valid for indoor environment, which we named
RTQ3D-indoor. This algorithm uses the Method of Images to find all paths on the horizontal plane
and to convert each 2D trajectory into five quasi-3D rays lying in the vertical plane.
The environment description in RTQ3D-indoor model relies on horizontal plan data, but
considering also transmitting and receiving antennas heights as well as roof height from the ground.
The rays in horizontal plane are traced considering a specific procedure for transmitted rays though
walls [6]. Reflections up to second-order are also considered on the horizontal plane. On the vertical
plane, this algorithm considers not only the first-order reflection in the ground, but also the ceiling
reflection. The second-order reflections (roof-ground and ground-roof reflections) are also taken into
account.
An efficient indoor ray
-
tracing propagation
model with a
quasi
-
3D approach
Stevan Grubisic
Agência Nacional de Telecomunicações, [email protected] Walter Pereira Carpes Jr
The following section presents the proposed algorithm. The RTQ3D-indoor model validation is
presented in section III by comparisons with full 3D RT model and with measurements [1], [11] in
typical indoor scenarios. Finally, Section IV presents a brief conclusion of this paper.
II. THE RTQ3D-INDOOR MODEL
Firstly, the RTQ3D-indoor model uses 2D ray-tracing algorithm based on the Theory of Images for
build a "tree of images" and find the various reflected rays for a given scenario. Thus, the input
database is described in the horizontal plane, but adding the ceiling height from the floor and the
transmitting (base stations) and receiving (user terminals) antennas heights.
To consider the transmission rays through the obstacles (walls, doors, windows, etc.), the model
adopts the approach proposed in [6]. This approach takes into account the shift due to the double
refraction (air-obstacle-air) occurred when a ray crosses an obstacle. It allows accurate transmitted
field computation.
As other ray-tracing models applied to indoor applications [7], the proposed RTQ3D-indoor
algorithm neglects diffractions in the total field computation. Additionally, the model considers up to
second-order reflections. It allows increasing ray-tracing speed without significant loss of accuracy.
Indeed, higher-order reflections contribute little to the total field (since they correspond to fields that
undergo greater attenuation), but greatly increase the computational cost. Moreover, the significant
decreasing in the number of intersections tests during the ray-tracing calculation is done by using an
acceleration technique, namely, Space Volumetric Partitioning (SVP) [1], [8], [13].
For two-dimensional conversion of trajectories in paths closer to reality, it is common to use
quasi-3D strategies. In these cases, 2D rays (in the horizontal plane) are also considered in a vertical plane.
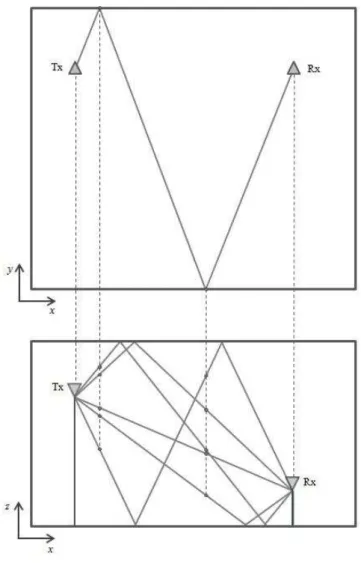
Fig. 1 shows an example of converting a 2D trajectory to a quasi-3D, as presented in [9]. A single
propagation ray in the horizontal plane – which can suffer reflection (r), diffraction (D) and other
reflection (r) – has two 3D paths: the direct path and a ground-reflected path. Thus, each horizontal
path is converted into two ones lying in the vertical plane: the direct path and the path reflected on the
ground.
Fig. 1. Example of converting a 2D path into two quasi-3D paths [4], [9].
In [10], a similar approach (2.5D model) is applied to indoor environments, but adopting the
describe the indoor environments phenomena, since the ceiling reflections are as important as the
reflections in the ground. In [12], the authors have proposed a quasi-3D indoor prediction model that
also uses Image Theory Ray-Tracing method, but they have not detailed the construction of quasi-3D
rays and how the exact or approached path of transmitted rays through walls (due to double
refraction) is considered. The authors of [12] underscore that their quasi-3D model took just 1% of the
computational time compared to a traditional full 3D model.
To extend the quasi-3D analysis using the method of images to indoor environments and adopting
an efficient transmitted rays through wall consideration (due to double refraction) [6], the
RTQ3D-indoor algorithm is now presented. Since its application is in RTQ3D-indoor environments – and given the
considerations of the transmitting antenna height, receiving antenna height and ceiling height from the
ground – this algorithm takes into account not only the first-order ground reflections, but also the
ceiling reflections. Additionally, from vertical plane viewpoint, the proposed model also considers
second-order reflections: ceiling-ground and ground-ceiling ones (see Fig 2b).
According to the example of Fig. 2, the ray-tracing algorithm applied on quasi three-dimensional
indoor environments (RTQ3D-indoor) converts a given path initially obtained from the RT 2D
algorithm in five trajectories:
(i) direct path (from the viewpoint of a vertical plane);
(ii) the ground reflected path;
(iii) the ceiling reflected path;
(iv) the path reflected on the ground and on the ceiling; and
(v) the path reflected first on the ceiling and then on the ground.
In fact, the paths obtained by the 2D algorithm are the 3D actual path projections on the horizontal
plane. Thus, all the reflection angles initially obtained by the 2D algorithm must be properly
corrected. For that, we take into account the slope angle of all the new five paths, in order to avoid
errors, for example, in the calculation of reflection and transmission coefficients. It is worth also
mentioning that obstacles are interpreted by the algorithm as having the same height (ground-ceiling)
and being perpendicular to the ground, which represents a limitation when compared with a full 3D
model.
Once all the rays are traced, from Geometric Optics we obtain an approximated solution of the total
field at a reception point by adding the fields due to all the rays. Therefore, the electric field in a given
reception point (due to rays leaving from a transmitter and reaching the considered reception point) is
given by: o k k i i s j s
R Ae T E
E
(1)where As = ρ / (s + ρ) is the spreading factor for a spherical wave; s is the total distance (in air) of the
path from a reference point to the reception point; ρ is the distance between the transmitter and the
reference point; Eo is the electric field calculated at the reference point considering a propagation in free space (in the far field region); βsis the total phase shift along the propagation path in air; Γi is the
reflection coefficient matrix due to the i-th reflection and Tk is the transmission coefficient due to k-th
transmission of the ray (considering the propagation through the obstacles [6]). These coefficient
matrices take into account the components of vertical and horizontal polarization. Hence, not only the
amplitude and phase, but also the polarization is considered on total field computation, obtained by
field contributions due to relevant rays.
III. RESULTS
To validate the RTQ3D-indoor algorithm, comparisons are made in a typical indoor scenario as
presented in subsection A. In subsection B, we have applied our model in order to illustrate a
A. Comparison and validation
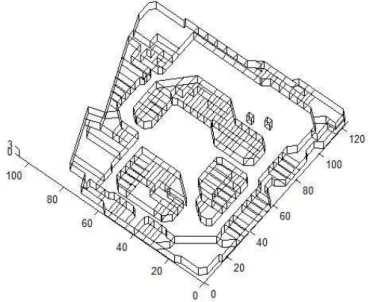
We analyzed the real indoor scenario presented in [1], [11], whose 3D view is shown in Fig. 3. The
geometric and electromagnetic characteristics of the environment are used as input to the
RTQ3D-indoor algorithm. According to [1], the walls have the same electrical properties (εr = 4.44,
σ = 0.08 S/m, and μr = 1.0) and the height from ground to ceiling is 2.9 m.
Fig. 3. Three-dimensional view of the indoor scenario.
Fig. 4 shows the floor plan with the respective measurement routes that are adopted to make
comparisons. Only this floor is considered in the simulation. As noted in [1], such routes are properly
distributed to enable a field evaluation under both line-of-sight (LOS) and non-line-of-sight (NLOS)
conditions. Then, this scenario allows assessing the influence of transmitted rays through obstacles on
the computed fields.
For routes 1 to 3, the transmitter is positioned at the point “Tx1”, and for routes 4 and 5, the
transmitter was located at “Tx2”. As described in [1], the transmitting antenna is vertically polarized
and its radiation pattern (E-plane and H-plane) is shown in Fig. 5. The antennas at reception points are
simulated as vertically polarized short dipoles. In all cases, the transmitting antenna (base station) is
located at 1.7 m of above the ground and the receiving antennas (along the evaluation routes) are
located at 0.6 m height.
Fig. 5. Transmitting antenna radiation pattern.
As in [1], for simulations where the transmitter is positioned at the point Tx1, the transmitting
antenna is oriented with direction of maximum radiation pointed to + x, while for the simulations that
the transmitter is placed in Tx2, the antenna is pointed at the –z direction. These features are included
as input data of the RTQ3D-indoor simulation.
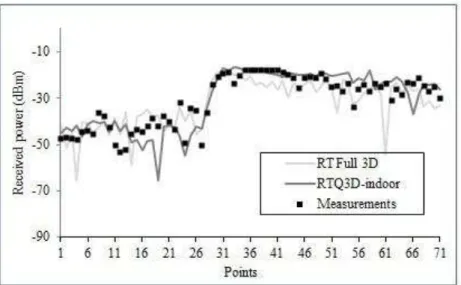
The results for each route are shown in Fig. 6 to Fig. 10. These figures show the comparisons
between measurements and simulations using a full 3D RT model, both presented in [1], with the
results obtained with the proposed RTQ3D-indoor algorithm.
Fig. 7. Results corresponding to evaluation along route n° 2.
Fig. 8. Results corresponding to evaluation along route n° 3.
These results demonstrate the validity of the RTQ3D-indoor developed tool. Indeed, the results
obtained through the RTQ3D-indoor model agree well with the measurements and are as good as the
results obtained with a full RT 3D model.
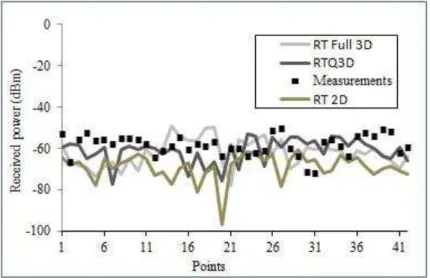
To illustrate the error that can be generated when the 3D effects are not considered, Fig. 10 (relating
to route 5) shows also the results obtained using a two-dimensional ray-tracing algorithm (2D RT).
Clearly, the use of the 2D RT algorithm presents higher deviations from the measurements.
Fig. 10. Results corresponding to evaluation along route n° 5.
TABLE I.MEANERRORANDSTANDARDDEVIATIONFORTHECONSIDEREDROUTES.
Route RT full 3D RTQ3D-indoor Error (dB) SD (dB) Error SD (dB)
1 -1,37 7,04 0,35 6,02 2 1,65 7,96 -3,96 7,01 3 3,38 6,79 -3,84 7,04 4 -1,66 7,29 3,67 6,57 5 -3,59 8,33 -2,44 7,91
Table I presents comparative numerical values, confirming the validity of the RTQ3D-indoor
algorithm for this type of environment. In order to compare the results, we use the same quantities
presented in [1]: the mean error and the standard deviation (SD), both in dB. For the RT 2D
simulation, performed only for route 5, the values obtained for mean error and standard deviation are
10.23 dB and 8.18 dB, respectively.
B. Illustration in a practical scenario
A practical scenario, presented in Fig. 11, was used to illustrate the capacity of the RTQ3D-indoor
Fig. 11. View of the practical indoor environment.
This scenario represents the third floor of a large shopping mall located in the city of Florianopolis,
Brazil. The analysis was performed considering a single floor, which has about 10,000 m2. As a result of the prediction, it was obtained the received power color mappings for the frequencies 900 MHz and
2100 MHz, as shown in Fig. 12 and Fig. 13, respectively.
Fig. 13. Received power mapping for 2100 MHz.
IV. CONCLUSION
This paper presents an electromagnetic prediction model for indoor environments based on
quasi-3D ray-tracing method. Its validation relies on comparisons with measurements as well as a full quasi-3D
ray-tracing algorithm results from literature. The results are very consistent compared to those
obtained with a full 3D RT, but with a much lower computational cost, since the computation time of
RTQ3D-indoor was similar to that of a 2D algorithm. Wave propagation predictions were made for a
real indoor environment and the received power mappings were presented.
We conclude that the presented method can be an effective tool in the design of indoor wireless
systems. One possible application would be, for example, the use of the proposed method in
combination with an optimization method to find the best antenna placement in an indoor scenario, in
order to get a more uniform illumination, reducing shadow areas [14].Finally, it is worth noting that
ray-tracing method is used to perform electromagnetic predictions at a given frequency. This is not an
issue, since narrowband analysis have been traditionally used to coverage prediction. Nevertheless,
ray-tracing method can be easily used to broadband channels evaluation [15] when necessary.
REFERENCES
[1] Cátedra, M. F.; Arriaga, J. P. Cell Planning for Wireless Communications. Artech House, Mobile Communications Series, 1999.
[2] G. Koutitas, T. Samaras, “Exposure Minimization in Indoor Wireless Networks”, IEEE Antennas and Wireless Propagation Letters, vol. 9, pp. 199-202, 2010.
[3] G. Liang, H. L. Bertoni, “A new approach to 3-D ray tracing for propagation prediction in cities”, IEEE Transactions on Antennas and Propagation, vol. 46, No 6, p. 853-863, June 1998.
[4] D. N. Schettino, F. J. S. Moreira and C. G. Rego, “Efficient Ray Tracing for Radio Channel Characterization of Urban Scenarios,” IEEE Transactions on Magnetics, vol. 43, No 4, pp. 1305-1308, April 2007.
[6] S. Grubisic, W. P. Carpes Jr., C. B. Lima, P. Kuo-Peng, “Ray-Tracing Propagation Model Using Image Theory with a New Accurate Approximation for Transmitted Rays through Walls”, IEEE Transaction on Magnetics, vol. 42, No 4, pp. 1906-1911, April 2006.
[7] C. F. Yang, B. C. Wu, C. J. Ko, “A Ray-Tracing Method for Modeling Indoor Wave Propagation and Penetration”, IEEE Transactions. on Antenna and Propagation, vol. 46, No 6, pp. 907-919, June 1998.
[8] A. Fujimoto, C. G. Perrott, K. Iwata, “ARTS: Accelerated Ray-Tracing System”, IEEE Computer Graphics and Application, Vol. 6, No. 4, pp. 16-26, April 1986.
[9] H. W. Son, N. H. Myung, “A Deterministic Ray Tube Method for Microcellular Wave Propagation Prediction Model”, IEEE Transactions on Antennas and Propagation, vol. 47, No 8, pp. 1344-1350, August 1999.
[10]F.A. Alves et al., “Efficient ray-tracing method for indoor propagation prediction”, Microwave and Optoelectronics SBMO/IEEE MTT-S International Conference - IMOC, pp. 435-438, July 2005.
[11]F. S. Adana, O. G. Blanco, I. G. Diego, J. P. Arriaga, M. F. Cátedra, “Propagation Model Based on Ray Tracing for the Design of Personal Communication Systems in Indoor Environments”, IEEE Transaction on Vehicular Technology, Vol. 9, No. 6, pp. 2105-2112, November 2000.
[12]Z. Ji, B. Li and H. Wang et al., "Efficient ray-tracing methods for propagation prediction for indoor wireless communications," IEEE Antennas and Propagation Magazine, vol. 43, no. 2, pp. 41 - 49, Apr. 2001.
[13]A. S. M. Z. Kausar, A. W. Reza, K. A. Noordin, Md. Jakirul Islam, and H. Ramiah, “An Optimized Binary Space Partitioning Algorithm for Designing Indoor Wireless Radio Network”, Advances in Electrical and Computer Engineering. Vol. 13, No. 4, 103-110, 2013.
[14]S. Grubisic, W. P. Carpes Jr., J.P.A. Bastos, “Optimization Model for Antenna Positioning in Indoor Environments Using 2-D Ray-Tracing Technique Associated to a Real-Coded Genetic Algorithm”, IEEE Transactions on Magnetics, vol. 45, No 3, pp. 1626-1629, March 2009.
![Fig. 1 shows an example of converting a 2D trajectory to a quasi -3D, as presented in [9]](https://thumb-eu.123doks.com/thumbv2/123dok_br/18887922.424277/2.892.315.577.866.1039/fig-shows-example-converting-d-trajectory-quasi-presented.webp)