www.biogeosciences.net/9/4071/2012/ doi:10.5194/bg-9-4071-2012
© Author(s) 2012. CC Attribution 3.0 License.
Biogeosciences
Northern peatland carbon stocks and dynamics: a review
Z. C. Yu
Department of Earth and Environmental Sciences, Lehigh University, 1 West Packer Avenue, Bethlehem, PA 18015, USA
Correspondence to: Z. C. Yu (ziy2@lehigh.edu)
Received: 15 March 2012 – Published in Biogeosciences Discuss.: 26 April 2012
Revised: 13 September 2012 – Accepted: 24 September 2012 – Published: 22 October 2012
Abstract. Peatlands contain a large belowground carbon (C)
stock in the biosphere, and their dynamics have important implications for the global carbon cycle. However, there are still large uncertainties in C stock estimates and poor un-derstanding of C dynamics across timescales. Here I review different approaches and associated uncertainties of C stock estimates in the literature, and on the basis of the litera-ture review my best estimate of C stocks and uncertainty is 500±100 (approximate range) gigatons of C (Gt C) in north-ern peatlands. The greatest source of uncertainty for all the approaches is the lack or insufficient representation of data, including depth, bulk density and carbon accumulation data, especially from the world’s large peatlands. Several ways to improve estimates of peat carbon stocks are also discussed in this paper, including the estimates of C stocks by regions and further utilizations of widely available basal peat ages.
Changes in peatland carbon stocks over time, estimated using Sphagnum (peat moss) spore data and down-core peat accumulation records, show different patterns during the Holocene, and I argue that spore-based approach under-estimates the abundance of peatlands in their early histo-ries. Considering long-term peat decomposition using peat accumulation data allows estimates of net carbon seques-tration rates by peatlands, or net (ecosystem) carbon bal-ance (NECB), which indicates more than half of peat car-bon (>270 Gt C) was sequestrated before 7000 yr ago during the Holocene. Contemporary carbon flux studies at 5 peat-land sites show much larger NECB during the last decade (32±7.8 (S.E.) g C m−2yr−1) than during the last 7000 yr (∼11 g C m−2yr−1), as modeled from peat records across northern peatlands. This discrepancy highlights the urgent need for carbon accumulation data and process understand-ing, especially at decadal and centennial timescales, that would bridge current knowledge gaps and facilitate compar-isons of NECB across all timescales.
1 Introduction
Northern peatlands developed mostly after the last deglacia-tion in the circum-Arctic region and represent one of the largest carbon pools in the biosphere. Their dynamics have played an important role in the global carbon cycle during the Holocene (Gorham, 1991; Yu, 2011), and it has become essential to include peatlands in the modeling and analysis of the global carbon cycle to constrain the changes in other carbon reservoirs (Brovkin et al., 2002; Kleinen et al., 2010; Menviel and Joos, 2012) and in the discussion of relative roles of anthropogenic and natural processes (Ruddiman et al., 2011). However, there are very different estimates of peat carbon stocks in the literature (e.g., Gorham, 1991; Turunen et al., 2002). Also, little is known about the sequestration history of peatland carbon stocks. Documenting and under-standing the total carbon stocks and their accumulation his-tories will help project and understand possible surprise and changes of peatlands in the future (Moore, 2002; Frolking et al., 2011; Yu et al., 2011).
sequestration rates with contemporary NECB from several peatland carbon flux sites and emphasize the lack of data and understanding of peatland carbon dynamics at decadal and centennial timescales. In the last Sect. 5, I highlight some fu-ture research directions and activities that will facilitate the understanding of peatland carbon dynamics.
2 Total carbon stocks in northern peatlands
2.1 Approaches
Three approaches have been used to estimate carbon stocks in peatlands: peat volume, carbon density and time history approaches (Table 1). All these approaches require informa-tion on present peatland area. The peat volume approach fo-cuses on estimates of mean peat depth in order to derive the total peat volume (along with peatland area), and then uses bulk density and carbon proportion (carbon concentration) data to convert volume to mass and carbon (e.g., Gorham, 1991). The carbon density approach requires similar data, but focuses on estimating total carbon content of unit area (that is, soil carbon density) and then derives total carbon stocks by multiplying peatland area and soil carbon den-sity (Armentano and Menges, 1986). This is a commonly used approach, also called “paint-by-number” approach, to empirically estimate carbon stocks of other ecosystem types (biomes) and of terrestrial biosphere as a whole (Schlesinger, 1977). Bulk density and carbon concentration data are de-rived from peat/soil profiles (pedons) to certain depth (often-times the top 1 m) to calculate carbon density. The time his-tory approach relies on data from carbon accumulation rates (carbon accumulated in unit area per year as derived from individual peat cores) and peatland areas over time to first calculate carbon stocks at each time interval and then sum up all time intervals for total carbon stocks. The time history approach is the only approach explicitly using multiple ages from individual peatlands (Yu et al., 2010), though Turunen et al. (2002) used mean peat ages for extrapolation of Finnish data to northern peatlands (see below).
All these approaches can be first applied to a peatland region or a type of peatland region, and then sum up data from different peatland types and regions for the total carbon stocks. However, oftentimes due to lack of detailed regional data many studies lumped all regions together for a single es-timate of carbon stocks in northern peatlands. For example, Gorham (1991) used area-weighted depth and bulk density data from different major peatland regions to estimate a sin-gle mean peat depth and average bulk density for estimating total carbon stocks of northern peatlands using the peat vol-ume approach. In the applications of the carbon density ap-proach, most studies used a single value for carbon density (e.g., Schlesinger, 1977; Lappalainen, 1996), while Armen-tano and Menges (1986) estimated carbon density values for peatlands in different regions and then summed up for all
northern peatlands. Yu et al. (2010) only presented a single estimate of carbon stocks and history using average accumu-lation rates and peatland area change at every 1000-yr inter-val over the Holocene for the entire northern peatlands. Ta-ble 1 shows the equations used in different approaches, the required data, and examples from the literature.
2.2 Carbon stock estimates and uncertainties
Several peatland carbon stock estimates have been published using the peat volume approach. Sj¨ors (1980) provided one of the first estimates of peatland carbon stocks using highly rounded and approximate values for peatland area, depth and bulk density. Sj¨ors (1980) estimated carbon stocks of 300 Gt C (gigatons of carbon) in northern peatlands (Table 2). Gorham’s (1991) estimate of 455 Gt C is the most widely cited figure for carbon stocks in northern peatlands. This es-timate is more than double the eses-timate made a year ear-lier by the same author (Gorham, 1990), mostly owing to the use of the revised and higher values for mean depth of 2.3 m and bulk density of 0.112 g cm−3 in Gorham (1991). On the basis of the detailed peatland inventory data from Fin-land (M¨akil¨a, 1994), Turunen et al. (2002) indicated that the mean depth and bulk density values used by Gorham (1991) were too high, and they estimated a total carbon stock of 270–370 Gt C in northern peatlands by extrapolating Finnish data. However, peatlands in Finland only represent a car-bon stock of 2.3 Gt C – it is much too small a peatland re-gion to be representative of the entire northern peatlands. Bulk density values from other large peatland regions are higher than the mean bulk density of 0.078–0.091 g cm−3
Table 1. General equations of different approaches for estimating peatland carbon stocks.
Approach Equation Example Note
Peat volume approach Cpeat=P i
(Ai×Di×BDi×CCi) Vitt et al. (2000); Turunen et al. (2002); and Sheng et al. (2004) for regional C stock estimates
Sj¨or (1980) and Gorham (1990, 1991) used one set of values for all northern peatlands (that is, a special case wheni=1) Carbon density approach Cpeat=P
i
(Ai×CDi) Armentano and Menges (1986) (for different peatland regions); Bridgham et al. (2006) (for different types of wetlands, including peatlands, in North America)
Schlesinger (1977) and Lappalainen (1996) for all peatlands wheni= 1
Time history approach Cpeat=P j
(Aj×CRj) Yu et al. (2010) Yu et al. (2010) used 1000-yr bins for calculating C rates (CR) and C stocks
Notes:Cpeat: peat carbon stocks;i: peatland region, or peatland type;j: time period;AiorAj: peatland area in regioni, for peatland typei, or during time periodj;Di: mean
peat depth for peatland region or typei;BDi: mean peat bulk density for peatland region or typei;CCi: mean carbon content for peatland region or typei;CDi: carbon density
for peatland region or typei;CRj: mean carbon (accumulation) rates during the time periodj.
Table 2. Estimates of northern peatland carbon stocks by different authors.
# Authors Year Area Depth Bulk Carbon Carbon Basal Carbon Carbon Note used (m) density proportion density ages accumulation stock (×106 (g cm−3) (kg C m−2) (cal years rates (Gt C)
km2) BP) (g C m−2yr−1) (range)
Peat volume approach
1 Sj¨ors 1980 4 >1 >0.1 0.5 300 The estimate is not different from Sj¨ors (1981)
2 Gorham 1990 3.84 1.13–1.74 0.0784 0.528 180–227
3 Gorham 1991 3.42 2.3 0.112 0.517 455 Based on data from former USSR, Canada, USA
and Fennoscandia 4 Turunen et al. 2002 3.46 1.1 0.081–0.091 0.5 4200 18.5 270–370 Estimates for northern
peatlands were extrapo-lated from Finnish data shown here Carbon density approach
5 Schlesinger 1977 2 68.8 137 Top 1 m peat 6 Post et al. 1982 2.8 72.3 202 Top 1 m peat; data
were from Schlesinger (1984)
7 Armentano and Menges 1986 3.49 1 0.147 (0.12–0.29) 0.5 73.4 256 Top 1 m peat; area-weighted bulk density, C density and total C pools are calculated from their Table 1; carbon proportion is assumed 8 Oechel 1989 1.1 113.6 125 Only for boreal
peatlands
9 Lappalainen 1996 3.985 58.7–63 234–252 Global peatlands for C stocks, but area for northern peatlands 10 Adams and Faure 1998 2.43 2 for biomass 466 Assuming 46 Gt C increase per kyr in the Holocene Time history approach
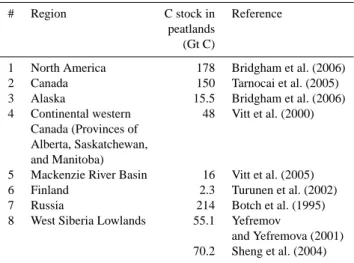
depth in West Siberia (the largest peatland basin in the world) is more than 2 m (Sheng et al., 2004). All these recent depth estimates from these large peatland regions are much deeper than Finnish peatlands of 1.1 m used in Turunen et al. (2002). These regions also contain much larger carbon stocks (Ta-ble 3), 16 Gt C in the Mackenzie River Basin (Vitt et al., 2005), 48 Gt C in continental western Canada (Vitt et al., 2000), and 70.2 Gt C in West Siberian Lowlands (Sheng et al., 2004). Thus, very likely the estimate of 270–370 Gt C in carbon stocks of northern peatlands by Turunen et al. (2002) is an underestimate.
As indicated above, the carbon density approach is one of the common approaches used for scaling up carbon stocks for different biomes based on the average or representative carbon density value. Carbon stock estimates for wetlands or peatlands were often done as part of global soils or ecosys-tem carbon stock estimates (Schlesinger, 1977; Post et al., 1982; Adams and Faure, 1998). Also, most of the available global soil survey data are for the top 1 m of soil carbon den-sity (e.g., GSDTG, 2000), so this often results in significant underestimates of carbon density and total carbon stocks (Ta-ble 2). The estimation of carbon stocks of 234–252 Gt C es-timated by Lappalainen (1996) is one of the most recent esti-mates using the carbon density approach in a study focusing only on peatlands, but it is surprisingly low, likely due to the very low soil carbon density value (58.7–63 kg C m−2)used by Lappalainen (1996), which is even lower than the ones only for the top 1 m soils/peat in other studies using the car-bon density approach (Table 2). Another factor for very low estimates in most studies using the carbon density approach is the small peatland area used (e.g., Schlesinger, 1977; Post et al., 1982; Oechel, 1989). The estimate of 466 Gt C by Adams and Faure (1998) is not really an estimate using the carbon density approach (they only indicated a vegetation biomass carbon density of 2 kg C m−2), but they used an as-sumed rate of peat carbon stock buildup at 46 Gt C kyr−1 since the beginning of the Holocene. Another estimate for only part of the peatland domain is from soil survey (pe-don/soil profile) data for circum-Arctic permafrost regions by Tarnocai et al. (2009), which estimated carbon stocks of 280 Gt C in peatlands of permafrost regions.
The time history approach relies on peatland development histories to estimate total carbon stocks during the Holocene and beyond. Yu et al. (2010) provided a first estimate of peat-land carbon stocks using dated carbon accumulation records and the peatland area change over time as derived from basal ages. They calculated mean carbon accumulation rates for each 1000-yr bin during the Holocene from 33 dated peat profiles across northern peatlands (Fig. 1c; Yu et al., 2009). Also, they derived a first approximation of peatland area change over time at 1000-yr intervals (Fig. 1b) using the 1516 basal peat ages across the northern peatland domain (Fig. 1a; MacDonald et al., 2006), under the assumption that the expansion rates of individual peatlands were constant, or peatland area has increased linearly, since their peatland
Peat basal ag
e f
req
uenc
y
0 20 40 60
80 MacDonald (n=1516)MGK database (n=2577)
Accumulation r
a
te (
g
C
m
- 2 yr -1)
10 15 20 25
30 C Northern peatlands
(n=33)
A
Peatl
a
nd ar
ea (
x
10
6 km 2)
0 1 2 3 4
Age (cal year BP)
0 2000 4000 6000 8000 10000 12000
Cumulativ
e
car
bon st
ock
s
(
G
tC
)
0 100 200 300 400 500
Cumulative NCP (observed) Cumulative NCB (modeled) Gajewski et al. (2001)
P
e
at
carb
o
n
pe
r ky
r (Gt
C
)
0 20 40 60 80 100 Net C pool (NCP)
Net C balance (NCB)
B
D
E
Table 3. Estimates of carbon stocks in peatlands of different re-gions.
# Region C stock in Reference
peatlands (Gt C)
1 North America 178 Bridgham et al. (2006)
2 Canada 150 Tarnocai et al. (2005)
3 Alaska 15.5 Bridgham et al. (2006)
4 Continental western 48 Vitt et al. (2000)
Canada (Provinces of Alberta, Saskatchewan, and Manitoba)
5 Mackenzie River Basin 16 Vitt et al. (2005)
6 Finland 2.3 Turunen et al. (2002)
7 Russia 214 Botch et al. (1995)
8 West Siberia Lowlands 55.1 Yefremov
and Yefremova (2001)
70.2 Sheng et al. (2004)
initiation and formation (Yu et al., 2010; Yu, 2011). Yu et al. (2010) estimated a carbon stock of 547 Gt C in northern peatlands, with a range of 473–621 Gt C based on the stan-dard errors of mean carbon accumulation rates.
The major uncertainties for all approaches discussed above are related to the data coverage gaps and representation of available data. Turunen et al. (2002) indicated that the large differences between various estimates using the peat volume approach (Table 2) were caused by uncertainties in mean peat depth and bulk density values used. Similar uncertain-ties apply to carbon density values, as they are ultimately based on the values of peat/soil depth, organic matter/carbon concentration, and bulk density used. Also, large errors may be introduced when the data from one peatland region are extrapolated to the entire northern peatlands, as Turunen et al. (2002) did with detailed peatland data from Finland. Un-derrepresentation of the world’s large peatlands (Yu, 2011) and of shallow peats in peatland margins in existing datasets (Kuhry and Turunen, 2006) may be another problem. To in-crease the representation of mean peat depth and bulk density values, data from other large peatland regions, such as West Siberia (Sheng et al., 2004), continental western Canada (Vitt et al., 2000), and the Mackenzie River Basin (Vitt et al., 2005) should be integrated and synthesized with detailed data available from Finland (Clymo et al., 1998; Turunen et al., 2002). For the time history approach, the major uncertainties are the history of peatland area change over time as well as the representativity of the carbon accumulation records used. For example, likely peatland expansion is highly nonlinear after initiation, as documented at site-scale studies (Korhola, 1994; Korhola et al., 1996; van Bellen et al., 2011; Loisel et al., 2012). Therefore, the assumption of linear peatland ex-pansion used in Yu et al. (2010) might have greatly underes-timated the peatland area in their early development history and, as a result, the overall carbon stocks.
In all these studies of carbon stocks in northern peatlands (Table 2), there appears to be a convergence in the total peatland area. Most authors used an area between 3.5 and 4 million km2, so an average of about 3.7 million km2 or a rounded value of 4 million km2, would be a reasonable value to use for Holocene peat carbon stock estimates, especially considering the loss of peatlands through drainage or other disturbances during historical times that have not been con-sidered in some area estimates. This area estimate is sim-ilar to the recent estimate of 3.7 million km2from detailed tabulation of peatland areas in each country of the world (Joosten and Clarke, 2002). These include peatland areas of 0.617 million km2 in Europe, of 1.18 million km2 in Asian part of Russia, and of 1.86 million km2 in North America (1.235 million km2in Canada, and 0.625 million km2in the US) (Joosten and Clarke, 2002; their appendix 1). Maltby and Immirzi (1993) estimated the area of northern peat-lands at 4 million km2, and Bridgham et al. (2006) used 4 million km2 of global peatland area for their carbon flux calculations. To put the estimates of peatland area in con-text, estimates for global wetland (including peatlands) area range from 5.26 million km2(Matthews and Fung, 1987) to 9.167 million km2(Lehner and D¨oll, 2004).
For peat carbon stock estimates, it is worth noting that two very different approaches produced surprisingly simi-lar estimates of 455 Gt C using the peat volume approach by Gorham (1991) and of 547 Gt C using the time history approach by Yu et al. (2010). Both converge at a rounded figure of 500 Gt C. Bridgham et al. (2006) estimated that global peatlands contain from 234 to 679 Gt C by summing regional data, which includes 178 Gt C in North America, with about 150 Gt C in Canada (Roulet, 2000; Tarnocai et al., 2005). Botch et al. (1995) estimated a carbon pool of 214 Gt C in peatlands of the Russian Federation. Based on these estimates, peatlands in North America and Russia alone would amount to about 400 Gt C. Therefore, considering all the uncertainties in estimating these values (see above), it is probably only justifiable and desirable to state the car-bon stocks in northern peatlands with one significant figure (Davidson and Janssens, 2006; Yu, 2011). As such, I argue that as a best guess, northern peatlands most likely contain about 500±100 Gt C (or 20 % uncertainty range) on the ba-sis of the review of the literature. A more precise statement and a comprehensive error analysis of carbon stock estimates in northern peatlands are desirable but still out of reach.
3 Peatland changes over time
of basal ages from northern peatlands (Fig. 1a), showing peak peatland initiation in the early Holocene, and Yu et al. (2010) presented the similar first datasets for tropical peat-lands and southern (mostly Patagonian) peatpeat-lands. Several regional compilations of basal peat ages also have been pub-lished, including for southern Finland (Korhola, 1995), West-ern Canada (Halsey et al., 1998; Campbell et al., 2000), West Siberia (Smith et al., 2004), North America (Gorham et al., 2007), and Alaska (Jones and Yu, 2011). The basal ages in MacDonald et al. (2006) have been used to derive a first ap-proximation of peatland area changes over time and is shown in Fig. 1b (Yu et al., 2010). The results show that the area of northern peatlands increased monotonically, but with re-duced rate over time during the Holocene (Fig. 1b).
Another aspect of peatland dynamics is carbon accumu-lation intensity, that is, accumuaccumu-lation rates per unit peatland area. One way to do that is to calculate average C accumula-tion rate for a peat profile using a single basal age and total C amount of the profile. The accumulation rates calculated this way are termed long-term apparent rates of carbon accu-mulation (LORCA) by Tolonen and Turunen (1996). Tolo-nen and TuruTolo-nen (1996) compiled a large dataset of basal ages and total amount of carbon from each of 1028 peat-land columns in Finpeat-land and found a monotonic increas-ing trend in apparent carbon accumulation rates durincreas-ing the Holocene, from∼15 g C m−2yr−1in the early Holocene to ∼45 g C m−2yr−1in the late Holocene. They also found that bogs overall have higher accumulation rates than fens, and there are larger data scatter and variability during the late Holocene than in the early Holocene. Tolonen and Turunen (1996) also plotted and compared similar data from 113 bo-real and subarctic peatlands in Western Canada, mostly from Zoltai (1991), and found higher accumulation rates in the re-cent millennia, with the lowest rates around 4000 yr ago, es-pecially from subarctic peatland sites. In both regions, the re-cent high accumulation rates were caused by autogenic pro-cess due to limited decomposition of recent peat (Clymo, 1984; Belyea and Baird, 2006). However, the depressed car-bon accumulation around 4000 yr ago might be caused by the initiation (aggradation) of permafrost during neoglacial climate cooling in this region (Zoltai, 1993). LORCA as cal-culated using a single basal ages provide unreliable estimates for carbon accumulation, owing to influences of fires, ero-sion or other disturbance (e.g., Tarnocai et al., 2012). I also argue that the fundamental problem inherent in LORCA data is their inability to identify and locate the time intervals when these disturbances and the reduced carbon accumulation oc-curred in the past. Some later studies expanded the initial definition of LORCA, unknowingly in some cases, by also including accumulation rates calculated from multiple age determinations along peat profiles, which is discussed below. It has become confusing as both types of accumulation data have different meaning and limitations. So proliferation of these terms and acronyms may not help the understanding and communication of long-term carbon dynamics in
peat-lands. However, it may be possible to make more meaningful use of these large and valuable basal age datasets, if a new ap-proach and methodology can be developed in analyzing the data. For example, if we assume that all the basal ages for a region or for the entire northern peatlands were from a Super Peatland (see Yu, 2011), then we might be able to derive C accumulation history by binning these basal ages and deriv-ing C accumulation rates for individual bins. Of course, this possible approach would require C measurements (bulk den-sity, and C content) from these peat profiles with basal ages; however, likely most of these profiles lack such data.
An alternative way to derive carbon accumulation rates is based on peat profiles with multiple age determinations and carbon amount measurements. Using this approach we avoid the problems associated with unidentified disturbance-related peat removal or slowdown and subsequent underesti-mate of overall average peat accumulation rates, as we briefly discussed in Yu et al. (2012a). We recently compiled data from a total of 33 peatland sites with multiple ages per site and detailed carbon measurements across the circum-Arctic region (see Fig. 2 for site locations in climate space). We used the dataset to derive a synthesis history of average carbon accumulation rates for northern peatlands, which shows the highest carbon accumulation in the early Holocene (Fig. 1c; Yu et al., 2009). These records would more precisely show any disturbance-related and climate-related loss of carbon at 1000-yr intervals as reflected in a decrease in carbon accu-mulation rates.
Mean Annual Temperature (°C)
-20 -15 -10 -5 0 5 10 15
M
e
an Annual Pr
eci
p
it
ation (
mm)
0 500 1000 1500 2000 2500 3000
Land N of 45°N climate domain Boreal/Taiga climate domain East Siberia and Far East Russia European Russia, Latvia, Estonia Central North Ameria Eastern North America Finland, Norway, Sweden Great Britain, Iceland Alaska, Britsh Columbia Mackenzie River Basin Hudson Bay Lowland West Siberia Lowland C accumulation sites NECB sites
7
4
1
5 3
2
Fig. 2. Distribution of contemporary NECB sites in the climate space of mean annual temperature and precipitation of the north-ern peatland domain. The locations of NECB (net ecosystem car-bon balance) (red circles;n=5) and Holocene carbon accumula-tion sites (yellow triangles;n=33) are shown. NECB site numbers are the same as in Table 3: site 1: Mer Bleue; 2: Deger¨o; 3: Auchen-corth; 4: Glencar; and 5: Stordalen. The 33 carbon accumulation sites were used to derive the synthesis carbon accumulation curve in Fig. 1c (see Yu et al., 2009 for detail and site information). Mod-ified from Yu et al. (2009).
was calculated and added to earlier NCB. Consequently, cu-mulative histories of NCP and NCB are also different, with cumulative NCB showing sharper increase in carbon stocks earlier in their accumulation histories than cumulative NCP (Fig. 1e). The cumulative NCB results indicate that north-ern peatlands sequestered close to 400 Gt C before 5000 yr ago, about 70 % of the current total of 547 Gt C. The greater C sequestration in the early Holocene is likely induced by warmer climates in many high-latitude regions dominated by peatlands (Yu et al., 2009, 2010; Jones and Yu, 2010), cor-responding to the Holocene thermal maximum (HTM; Kauf-man et al., 2004). The subsequent decline in C sequestration is caused by climate cooling in the late Holocene (Neoglacial cooling) after the HTM and the widespread initiation and for-mation of permafrost (e.g., Zoltai, 1993).
How does the peatland C sequestration history from the NCB approach compare with other studies? In their analysis of soil chronosequence data, Harden et al. (1992) indicated that peak peatland expansion occurred 8000–4000 yr ago in glaciated North America. Based on global land ecosystem reconstructions, Adams and Faure (1998) provided an esti-mate of carbon storage on land since the last glacial max-imum. They assumed a constant linear rate of peat carbon
stock increase over the Holocene at 46 Gt C per 1000 yr for a total peat carbon stock of 466 Gt C (Table 2). Halsey et al. (2000) used the abundance of Sphagnum (peat moss) spores as recorded in the North America Pollen Database to map the extent of peatlands in North America. Similarly, Gajewski et al. (2001) scaled up the total carbon stocks of 455 Gt C as estimated by Gorham (1991) throughout the last 21 000 yr on the basis of abundance of Sphagnum spores from the Global Pollen Database. Gajewski et al. (2001) found that most peat carbon was accumulated in the late half of the Holocene, with about 350 Gt C accumulated in the last 5000 yr, about 78 % of 455 Gt C total (Fig. 1e). We argue that Sphagnum spores approach likely underestimates the extent of peatlands in the early Holocene, at which time peatlands (mostly rich fens) were often dominated by
non-Sphagnum plants (Gajewski et al., 2001; MacDonald et al.,
2006; Yu, 2011; Yu et al., 2012b). Gorham (1991) also indi-cated that northern peatlands accumulate their carbon mostly in the late half of the Holocene. These Holocene histories of carbon sequestration were very different from our recent analysis using the time history approach (Yu et al., 2010) and NCB approach (Yu, 2011), as discussed above. At re-gional scales, Vitt et al. (2000) showed that about half of to-tal carbon stock (48 Gt C) in peatlands of continento-tal western Canada was observed in the last 3000–2000 yr, but after con-sidering long-term peat decomposition the temporal pattern changed slightly – a similar general pattern as in Gajewski et al. (2001) for northern peatlands. These differences have significant implications for understanding peatlands’ role in the global carbon cycle (Yu, 2011; Yu et al., 2011; Ruddi-man et al., 2011; Menviel and Joos, 2012). I argue that meth-ods other than the NCB method tend to overestimate late Holocene C sequestration in peatlands since they do not ac-count for peat decomposition during the period from their deposition until the present.
4 Carbon fluxes across timescales
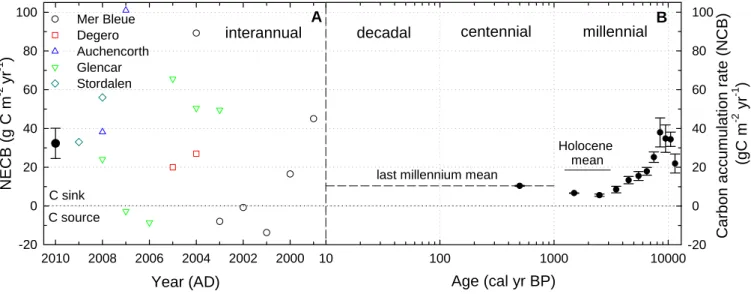
Holocene carbon sequestration histories provide opportuni-ties to assess and understand peatland carbon fluxes over dif-ferent time scales. “True” instantaneous carbon accumula-tion rates as derived from NCB (Fig. 1d) and peatland ar-eas over time (Fig. 1b) were plotted on a log scale of ages to emphasize the different time scales (Fig. 3b; Yu et al., 2011). The accumulation rates (NCB) ranged from the high-est value of 38 g C m−2yr−1at 8000–9000 yr ago to the
low-est of 5.6 g C m−2yr−1at 2000–3000 yr ago. The Holocene
Year (AD)
2000 2002 2004 2006 2008 2010
NE
CB
(g C m
-2
yr
-1 )
-20 0 20 40 60 80 100
Mer Bleue Degero Auchencorth Glencar Stordalen
Age (cal yr BP)
10 100 1000 10000
Ca
rbo
n
accum
u
la
ti
on
ra
te
(NCB
)
(gC m
-2 yr -1 )
-20 0 20 40 60 80 100
millennial centennial
decadal interannual
Holocene mean last millennium mean
C sink
C source
A B
Fig. 3. Net ecosystem carbon balance across time scales in northern peatlands. (A) Net ecosystem carbon balance (NECB) from 5 peatland sites with a total of 18 yr of measurements over the last decade (see Table 4 for details; Mer Bleue: Roulet et al., 2007; Deger¨o: Nilsson et al., 2008; Auchencorth: Dinsmore et al., 2010; Glencar: Koehler et al., 2011; Stordalen: Olefeldt et al. 2012); (B) peat-core derived net carbon balance (NCB) during the Holocene plotted on log scale to emphasize the different time scales (millennial, centennial and decadal), on the basis of 33 accumulation records (Fig. 1c; Yu et al., 2009) and 1516 basal ages (Fig. 1a; MacDonald et al., 2006).
peatlands during their histories, we argue that these rates are conceptually equivalent to the net ecosystem carbon bal-ance (NECB) as from contemporary carbon flux studies in peatlands and other ecosystem types (Chapin et al., 2006; Olefeldt et al., 2012). However, the time periods used for the NECB measurements or calculations need to be spec-ified when describing NECB as a functioning property of peatland ecosystems, as long-term carbon accumulation rates and contemporary NECB measurements integrate over very different lengths of time. In other words, we do not know how many years would be needed for contemporary NECB to approach a stabilized mean value, or what is the likely variability at centennial, decadal and interannual timescales for each 1000-yr interval of integrated carbon accumulation rates (NCB). Furthermore, other C losses from peatlands, including volatile organic carbon (VOC) (e.g., Holst et al., 2010) and dissolved inorganic carbon (DIC) (e.g., Nilsson et al., 2008; Dinsmore et al., 2010), are implicitly included in historical NCB calculations, but are often not included in NECB estimates. While these C fluxes are small (for exam-ple,∼0.4–9 g C m−2yr−1; Dinsmore et al., 2010; Nilsson et
al., 2008), they represent continuous C losses from peatlands. How do these long-term Holocene carbon sequestration rates derived from peat-core records compare with contem-porary C flux measurements? To my knowledge, there are five peatland sites that have measurements for most impor-tant carbon flux terms over multiple years, including CO2
uptake by photosynthesis and release by ecosystem respira-tion, CH4 emissions, and dissolved organic carbon (DOC)
discharges from peatlands (Table 4; Roulet et al., 2007; Nils-son et al., 2008; Dinsmore et al., 2010; Koehler et al., 2011;
Olefeldt et al., 2012). There are large interannual varia-tions at most of these sites with long records. Also, a large range of NECB was observed among these sites, including the largest carbon sink of 101 g C m−2yr−1 at Auchencorth Moss, Scotland, in 2007 (Dinsmore et al., 2010) and the great carbon source to the atmosphere of−13.8 g C m−2yr−1
Table 4. Contemporary net ecosystem carbon balance (NECB) from northern peatlands∗.
# Site Latitude Longitude Altitude MAT MAP Peatland Measurement NECB NEE CH4 DOC Reference
(◦N) (◦E) (m a.s.l.) (◦C) (mm) type period (g C m−2yr−1) (g C-CO2 (g C-CH4 (g C m−2
±1 SD m−2yr−1) m−2yr−1) yr−1) 1 Mer Bleue 45.41 −75.48 69 6 943 Ombotrophic 1998–2004 21.5±39.0 40.2±40.5 3.7±0.5 14.9±3.1 Roulet
(Canada) bog et al. (2007)
2 Deger¨o 64.18 19.55 270 1.2 523 Minerogenic 2004–2005 24±4.9 51.5±4.9 11.5±3.5 17.7±3.7 Nilsson
Stormyr fen et al. (2008)
(Sweden)
3 Auchencorth 55.79 −3.24 265 4.4 1165 Ombrotrophic 2007–2008 69.5±44.4 114.7±30.1 0.32±0.04 25.4±9.6 Dinsmore
Moss∗∗ bog et al. (2010)
(Scotland)
4 Glencar 51.92 −9.92 150 10 2674 Blanket 2003–2008 29.7±30.6 47.8±30 4.1±0.5 14.0±1.6 Koehler
(Ireland) bog et al. (2011)
5 Stordalen 68.37 19.05 351 0 336 Permafrost 2008–2009 44.5±16.3 50±17.0 2.0 3.2±0.6 Olefeldt
(Sweden) palsa mire et al. (2012)
Average of 5 sites (g C m−2yr−1)(% of NEE) 37.8 (62 %) 60.8 4.3 (7.1 %) 15.0 (24.7%)
∗NECB: net ecosystem carbon balance; NEE: net ecosystem exchange; DOC: dissolved organic carbon; MAT: mean annual temperature; and MAP: mean annual precipitation.
∗∗Auchencorth Moss has flux measurements from other processes, including stream evasion of CO2and CH4, so the figures listed do not balance, that is,
NEE>NECB + CH4+ DOC.
it is interesting to note that a first direct comparative study at Mer Bleue showed no statistical difference between contem-porary NECB and carbon accumulation rates estimated for the last 3000 yr from peat-core analysis (Roulet et al., 2007). If derived Holocene NCB represents true carbon accumu-lation robustly and accurately, and if the measured contem-porary NECB are representative of these ecosystems, then what could have contributed to the much higher NECB at these flux sites over the recent decade? We speculated that the environmental conditions at the present may no longer be “natural” owing to recent anthropogenic global changes, including climate warming, elevated CO2concentration and
subsequent CO2 fertilization effect, and increased nitrogen
deposition (Yu et al., 2011). The updated mean value of 32.3 g C m−2yr−1from 5 sites presented here is higher than
the mean of 25 g C m−2yr−1 from three sites (Yu et al.,
2011), suggesting again the high interannual and between-site variability of contemporary NECB measurements. Al-ternatively, these contemporary study sites are not represen-tative of most peatlands in these regions, as researchers tend to select more productive and less-disturbed sites for eddy covariance tower and other flux measurements. Fires and possibly flooding have been frequent disturbances in peat-lands during the Holocene that often cause large carbon loss from ecosystems and reduced net carbon accumulation rates (e.g., Bhiry et al., 2007; St. Louis et al., 2000; Turetsky et al., 2011a, b), and these carbon losses were implicitly ac-counted for in our Holocene NCB calculations. For example, recent studies in boreal peatlands show that several hundred years of C accumulation can be lost in peatland fires (Turet-sky et al., 2011b). However, these disturbances were likely not encountered during the period of carbon flux measure-ments at these flux study sites. Furthermore, in temperature-precipitation climate space, all these sites are located near the warm fringe of the boreal peatland domain, although span-ning essentially the entire precipitation range (Fig. 2). While
all these NECB sites represent peatlands under the warmest climates with similar precipitation, while the sites used for peat-core derived estimates of Holocene NCB were more widely distributed in the northern peatland climate domain (Fig. 2). If the NECB is indeed higher at the warm fringe than under a cold climate, then this observation suggests that temperature is a dominant control on peatland carbon balance at this spatial scale. This suggestion appears to be supported by peatland CO2flux studies. In a synthesis of eddy
covari-ance flux studies from 12 wetland sites (peatlands and wet tundra) from temperate to Arctic climates, Lund et al. (2010) found that the length of growing seasons is the most impor-tant variable explaining the spatial variation in summertime gross primary production and ecosystem respiration, both to-gether determining the net ecosystem exchange (that is, CO2
flux component of NECB). Also, Lund et al. (2010) con-cluded from their synthesis results that gross primary produc-tion would increase more with a prolonged growing season as compared with ecosystem respiration. This suggests that a warm climate would stimulate more carbon uptake. There-fore, if there is no major difference in CH4and DOC fluxes
among these sites, it is possible that these high contemporary flux sites only capture NECB from the most productive peat-lands under warm climates, which do not necessarily repre-sent other northern peatlands.
In reality, there are major differences in CH4 and DOC
fluxes in different peatlands (Table 4). Net C sequestra-tion (NECB) on average accounts for 62 % (ranging from 47 to 89 %) of total photosynthetic C input (NEE), while C losses as CH4 account for 7 % (from <1 to 22 %) and
DOC for 25 % (from 6 to 37 %). It is not surprising that wet fens (e.g., Deger¨o Stormyr) have high C losses from CH4 emissions, while dry bogs and permafrost peatlands
have the lowest CH4emissions (e.g., Auchencorth Moss, and
If these relative contributions of different C fluxes to over-all C balance are representative for different types of peat-lands, then we can gather additional net C balance informa-tion from partial C flux data at more sites. This will compen-sate the lack of NECB sites for comparison with historical data, but we should be cautious as we do not know if the data from these few sites are representative. Among the sites with full year measurements reviewed by Lund et al. (2010) using La Thuile Fluxnet dataset, NEE values range from a low of 22 g C m−2yr−1in a subarctic fen in northern Finland (Aurela et al., 2004) to a high of 144 g C m−2yr−1in a rich fen in boreal western Canada (Syed et al., 2006). Recently Frolking et al. (2011) provided a review of NEE and CH4
fluxes from global undisturbed and disturbed peatlands in the literature and found that northern (non-tropical) peatlands have a median value of 40 g C m−2yr−1 (ranging from 20
to 100 g C m−2yr−1)in NEE and of 7.5 g C-CH
4m−2yr−1
(ranging from 1 to 52 g C m−2yr−1)in CH
4emissions. The
NEE and CH4fluxes from NECB sites (Table 4) are close to
the center values of these data ranges. Even at sites with only C flux data during growing seasons using chamber technique, some studies show that peatlands have a delicate C balance, switching between C sinks and sources, depending on mi-crotopography and weather/climate (e.g., Alm et al., 1999; Schneider et al., 2012). Also, Fraser et al. (2001) reviewed DOC export from wetlands and found that it ranges from 1 to 48 g C m−2yr−1 from 13 wetland sites, with a mean of ∼16 g C m−2yr−1. The DOC values from 5 NECB sites are within this range, with a similar site mean (Table 4).
Spatial scales have been considered as an important fac-tor affecting carbon dynamics in peatlands (Waddington and Roulet, 2000; Belyea and Baird, 2006; Limpens et al., 2008; Baird et al., 2009). However, less attention has been paid to the discussion of temporal scales in the literature. Peat-land carbon dynamics may have been controlled by different factors at different temporal and spatial scales. For example, both hydrology and temperature may play major roles in de-termining the carbon balance at interannual scales at individ-ual sites (Fig. 3a), but some data show that summer temper-ature might have played a major role in carbon accumula-tion at millennial scales in the early Holocene over the entire northern peatlands (Yu et al., 2009, 2010) and at the regional scale in Alaska (Jones and Yu, 2010). Also, temperature and precipitation may have different impacts on different compo-nents of the carbon balance (CO2, CH4and DOC) (see above
discussion; Lund et al., 2010). Therefore, it is conceivable that different factors may control carbon dynamics and bal-ance at decadal and centennial time scales, the most relevant time scales for climate impact and feedback assessments (Yu et al., 2011). However, at the present there are major data and knowledge gaps at this intermediate timescale (Fig. 3).
5 Concluding remarks
The following outstanding issues and relevant future research directions are discussed for improving peatland carbon stock estimates and for understanding peatland carbon dynamics.
5.1 Filling data gaps and increasing data representation
We have very limited data and information from several large peatland regions in the world, including the Hudson Bay Lowlands (see some paleo studies in Glaser et al., 2004, and general overview of these peatlands in Riley, 2011), East Siberia and the Far East of Russia (Yu et al., 2009). Fill-ing these data gaps is essential for robust estimates of peat-land carbon stocks and Holocene carbon dynamics. Also, it would be preferable and ideal to generate separate carbon stock estimates for different regions, as done for continental western Canada (Vitt et al., 2000), Finland (Turunen et al., 2002), West Siberia (Sheng et al., 2004), and the Macken-zie River Basin (Vitt et al., 2005; Beilman et al., 2008), be-fore we sum all these together to derive estimates for the en-tire northern peatlands. This means that we need to develop region-specific values of mean peat depth and bulk density values using the peat volume approach (or carbon density approach). Similarly, regional patterns of peat carbon accu-mulation could be developed if more accuaccu-mulation records were available from different regions. If so, eventually not only a more representative database will be developed for the entire northern peatlands, but also we will have the in-formation to discuss regional differences in peatland carbon sequestration and their controls by regional climate. One pos-sible way to expand the carbon accumulation records is to use the still underutilized basal peat age database (>2500 compiled dates available; MacDonald et al., 2006; Gorham et al., 2007; Kohorla et al., 2010) for calculating LORCA as described in Tolonen and Turunen (1996). However, a new approach needs to be developed to decompose the observed LORCA data into net carbon balance (NCB) or its equiva-lent, as described earlier. Also, it would be useful to compare results of carbon stock estimates of the same region using different (e.g., peat volume vs. time history) approaches.
5.2 Establishing empirical relationship and process understanding
ages and depth (cumulative mass) from their large regional datasets or individual sites from west-central Canada. Thus, it would be highly valuable to establish relationships of the essential parameters of depth, ages and bulk density for dif-ferent types of peatlands in regions that have detailed infor-mation (Finland: Clymo et al., 1998; Turunen et al., 2002; continental western Canada and the Mackenzie River Basin: Vitt et al., 2000, 2005; West Siberia: Sheng et al., 2004). Then, these relationships can be used to estimate essential parameters and carbon stocks in other remote or understud-ied regions. A promising approach would be to stratify other peat carbon properties (such as bulk density, carbon density) by peatland types and stratigraphic depths as suggested by Beilman et al. (2008). Riley (2011) also emphasized the im-portance of establishing the relationship between peatland types and peat depth in calculating peat volume and carbon, as in remote parts of the Hudson Bay Lowlands. Also, the es-tablished relationships may contribute to the development of new approaches for using basal ages and the derived LORCA for modeling net carbon balance.
5.3 Focusing on peatland lateral expansion data and
process
Peatland lateral expansion is an important process that is likely controlled by local topography and regional climate. Peatland expansion dynamics during the Holocene directly affects the estimates of change in peatland area over time. There are limited data available at individual sites, as the data collections and analysis are often expensive and labor intensive (see Korhola, 1994; Bauer et al., 2003; van Bellen et al., 2011; Loisel et al., 2012). As a result, peatland expan-sion processes are not well understood. The novel method of analyzing the multidate datasets as presented in Korhola et al. (2010), would be needed to derive a robust peatland ex-pansion history during the Holocene. Also, more studies at peatland site scale are needed, especially using the combina-tion of ground penetracombina-tion radar (GPR) for large-scale survey and peat-core analysis for detailed depth and age determina-tions. This approach has been successfully used in some re-cent studies (van Bellen et al., 2011; Loisel et al., 2012). In the future, combining GPR, LIDAR and other remote sens-ing tools with peat-core analysis will allow us to generate not only surface morphology information but also subsur-face stratigraphy to understand peatland expansion processes on landscape at the present and in the past. Also, a gen-eral model of peatland latgen-eral expansion that incorporates climate (e.g., precipitation, or recharge rate) and topography (e.g., slope), potentially modified and integrated from exist-ing models (e.g., Ingram, 1982; Couwenberg, 2005; Morris et al., 2011), would help derive necessary parameters for es-timating peatland expansion rates during the Holocene.
5.4 Understanding carbon dynamics across timescales
There are major data and knowledge gaps at the timesscales of decades and centuries (Fig. 3), which prevent understand-ing peatland carbon dynamics at this intermediate, but most relevant, timescale.210Pb and post-bomb AMS 14C dating and carbon analysis of recent peat cores are needed to fill this important data gap (e.g., Wieder, 2001; Turetsky et al., 2004; Malmer and Wall´en, 2004). Datasets used in a re-cent data synthesis of the last millennium peat carbon dy-namics (Charman et al., 2012) can be further explored for deriving net carbon balance at 100-yr intervals for the last 1000 yr. Also, as pointed out by Roulet et al. (2007), we “need more replications across a diverse set of ecoclimatic regions and other peatland types” for contemporary NECB measurements, and I argue that measurements from sites in colder boreal and subarctic climates would fill an impor-tant data and knowledge gap (Fig. 2). In addition to large-scale synthesis effort, further analyzing contemporary flux and paleo data from the same site (e.g., Roulet et al., 2007) by decomposing peat-core data to NECB equivalent at site scale (Yu, 2011) may provide insights into carbon dynam-ics across different timescales. Robust comparisons between long-term and contemporary carbon balance would also re-quire a systematic error analysis, but this goal is still elu-sive due to underrepresentation of both types of data. Mean-while, a data-model assimilation procedure may be useful to decompose peat-core data into short-term NECB or to inte-grate annual NECB measurements into long-term averages of peatland carbon balance. Also, process modeling (e.g., Frol-king et al., 2010) will be essential in understanding the roles of different environmental parameters (temperature, precip-itation, and hydrology) in determining carbon accumulation at various (interannual, decadal, centennial, and millennial) timescales.
Acknowledgements. I thank Nigel Roulet for his insightful and constructive criticism and comments, Dave Beilman and Julie Loisel for their helpful suggestions, and two journal referees, especially David Olefeldt, for their constructive, thoughtful and detailed comments on the manuscript. Considering these feedbacks greatly improved the manuscript. I acknowledge that the idea to re-view peatland carbon stocks was stimulated through a conversation with Pep Canadell in July 2011 and that the necessary literature research and writing were initiated in January 2012. I dedicate this paper to Robert E. Moeller (1949–2011). Some of the ideas presented in this paper were generated while undertaking peatland research projects funded by the US NSF grants (ATM-0628455; EAR-0819717; DEB-0919385; and ARC-1107981).
References
Adams, J. M. and Faure, H.: A new estimate of changing carbon storage on land since the last glacial maximum, based on global land ecosystem reconstruction, Global Planet. Change, 16/17, 3– 24, 1998.
Alm, J., Schulman, L., Walden, J., Nyk¨anen, H., Martikainen, P. J., and Silvola, J.: Carbon balance of a boreal bog during a year with an exceptionally dry summer, Ecology, 80, 161–174, 1999. Armentano, T. V. and Menges, E. S.: Patterns of change in the
car-bon balance of organic soil-wetlands of the temperate zone, J. Ecol., 74, 755–774, 1986.
Aurela, M., Laurila, T., and Tuovinen, J. P.: The timing of snow melt controls the annual CO2 balance in a subarctic fen, Geophys. Res. Lett., 31, L16119, doi:10.1029/2004GL020315, 2004. Baird, A. J., Belyea, L. R., and Morris, P. J.: Upscaling of
peatland-atmosphere fluxes of methane: Small-scale heterogeneity in pro-cess rates and the pitfalls of “bucket-and-slab” models, in: Car-bon Cycling in Northern Peatlands, AGU Geophysical Mono-graph vol. 184, edited by: Baird, A., Belyea, L., Comas, X., Reeve, A., and Slater, L., 37–53. doi:10.1029/2008GM000826, 2009.
Bauer, I. E., Gignac, L. D., and Vitt, D. H.: Development of a peat-land complex in boreal western Canada: Lateral site expansion and local variability in vegetation succession and long-term peat accumulation, Can. J. Bot., 81, 833–847, 2003.
Beilman, D. W., Vitt, D. H., Bhatti, J. S., and Forest, S.: Peat car-bon stocks in the southern Mackenzie River Basin: uncertainties revealed in a high-resolution case study, Glob. Change Biol., 14, 1221–1232, doi:10.1111/j.1365-2486.2008.01565.x, 2008. Belyea, L. R. and Baird, A. J.: Beyond the limits to peat bog growth:
cross-scale feedback in peatland development, Ecol. Monogr., 76, 299–322, 2006.
Bhiry, N., Payette, S., and Robert, E.: Peatland development at the arctic tree line (Quebec, Canada) influenced by flooding and per-mafrost, Quaternary Res., 67, 426–437, 2007.
Botch, M. S., Kobak, K. I., Vinson, T. S., and Kolchugina, T. P.: Carbon pools and accumulation in peatlands of the Former Soviet Union, Global Biogeochem. Cy., 9, 37–46, 1995.
Bridgham, S. D., Megonigal, J. P., Keller, J. K., Bliss, N. B., and Trettin, C.: The carbon balance of North American wetlands, Wetlands, 26, 889–916, 2006.
Brovkin, V., Bendtsen, J., Claussen, M., Ganopolski, A., Ku-batzki, C., Petoukhov, V., and Andreev, A.: Carbon cycle, veg-etation, and climate dynamics in the Holocene: Experiments with the CLIMBER-2 model, Global Biogeochem. Cy., 16, 1139, doi:10.1029/2001GB001662, 2002.
Campbell, I. D., Campbell, C., Yu, Z. C., Vitt, D. H., and Apps, M. J.: Millennial-scale rhythms in peatlands in the western interior of Canada and in the global carbon cycle, Quaternary Res., 54, 155–158, 2000.
Chapin, F. S., Woodwell, G. M., Randerson, J. T., Rastetter, E. B., Lovett, G. M., Baldocchi, D. D., Clark, D. A., Harmon, M. E., Schimel, D. S., Valentini, R., Wirth, C., Aber, J. D., Cole, J. J., Goulden, M. L., Harden, J. W., Heimann, M., Howarth, R. W., Matson, P. A., McGuire, A. D., Melillo, J. M., Mooney, H. A., Neff, J. C., Houghton, R. A., Pace, M. L., Ryan, M. G., Run-ning, S. W., Sala, O. E., Schlesinger, W. H., and Schulze, E. D.: Reconciling carbon-cycle concepts, terminology, and methods, Ecosystems, 9, 1041–1050, 2006.
Charman, D. J., Beilman, D. W., Blaauw, M., Booth, R. K., Brewer, S., Chambers, F. M., Christen, J. A., Gallego-Sala, A., Harrison, S. P., Hughes, P. D. M., Jackson, S. T., Korhola, A., Mauquoy, D., Mitchell, F. J. G., Prentice, I. C., van der Linden, M., De Vleeschouwer, F., Yu, Z. C., Alm, J., Bauer, I. E., Corish, Y. M. C., Garneau, M., Hohl, V., Huang, Y., Karofeld, E., Le Roux, G., Loisel, J., Moschen, R., Nichols, J. E., Nieminen, T. M., MacDonald, G. M., Phadtare, N. R., Rausch, N., Sillasoo, ¨U., Swindles, G. T., Tuittila, E.-S., Ukonmaanaho, L., V¨aliranta, M., van Bellen, S., van Geel, B., Vitt, D. H., and Zhao, Y.: Climate-related changes in peatland carbon accumulation during the last millennium, Biogeosciences Discuss., 9, 14327–14364, doi:10.5194/bgd-9-14327-2012, 2012.
Clymo, R. S.: The limits to peat bog growth, Philos. T. R. Soc. Lon. B, 303, 605–654, 1984.
Clymo, R. S., Turunen, J., and Tolonen, K.: Carbon accumulation in peatland, Oikos, 81, 368–388, 1998.
Couwenberg, J.: A simulation model of mire patterning – revisited, Ecography, 28, 653–661, 2005.
Davidson, E. A. and Janssens, I. A.: Temperature sensitivity of soil carbon decomposition and feedbacks to climate change, Nature, 440, 165–173, 2006.
Dinsmore, K. J., Billett, F. M., Skiba, U. M., Rees, R. M., Drewer, J., and Helfter, C.: Role of the aquatic pathway in the carbon and greenhouse gas budgets of a peatland catchment, Glob. Change Biol., 16, 2750–2762, doi:10.1111/j.1365-2486.2009.02119.x, 2010.
Fraser, C. J. D., Roulet, N. T., and Moore, T. R.: Hydrology and dis-solved organic carbon biogeochemistry in an ombrotrophic bog, Hydrol. Process., 15, 3151–3166, 2001.
Frolking, S., Roulet, N. T., Tuittila, E., Bubier, J. L., Quillet, A., Tal-bot, J., and Richard, P. J. H.: A new model of Holocene peatland net primary production, decomposition, water balance, and peat accumulation, Earth Syst. Dynam., 1, 1–21, doi:10.5194/esd-1-1-2010, 2010.
Frolking, S., Talbot, J., Jones, M. C., Treat, C. C., Kauffman, J. B., Tuittila, E.-S., and Roulet, N.: Peatlands in the Earth’s 21st century coupled climate-carbon system, Environ. Rev., 19, 371– 396, 2011.
Gajewski, K., Viau, A., Sawada, M., Atkinson, D., and Wilson, S.: Sphagnum peatland distribution in North America and Eurasia during the past 21,000 years, Global Biogeochem. Cy., 15, 297– 310, 2001.
Glaser, P. H., Hansen, B. C. S., Siegel, D. I., Reeve, A. S., and Morin, P. J.: Rates, pathways and drivers for peatland develop-ment in the Hudson Bay Lowlands, northern Ontario, Canada, J. Ecol., 92, 1036–1053, 2004.
Gorham, E.: Biotic impoverishment in northern peatlands, in: The earth in transition: patterns and processes of biotic impoverish-ment, edited by: Woodwell, G. M., Cambridge University, New York, NY, 65–98, 1990.
Gorham, E.: Northern peatlands: Role in the carbon cycle and prob-able responses to climatic warming, Ecol. Appl., 1, 182–195, 1991.
GSDTG (Global Soil Data Task Group): Global Gridded Surfaces of Selected Soil Characteristics (IGBP-DIS), available at: http: //www.daac.ornl.gov, doi:10.3334/ORNLDAAC/569, 2000. Halsey, L. A., Vitt, D. H., and Bauer, I. E.: Peatland initiation during
the Holocene in continental western Canada, Climatic Change, 40, 315–342, 1998.
Halsey, L., Vitt, D. H., and Gignac, L. D.: Sphagnum-dominated peatlands in North America since the last glacial maximum: Their occurrence and extent, Bryologist, 103, 334–352, 2000. Harden, J. W., Sundquist, E. T., Stallard, R. F., and Mark, R. K.:
Dynamics of soil carbon during deglaciation of the Laurentide ice sheet, Science, 258, 1921–1924, 1992.
Holst, T., Arneth, A., Hayward, S., Ekberg, A., Mastepanov, M., Jackowicz-Korczynski, M., Friborg, T., Crill, P. M., and B¨ackstrand, K.: BVOC ecosystem flux measurements at a high latitude wetland site, Atmos. Chem. Phys., 10, 1617–1634, doi:10.5194/acp-10-1617-2010, 2010.
Ingram, H. A. P.: Size and shape in raised mire ecosystems: a geo-physical model, Nature, 297, 300-303, 1982.
Jones, M. C. and Yu, Z. C.: Rapid deglacial and early Holocene expansion of peatlands in Alaska, P. Natl. Acad. Sci. USA, 107, 7347–7352, 2010.
Joosten, H. and Clarke, D.: Wise use of mires and peatlands, Inter-national Mire Conservation Group and InterInter-national Peat Soci-ety, Saarij¨arvi, Finland, 2002.
Kaufman, D. S., Ager, T. A., Anderson, N. J., Anderson, P. M., An-drews, J. T., Bartlein, P. J., Brubaker, L. B., Coats, L. L., Cwynar, L. C., Duvall, M. L., Dyke, A. S., Edwards, M. E., Eisner, W. R., Gajewski, K., Geirsdottir, A., Hu, F. S., Jennings, A. E., Ka-plan, M. R., Kerwin, M. W., Lozhkin, A. V., MacDonald, G. M., Miller, G. H., Mock, C. J., Oswald, W. W., Otto-Bliesner, B. L., Porinchu, D. F., Ruhland, K., Smol, J. P., Steig, E. J., and Wolfe, B. B.: Holocene thermal maximum in the western Arctic (0–180◦W), Quaternary Sci. Rev., 23, 529–560, 2004.
Kleinen, T., Brovkin, V., von Bloh, W., Archer, D., and Munhoven, G.: Holocene carbon cycle dynamics, Geophys. Res. Lett., 37, L02705, doi:10.1029/2009GL041391, 2010.
Koehler, A.-K., Sottocornola, M., and Kiely, G.: How strong is the current carbon sequestration of an Atlantic blanket bog?, Glob. Change Biol., 17, 309–319, doi:10.1111/j.1365-2486.2010.02180.x, 2011.
Korhola, A.: Radiocarbon evidence for rates of lateral expansion in raised mires in southern Finland, Quaternary Res., 42, 299–307, 1994.
Korhola, A.: Holocene climatic variations in southern Finland re-constructed from peat-initiation data, Holocene, 5, 43–58, 1995. Korhola, A., Alm, J., Tolonen, K., Turunen, J., and Junger, H.: Three-dimensional reconstruction of carbon accumulation and CH4 emission during nine millennia in a raised mire, J. Qua-ternary Sci., 11, 161–165, 1996.
Korhola, A., Ruppel, M., Sepp¨a, H., V¨aliranta, M., Virtanen, T., and Weckstr¨om, J.: The importance of northern peatland expansion to the late-Holocene rise of atmospheric methane, Quaternary Sci. Rev., 29, 611–617, 2010.
Kuhry, P. and Turunen, J.: The postglacial development of boreal and subarctic peatlands, in: Boreal Peatland Ecosystems, edited by: Wieder, R. K. and Vitt, D. H., Ecological Studies Series, vol. 188, Springer, New York, 25–46, 2006.
Lappalainen, E.: General review on world peatlands and peat re-sources, in: Global peat rere-sources, International Peat Society, Jyska, Finland, 53–56, 1996.
Lehner, B. and D¨oll, P.: Development and validation of a global database of lakes, reservoirs and wetlands, J. Hydrol., 296, 1–22, 2004.
Limpens, J., Berendse, F., Blodau, C., Canadell, J. G., Freeman, C., Holden, J., Roulet, N., Rydin, H., and Schaepman-Strub, G.: Peatlands and the carbon cycle: from local processes to global implications – a synthesis, Biogeosciences, 5, 1475–1491, doi:10.5194/bg-5-1475-2008, 2008.
Loisel, J., Yu, Z. C., Parkesian, A., Nolan, J. T., and Slater, L. D.: Quantifying landscape morphology influence on peatland lateral expansion using ground penetrating radar (GPR) and peat core analysis, in review, 2012.
Lund, M., Lafleur, P. M., Roulet, N. T., Lindroth, A., Christensen, T. R., Aurela, M., Chojnicki, B. H., Flanagan, L. B., Humphreys, E. R., Laurila, T., Oechel, W. C., Olejnik, J., Rinne, J., Schubert, P., and Nilsson, M. B.: Variability in exchange of CO2 across 12 northern peatland and tundra sites, Glob. Change Biol., 16, 2436–2448, doi:10.1111/j.1365-2486.2009.02104.x, 2010. MacDonald, G. M., Beilman, D. W., Kremenetski, K. V., Sheng,
Y., Smith, L. C., and Valichko, A. A.: Rapid early development of circumarctic peatlands and atmospheric CH4and CO2 varia-tions, Science, 314, 285–288, 2006.
Malmer, N. and Wall´en, B.: Input rates, decay losses and accumula-tion rates of carbon in bogs during the last millennium: internal processes and environmental changes, Holocene, 14, 111–117, 2004.
M¨akil¨a, M.: Calculation of the energy content of mires on the basis of peat properties, Geol. S. Finland, Report of Investigation, 121, 1–73, 1994.
Maltby, E. and Immirzi, P.: Carbon dynamics in peatlands and other wetland soils, regional and global perspectives, Chemosphere, 27, 999–1023, 1993.
Matthews, E. and Fung, I.: Methane emission from natural wetlands: Global distribution, area, and environmental char-acteristics of sources, Global Biogeochem. Cy., 1, 61–86, doi:10.1029/GB001i001p00061, 1987.
Menviel, L. and Joos, F.: Toward explaining the Holocene car-bon dioxide and carcar-bon isotope records: Results from transient ocean carbon cycle-climate simulations, Paleoceanography, 27, PA1207, doi:10.1029/2011PA002224, 2012.
Moore, P. D.: The future of cool temperate bogs, Environ. Conserv., 29, 3–20, 2002.
Morris, P. J., Belyea, L. R., and Baird, A. J.: Ecohydrological feed-backs in peatland development: a theoretical modeling study, J. Ecol., 99, 1190–1201, 2011.
Nilsson, M., Sagerfors, J., Buffam, I., Laudon, H., Eriksson, T., Grelle, A., Klemedtsson, L., Weslien, P., and Lindroth, A.: Con-temporary carbon accumulation in a boreal oligotrophic minero-genic mire – A significant sink after accounting for all C-fluxes, Glob. Change Biol., 14, 2317–2332, doi:10.1111/j.1365-2486.2008.01654.x, 2008.
Post, W. M., Emanuel, W. R., Zinke, P. J., and Stangenberger, A. G.: Soil carbon pools and world life zones, Nature, 298, 156– 159, 1982.
Olefeldt, D., Roulet, N. T., Bergeron, O., Crill, P., B¨ackstrand, K., and Christensen, T. R.: Net carbon accumula-tion of a high-latitude permafrost palsa mire similar to permafrost-free peatlands, Geophys. Res. Lett., 39, L03501, doi:10.1029/2011GL050355, 2012.
Riley, J. L.: Peat and peatland resources of Northeastern Ontario, Ontario Geological Survey Miscellaneous Paper, 153, 1–155, 1994.
Riley, J. L.: Wetlands of the Hudson Bay Lowland: An Ontario Overview, Nature Conservancy of Canada, Toronto, ON, 156 pp., 2011.
Roulet, N. T.: Peatlands, carbon storage, greenhouse gases, and the Kyoto protocol: prospecs and significance for Canada, Wetlands, 20, 605–615, 2000.
Roulet, N. T., Lafleur, P. M., Richard, P. J. H., Moore, T. R., Humphreys, E. R., and Bubier, J.: Contemporary carbon balance and late Holocene carbon accumulation in a northern peatland, Glob. Change Biol., 13, 397–411, 2007.
Ruddiman, W. F., Kutzbach, J. E., and Vavrus, S. J.: Can natural or anthropogenic explanations of late-Holocene CO2 and CH4 increases be falsified?, Holocene, 21, 865–879, doi:10.1177/0959683610387172, 2011.
Schlesinger, W. H.: Carbon balance in terrestrial detritus, Annu. Rev. Ecol. Syst., 8, 51–81, 1977.
Schlesinger, W. H.: Soil organic matter: A source of atmospheric CO2, in: The role of terrestrial vegetation in the global carbon cycle, edited by: Woodwell, G. M., Wiley, New York, 111–127, 1984.
Schneider, J., Kutzbach, L., and Wilmking, M.: Carbon diox-ide exchange fluxes of a boreal peatland over a complete growing season, Komi Republic, NW Russia, Biogeochemistry, doi:10.1007/s10533-011-9684-x, in press, 2012.
Sheng, Y., Smith, L. C., MacDonald, G. M., Kremenetski, K. V., Frey, K. E., Velichko, A. A., Lee, M., Beilman, D. W., and Dubinin, P.: A high-resolution GIS-based inventory of the West Siberian peat carbon pool, Global Biogeochem. Cy., 18, GB3004, doi:10.1029/2003GB002190, 2004.
Sj¨ors, H.: Peat on earth: multiple use or conservation, Ambio, 9, 303–308, 1980.
Sj¨ors, H.: The zonation of northern peatlands and their importance for the carbon balance of the atmosphere, Int. J. Ecol. Environ. Sci., 7, 11–14, 1981.
Smith, L. C., MacDonald, G. M., Velichko, A. A., Beilman, D. W., Borisova, O. K., Frey, K. E., Kremenetski, K. V., and Sheng, Y.: Siberian peatlands a net carbon sink and global methane source since the Early Holocene, Science, 303, 353–356, 2004. St. Louis, V., Kelly, C., Duchemin, E., Rudd, J., and Rosenberg, D.:
Reservoir surfaces as sources of greenhouse gases to the atmo-sphere: a global estimate, BioScience, 50, 766–775, 2000. Sulman, B. N., Desai, A. R., Saliendra, N. Z., Lafleur, P. M.,
Flana-gan, L. B., Sonnentag, O., Mackay, D. S., Barr, A. G., and van der Kamp, G.: CO2fluxes at northern fens and bogs have opposite responses to inter- annual fluctuations in water table, Geophys. Res. Lett., 37, L19702, doi:10.1029/2010GL044018, 2010. Syed, K. H., Flanagan, L. B., Carlson, P. J., Glenn, A. J., and van
Gaalen, K. E.: Environmental control of net ecosystem CO2 ex-change in a treed, moderately rich fen in northern Alberta, Agr. Forest Meteorol., 140, 97–114, 2006.
Tarnocai, C., Kettles, I. M., and Lacelle. B.: Peatlands of Canada, Ottawa, Agriculture and Agri-Food Canada, Research Branch, Ottawa, ON, Canada, 2005.
Tarnocai, C., Canadell, J. G., Schuur, E. A. G., Kuhry, P., Mazhi-tova, G., and Zimov, S.: Soil organic carbon pools in the north-ern circumpolar permafrost region, Global Biogeochem. Cy., 23, GB2023, doi:10.1029/2008GB003327, 2009.
Tarnocai, C., Kuhry, P., Broll, G., Ping, C.-L., and Brown, J.: Peat-lands and their carbon dynamics: Comment on “PeatPeat-lands and their role in the global carbon cycle”, Eos, 93, 31, 2012. Tolonen, K. and Turunen, J.: Accumulation rates of carbon in mires
in Finland and implications for climate change, Holocene, 6, 171–178, 1996.
Turetsky, M. R., Manning, S., and Wieder, R. K.: Dating recent peat deposits, Wetlands, 24, 324–356, 2004.
Turetsky, M. R., Kane, E. S., Harden, J. W., Ottmar, R. D., Ma-nies, K. L., Hoy, E., and Kasischke, E. S.: Recent acceleration of biomass buring and carbon losses in Alaskan forest and peat-lands, Nat. Geosci., 4, 27–31, 2011a.
Turetsky, M. R., Donahue, W. F., and Benscoter, B. W.: Experi-mental drying intensifies burning and carbon losses in a north-ern peatland, Nat. Commun., 2, 514, doi:10.1038/ncomms1523, 2011b.
Turunen, J., Tomppo, E., Tolonen, K., and Reinikainen, A.: Esti-mating carbon accumulation rates of undrained mires in Finland – application to boreal and subarctic regions, Holocene, 12, 69– 80, 2002.
van Bellen, S., Dallaire, P.-L., Garneau, M., and Bergeron, Y.: Quantifying spatial and temporal Holocene carbon ac-cumulation in ombrotrophic peatlands of the Eastmain re-gion, Quebec, Canada, Global Biogeochem. Cy., 25, GB2016, doi:10.1029/2010GB003877, 2011.
Vitt, D. H., Halsey, L. A., Bauer, I. E., and Campbell C.: Spatial and temporal trends in carbon storage of peatlands of continental western Canada through the Holocene, Can. J. Earth Sci., 37, 683–693, 2000.
Vitt, D. H., Halsey, L. A., and Nicholson, B. J.: The Mackenzie River basin, in: The World’s Largest Wetlands: Ecology and Con-servation, edited by: Fraser, L. H. and Keddy, P. A., Cambridge University Press, Cambridge, 166–202, 2005.
Waddington, J. M. and Roulet, N. T.: Carbon balance of a boreal patterned peatland, Glob. Change Biol., 6, 87–97, 2000. Wieder, R. K.: Past, present and future peatland carbon balance –
An empirical model based on210Pb-dated cores, Ecol. Appl., 7, 321–336, 2001.
Yefremov, S. P. and Yefremova, T. T.: Stocks and forms of deposited carbon and nitrogen in bog ecosystems of west Siberia, in: West Siberian Peatlands and Carbon Cycle: Past and Present, edited by: Vasiliev, S. V., Titlyanova, A. A., and Velichko, A. A., Agen-stvo Sibprint, Novosibirsk, Russia, 148–151, 2001.
Yu, Z. C.: Holocene carbon accumulation of fen peatlands in boreal western Canada: Complex ecosystem response to climate varia-tion and disturbance, Ecosystems, 9, 1278–1288, 2006. Yu, Z. C.: Holocene carbon flux histories of the world’s peatlands:
55–69, doi:10.1029/2008GM000822, 2009.
Yu, Z. C., Loisel, J., Brosseau, D. P., Beilman, D. W., and Hunt, S. J.: Global peatland dynamics since the Last Glacial Maximum, Geophys. Res. Lett., 37, L13402, doi:10.1029/2010GL043584, 2010.
Yu, Z. C., Beilman, D. W., Frolking, S., MacDonald, G. M., Roulet, R. T., Camill, P., and Charman, D. J.: Peatlands and their role in the global carbon cycle, Eos, American Geophysical Union Transactions, 92, 97–98, 2011.
Yu, Z. C., Beilman, D. W., Frolking, S., MacDonald, G. M., Roulet, R. T., Camill, P., and Charman, D. J.: Peatlands as a model ecosystem of soil carbon dynamics: Reply to comment on “Peat-lands and their role in the global carbon cycle”, Eos, American Geophysical Union Transactions, 93, 31, 2012a.
Yu, Z. C., Loisel, J., Turetsky, M. R., Cai, S. S., Zhao, Y., Frolking, S., MacDonald, G. M., and Bubier, J. L.: Evidence for elevated emissions from high-latitude wetlands causing high atmospheric CH4concentration in the early Holocene, in review, 2012b. Zoltai, S. C.: Estimating the age of peat samples from their weight:
a study from west-central Canada, Holocene, 1, 68–73, 1991. Zoltai, S. C.: Cyclic development of permafrost in the peatlands of
northwestern Alberta, Canada, Arctic Alpine Res., 25, 240–246, 1993.