www.atmos-chem-phys.net/13/15/2013/ doi:10.5194/acp-13-15-2013
© Author(s) 2013. CC Attribution 3.0 License.
Chemistry
and Physics
Influence of biomass burning and anthropogenic emissions on ozone,
carbon monoxide and black carbon at the Mt. Cimone GAW-WMO
global station (Italy, 2165 m a.s.l.)
P. Cristofanelli1, F. Fierli1, A. Marinoni1, F. Calzolari1, R. Duchi1, J. Burkhart2, A. Stohl2, M. Maione3, J. Arduini3, and P. Bonasoni1
1National Research Council of Italy, Institute of Atmospheric Sciences and Climate, Bologna, Italy 2NILU – Norwegian Institute for Air Research, Kjeller, Norway
3University of Urbino “Carlo Bo”, Dipartimento di Scienze di Base e Fondamenti, Urbino, Italy
Correspondence to: P. Cristofanelli ([email protected])
Received: 15 June 2012 – Published in Atmos. Chem. Phys. Discuss.: 21 August 2012 Revised: 5 December 2012 – Accepted: 21 December 2012 – Published: 3 January 2013
Abstract. This work investigates the variability of ozone
(O3), carbon monoxide (CO) and equivalent black carbon (BC) at the Italian Climate Observatory “O. Vittori” (ICO-OV), part of the Mt. Cimone global GAW-WMO station (Italy). For this purpose, ICO-OV observations carried out in the period January 2007–June 2009, have been analyzed and correlated with the outputs of the FLEXPART La-grangian dispersion model to specifically evaluate the in-fluence of biomass burning (BB) and anthropogenic emis-sions younger than 20 days. During the investigation period, the average O3, CO and BC at ICO-OV were 54±3 ppb, 122±7 ppb and 213±34 ng m−3 (mean±expanded uncer-tainty withp <95 %), with clear seasonal cycles character-ized by summer maxima and winter minima for O3and BC and spring maximum and summer minimum for CO.
According to FLEXPART outputs, BB impact is max-imized during the warm months from July to September but appeared to have a significant contribution to the ob-served tracers only during specific transport events. We char-acterised in detail five “representative” events with respect to transport scales (i.e. global, regional and local), source re-gions and O3, CO and BC variations. For these events, very large variability of enhancement ratios O3/CO (from−0.22 to 0.71) and BC/CO (from 2.69 to 29.83 ng m−3ppb−1) were observed.
CO contributions related with anthropogenic emissions (COant) contributed to 17.4 % of the mean CO value ob-served at ICO-OV, with the warm months appearing
particu-larly affected by transport events of air-masses rich in anthro-pogenic pollution. The proportion of tracer variability that is described by FLEXPART COant peaked to 37 % (in May– September) for CO, 19 % (in May–September) for O3 and 32 % (in January–April) for BC. During May–September, the analysis of the correlation among CO, O3and BC as a func-tion of the COantindicated that ICO-OV was influenced by air-masses rich in anthropogenic pollution transported from the regional to the global scale. On the other side, CO and O3 were negatively correlated during October–December, when FLEXPART does not show significant presence of re-cent anthropogenic emissions and only a few observations are characterized by enhanced BC. Such behaviour may be attributed to an ensemble of processes concurrent in enhanc-ing O3 with low CO (upper troposphere/lower stratosphere intrusions) and to O3titration by NO in polluted air-masses along with lower photochemical activity. An intermediate sit-uation occurs in January–April when CO and O3were almost uncorrelated and BC enhancements were associated to rela-tively old (10 days) anthropogenic emissions.
1 Introduction
ences therein). Additionally, BC causes an indirect radiative forcing by modifying the concentration and size spectrum of cloud droplets (e.g. Lohmann et al., 2000; Forster et al., 2007) and it decreases the surface albedo of snow (e.g. Flan-ner et al., 2009).
Southern Europe and the Mediterranean basin (hereafter SE/MB) are recognised as a hot-spot region both in terms of climate change (e.g. Forster et al., 2007) and air-quality (Monks et al., 2009), also representing a major crossroad of different air mass transport processes (Lelieveld et al., 2002; Mill`an et al., 2006; Duncan et al., 2008). The transport of pol-luted air masses from Europe and other continents can influ-ence the variability of trace gases and aerosol over SE/MB. In particular, large amounts of anthropogenic pollutants emitted in continental Europe are transported towards the SE/MB es-pecially during summer (e.g. Duncan et al., 2008; Henne et al., 2005), when intense photochemical O3production also occurs (see for instance Vautard et al., 2005). Moreover, in the past decades many studies have revealed significant in-tercontinental transport of air-masses rich in anthropogenic pollutants or biomass burning emissions from North Amer-ica to Europe (e.g. Stohl and Trickl, 1999; Stohl et al., 2003, Auvray and Bay, 2005; Huntrieser et al., 2005). In particu-lar, biomass burning (BB) represents a major source of atmo-spheric pollutants and climate altering species (e.g. Crutzen and Andreae, 1990; Simmonds et al., 2005) and forest wild-fires have a considerable impact on the variability of CO, O3 and BC in the Northern Hemisphere (e.g. Novelli et al., 2003; van der Werf et al., 2006; Bond et al., 2011). BC produced by boreal wildfires accounts for 10 % of the annual anthro-pogenic BC emissions in the Northern Hemisphere (Bond et al., 2004). Previous studies have shown that the atmo-spheric compounds directly emitted by BB or produced by photochemical processes occurring within BB plumes can be transported over long distances, thus affecting both air qual-ity and climate from local to global scales (e.g. Val Martin et al., 2006 and references therein). SE/MB can also be affected by large wildfire events in Europe, especially during summer (e.g. Pace et al., 2006; Cristofanelli et al., 2007; Turquety et al., 2009).
The pollutant budget in the Mediterranean basin may also vary due to climate change. A dryer and warmer climate in the Mediterranean region, as projected by climate models, can lead both to an increase in pollution sources such as
2003) and only during the warm months an influence of air-mass transport from the regional boundary layer is detected due to convective processes and breeze regimes (Fischer et al., 2003; Van Dingenen et al., 2005). Three years of obser-vations are analysed here to identify the role of BB (as done in Cristofanelli et al., 2009 for a specific event) and anthro-pogenic pollution transport to the observed compound vari-ability. The Lagrangian atmospheric transport model FLEX-PART provides an estimate of the emission age of BB and anthropogenic emissions at ICO-OV and, coupled to the ob-servations, can allow to quantify the roles played by these emission types to the atmospheric composition variability.
2 Experimental and methodologies
2.1 Observations
At the ICO-OV, tropospheric O3 measurements have been carried out continuously since 1996 using a UV-photometric analyser (Dasibi 1108). The accuracy and quality of mea-surements (sampling time: 1 min, combined standard uncer-tainty less than ±2 ppb in the range 1–100 ppb) and sam-pling procedures are guaranteed within the GAW require-ments (WMO, 2002). In particular, the O3analyser working at ICO-OV was traced back to SRP#15 Standard Reference Photometer at EMPA (Swiss Federal Laboratories for Mate-rials Testing and Research).
0.72 %, total expanded uncertainty of 1.51 % (k=2). RGD detectors are well-known to be affected by non-linear re-sponse. At CMN, a set of calibration standard with different CO mixing ratios were unavailable. Thus, we tested the non-linearity of the GC-RGD system by inter-comparison with a GC-FID (Agilent GC6890) which was working in paral-lel at the measurement site since 2008, January. Even if only for the limited range of the typical mixing ratios observed at CMN, correction functions were obtained (by mean of linear correlation between the two data-sets) and applied to the data series presented in this work.
Continuous measurements of equivalent BC (hereafter BC) are obtained by a multi-angle absorption photometer (MAAP 5012, Thermo Electron Corporation) since March 2006. The reduction of light transmission at 670 nm, multi-ple reflection intensities, and air sammulti-ple volume are continu-ously integrated over the sample run period to provide a real time data output (1 min resolution, variable integration time) of BC concentration (Petzold et al., 2002).
To neglect the variability related with annual to seasonal scales, not captured by FLEXPART, we calculated tracer anomalies (1O3,1CO,1BC) by subtracting a 21-day run-ning means from the 3-h averaged values. These anomalies were used for the combined analyses with FLEXPART out-puts. During the period January 2007–June 2009, for which FLEXPART outputs are available (with only a data gap in July 2008), data coverage of 76 %, 97 % and 72 % have been achieved for CO, O3and BC, respectively.
2.2 FLEXPART simulations
The Lagrangian particle dispersion model FLEXPART (Stohl et al., 2005) was used to quantify the impact of an-thropogenic and BB emissions on the observed CO, BC and O3variability at ICO-OV. To this aim, 20 days backward (so-called “retroplume”) simulations were done from ICO-OV location with a time resolution of 3 h (http://transport.nilu. no/projects/eucaari).
Every simulation consists of 40 000 particles released in the volume of air sampled. The backward simulations are done with full turbulence and convection parameterizations. The FLEXPART retroplume output is proportional to the res-idence time of the particles in a given volume of air and cor-responds to a potential emission sensitivity. When convolved with the gridded CO emission fluxes from an emission in-ventory, maps of potential source contributions are obtained. Integrating these maps over the globe or over certain regions of specific interest (e.g., Europe, North America), yields a model-calculated CO tracer mixing ratio at the ICO-OV lo-cation. Since FLEXPART does not account for CO emissions older than 20 days, this model-calculated CO can only ex-plain a fraction of the CO mixing ratio observed at the ICO-OV, thus providing useful hints about specific contributions still not mixed within the tropospheric background. FLEX-PART considers both BB (hereinafter COfire) and
anthro-pogenic CO emissions (hereinafter COant). COfireemissions are estimated from fire observations obtained from MODIS on board the Aqua and Terra NASA satellites (Justice et al., 2002; Giglio et al., 2003). Hot spots detected with a con-fidence of 75 % or greater are used and combined with a land inventory with 1-km resolution to provide an emissions inventory. It is assumed that area burned is 180 ha per fire detection. A parameterization was applied to determine the biomass available to burning, the fraction actually burned, and the emission factors, which are all dependent on land use (see Stohl et al., 2007, for a description). For COant, EDGAR version 3.2 emission inventory for the year 2000 (fast track) on a 1×1 degree grid was used outside North America and Europe. Over Europe, the EMEP emission inventory for the year 2005 with a resolution of 0.5 degree was used. Over most of North America, the inventory of Frost et al. (2006) was used.
For the purpose of systematically evaluating the influence at ICO-OV of BB and anthropogenic emissions with age less than 20 days and thus still not fully mixed within the atmo-spheric background, we analysed the time series of COfire and COantemitted over the global domain.
FLEXPART also provides the information on the time spectrum of emission. In order to have a synthetic diagnos-tic, we defined a “dominant” emission age for BB and an-thropogenic emissions as the time (prior to observation and expressed in days) when the total COfire and COant contri-butions reached 75 % of their 20-day integrated value. Al-ternatively, emission age was also estimated by identifying the time when CO showed the maximum increase along the backward Lagrangian simulation. However, since no sub-stantial differences were observed, only the first method is used in this paper. O3, CO and BC ICO-OV observations are averaged over 3-h to compare directly to FLEXPART data.
3 Results
3.1 Atmospheric tracer annual cycles at ICO-OV
3.1.1 Carbon monoxide (CO)
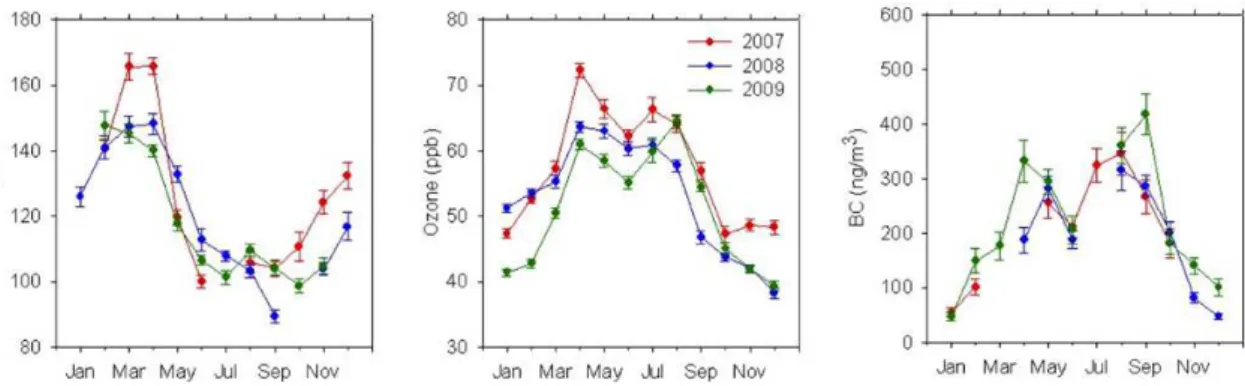
Fig. 1. Monthly means of CO, O3and BC at ICO-OV for the years 2007, 2008 and 2009. The error bars denote the average expanded uncertainties withp <95 %.
with those at other high-altitude mountain sites in Europe (Zelwegger et al., 2009; Gilge et al., 2010). The observed annual cycle results from varying contributions by natural and anthropogenic emissions, production vs. removal pro-cesses and atmospheric transport (e.g. Yurganov et al., 1999; Chevalier et al., 2008; Gilge et al., 2010). In particular, the slower chemical destruction leads to a longer CO lifetime in winter and subsequent accumulation, thus explaining the observed late winter/early spring peak. Long-range transport can play a significant role in determining the seasonal cy-cle: in fact, as pointed out by Pfister et al. (2006), Asian and North American anthropogenic CO sources can significantly impact tropospheric Europe between January and March in addition to continental emissions. Another possible contribu-tion that will be explored later comes from BB emissions that strongly impact CO variability during specific episodes (e.g. Yurganov et al., 2005; Cristofanelli et al., 2009; Zellweger et al., 2009).
3.1.2 Surface ozone (O3)
The simultaneously observed average O3for the years 2007– 2009 at ICO-OV was 54±3 ppb, in good agreement with earlier measurements (Cristofanelli et al., 2006). As reported by Fig. 1, the annual O3 cycle is characterised by a win-ter minimum and two peaks: (1) in spring (in April, for the three years here considered) and (2) in summer (from July to August). This is a common feature for high-altitude mea-surement sites in Europe (e.g. Chevalier et al., 2007; Gilge et al., 2010). The summer peak is usually explained by in-creased photochemical production of O3 in the lower tro-posphere: summer fair and warm weather conditions con-tribute to direct O3 production from anthropogenic precur-sors and favour the export of polluted air masses from the boundary layer to the free troposphere of continental Europe (Henne et al, 2005; Cristofanelli et al., 2007). At middle lat-itudes in the Northern Hemisphere, the spring O3maximum can be related to the accumulation of precursors (as seen at ICO-OV for CO) during winter and subsequent O3 pro-duction (Monks, 2000; Virganzan, 2004).
Stratosphere-to-troposphere transport (STT) might also increase O3at ICO-OV during spring (Stohl et al., 2000), even if more recent analyses (Cristofanelli et al., 2006) also indicate high STT influence during autumn and winter.
3.1.3 Equivalent black carbon (BC)
The average monthly BC concentration during the year 2007–2009 was 213±34 ng m−3. This value is comparable with typical average levels recorded at European continen-tal background sites (Van Dingenen et al., 2005; Putaud et al., 2004). Similarly to O3(Fig. 1), the annual cycle is char-acterised by the presence of a winter minimum (December– January) and maxima in spring (April–May) and late summer (August–September). This behaviour probably reflects the higher efficiency of uplift during warmer months and the sub-sequent transport of polluted air masses from the boundary layer to the measurement site (Marinoni et al., 2008; Cristo-fanelli et al., 2007). Interestingly, a secondary minimum in BC was observed during June when wet deposition is ex-pected to peak at CMN, due to maximum rainfall. Large vari-ability characterises the BC annual cycle with monthly val-ues spanning almost an order of magnitude from 50 ng m−3 to 400 ng m−3.
4 Role of biomass burning
The identification of BB events at ICO-OV is done here based on a combination of observation and model analysis.
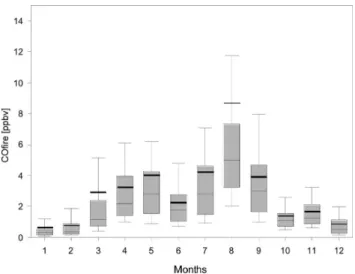
Fig. 2. Monthly distributions of FLEXPART COfireat ICO-OV dur-ing the period January 2007–July 2009. The boxes and whisker de-note the 10, 25, 50, 75 and 90 percentiles. Bold lines represent av-erage values.
at ICO-OV (see Cristofanelli et al., 2009). The COfire con-tribution shows a clear annual cycle with the highest values during the warm months: maximum monthly average values were observed in July/September (4.2 and 3.6 ppb, respec-tively) and August (8.6 ppb) and a secondary maximum in late spring (4.0 ppb in May). As deduced by the increase in the lowest percentiles of the monthly distributions (Fig. 2), these higher values were due both to an increase of the COfire baseline value and to the occurrence of specific events, as tes-tified by the large upper percentiles.
To identify at ICO-OV the presence of BB plumes, we considered the time periods for which FLEXPART COfire continuously exceeded 10 ppb for more than 12 h. Figure 3 reports CO observed at ICO-OV (black points) together with calculated FLEXPART COfire (red line): time periods for which the selection criterion is fulfilled are highlighted with coloured dots, scaled on the fire emission age deduced by FLEXPART outputs. Following FLEXPART, COfire en-hancements occur sporadically and for a limited period of time. By considering only the period with COfire exceeding 10 ppb, 16 events with a duration ranging from 12 to 72 h were identified, for a total of 21 days over the three years. Based on the FLEXPART analyses, for these events the trans-port of BB emissions occurs at very different scales: six events originated from the SE/MB region, two events from the Balkan peninsula, one event from Russia. Long range transport may have a likely role with 5 events from North America, one from Central America and one from equatorial Africa. The majority of BB events (11) occurred from May to September, thus confirming that transport of BB emissions mostly occurred during warm months. Over the 16 events detected by FLEXPART outputs, those having “local” BB source were characterized for the greatest part (6/8 events)
by clear CO enhancements (1CO>0 ppb) in respect to the average behaviour obtained by applying the 21-day running mean, those having “global” sources were characterized by negative or non-significant 1CO (7/7) and the only event that was attributed to emission occurring at “regional” scale showed a positive1CO.
Fig. 3a. Time series of observed CO at ICO-OV (black dots) with FLEXPART COfire(red line). Observations at ICO-OV are tagged with the FLEXPART fire emission age (colour scale) when FLEXPART fire CO exceeded 10 ppb. FLEXPART COfireis plotted with a positive constant bias of 50 ppb to reduce the extent of y-axis.
Fig. 3b. Time series of observed CO concentration at ICO-OV (black dots) with FLEXPART COfire(red line) for 11 March–6 April 2009. Observations at ICO-OV are tagged with the FLEXPART fire emission age (colour scale). FLEXPART CO is plotted with a positive bias of 50 ppb to reduce the extent of y-axis.
compactness of the FLEXPART retroplume that indicates a persistent and robust transport pattern; (2) the biomass burn-ing emission based on fire observations, further supported by satellite CO observations (MOPITT instrument on board of on NASA’s EOS Terra spacecraft) showing enhanced CO in the BB source regions identified by FLEXPART (not shown here). Moreover, Real et al. (2007) showed that the mixing ratio of CO in forest fire plumes decreases by 50 % during a 5-day transport due to atmospheric mixing. Additionally, for the event IV, injection of BB emissions into tropical air masses with low pre-existing CO mixing ratios may lead to CO values still lower than those typically observed in the middle latitudes (WMO, 2011). Thus, the advection of this
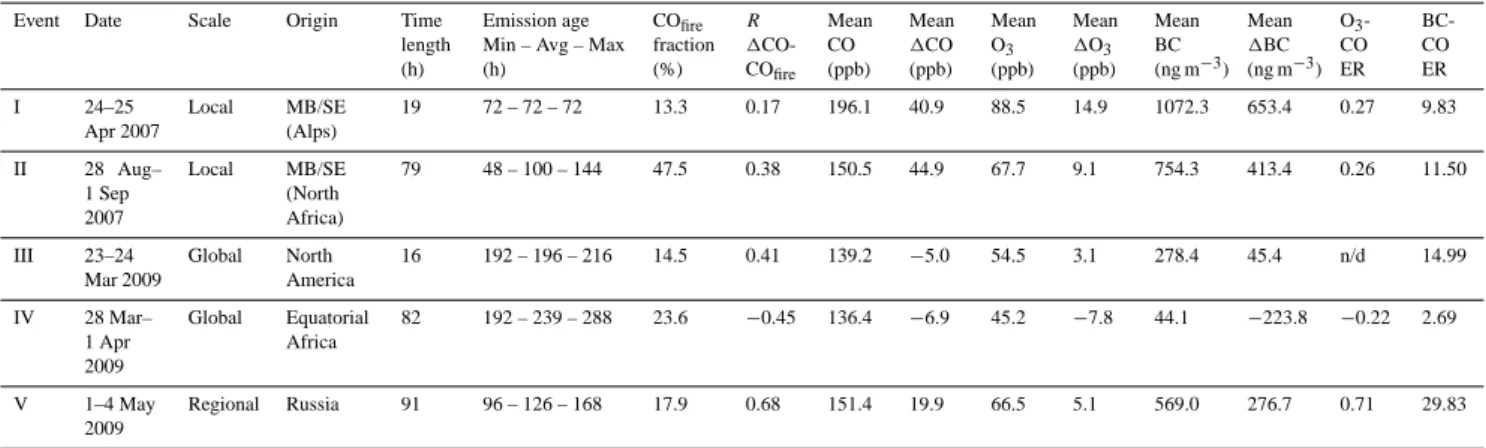
Table 1. List of the five “representative” BB events at ICO-OV as deduced by FLEXPART analyses. For each event we reported: start and end dates (“Date”), transport-scale (“Scale”), the emission region (“Origin”), the range (minimum, mean and maximum values) of representative emission ages during the event (“Emission age”), the averaged fraction of FLEXPART CO fire contribution (“COfirefraction”), the linear correlation coefficient between1CO and COfire(“R”), the mean CO and1CO at ICO-OV (“Mean CO”; “Mean1CO”), the mean O3 and1O3at ICO-OV (“Mean O3”; “Mean O3”), the mean BC and1BC at ICO-OV (“Mean BC”; “Mean BC”), the calculated O3-CO and BC-CO enhancement ratios (“O3-CO ER”; “BC-CO ER”).
Event Date Scale Origin Time length (h)
Emission age Min – Avg – Max (h) COfire fraction (%) R 1 CO-COfire Mean CO (ppb) Mean 1CO (ppb) Mean O3 (ppb) Mean
1O3
(ppb) Mean BC (ng m−3)
Mean
1BC (ng m−3)
O3 -CO ER BC-CO ER I 24–25 Apr 2007 Local MB/SE (Alps)
19 72 – 72 – 72 13.3 0.17 196.1 40.9 88.5 14.9 1072.3 653.4 0.27 9.83
II 28 Aug– 1 Sep 2007
Local MB/SE (North Africa)
79 48 – 100 – 144 47.5 0.38 150.5 44.9 67.7 9.1 754.3 413.4 0.26 11.50
III 23–24 Mar 2009
Global North America
16 192 – 196 – 216 14.5 0.41 139.2 −5.0 54.5 3.1 278.4 45.4 n/d 14.99
IV 28 Mar– 1 Apr 2009
Global Equatorial Africa
82 192 – 239 – 288 23.6 −0.45 136.4 −6.9 45.2 −7.8 44.1 −223.8 −0.22 2.69
V 1–4 May 2009
Regional Russia 91 96 – 126 – 168 17.9 0.68 151.4 19.9 66.5 5.1 569.0 276.7 0.71 29.83
averaged (COres, Ores3 , BCres)with respect to the mean diur-nal variation estimated in the 21 days around the BB event. The different scatter of data among the detected events (with R values ranging from−0.14 for the event III to 0.93 for the event I) is indicative of a great variability of chemical reac-tivity in air-masses potentially impacted by BB.
Previous studies (see Val Martin et al., 2006 and refer-ences therein) showed that the slope of the linear fit of O3 versus CO can be used to evaluate the O3/CO enhancement ratio (ER), i.e about the amount of O3molecule produced per CO molecule emitted. We calculated the linear fit by apply-ing the reduced major axis (RMA) technique to four events characterised by O3-CO linear correlation coefficients larger than 0.30 (see Table 1). The range of the positive O3/CO ER (0.27–0.71) was in relatively good agreement with previous characterization of BB plumes. Val Martin et al. (2006) re-ported ER ranging from 0.14 to 0.89 in boreal fire plumes ob-served at the Azores Islands, while Bertschi and Jaffe (2005) found ER from 0.15 to 0.84 in plumes from Asian boreal wildfires over Northwest US, suggesting that significant O3 production can occur in BB plumes probably due to the slow recycling of PAN, HNO3 and organic nitrates (Honrath et al., 2004; Bertschi and Jaffe, 2005). A negative value of -0.22 is observed during event IV. Negative or not-significant O3/CO ER have been already observed in aged BB plumes by Val Martin et al. (2006) and Real et al. (2007). This was attributed to the high aerosol concentrations within fire emis-sion plumes or other processes affecting night-time chem-istry (i.e. hydrolysis of N2O5)as well as O3 loss by reac-tion with organic compounds during long-range transport. Real et al. (2006) showed that the strong aerosol light ex-tinction in dense BB smoke plumes can decrease O3 forma-tion efficiency. In our case, a strong Saharan dust transport event was also detected at ICO-OV by in-situ and satellite
(MODIS) observations. This could possibly lead to heteroge-neous removal of O3and its precursors (via HNO3and NO3 depletion) and by decreasing photolysis rate (e.g. He and Carmichel, 1999; Balis et al., 2000; Harrison et al., 2001). Depletion of O3 in Saharan dust layers was systematically observed at ICO-OV by Bonasoni et al. (2004).
Fig. 4. Relationship between observed COres, Ores3 and BCresduring the five representative BB events listed in Table 1.
2011). Secondly, Pan et al. (2011) showed that BC/CO ERs are strongly influenced by rain washout and/or large environ-mental RH along the transport pathways. In particular, dry conditions dominated at ICO-OV during event V, with RH values well below 60 %. Moreover, as deduced by the analy-sis of meteorological analyses based on the Global Data As-similation System (GDAS) by the National Centre for Envi-ronmental Prediction (NCEP), also along the transport path, dry conditions prevailed for this event (average RH values: 59 %), suggesting that rain washout or removal processes in high RH environment were unlikely for this specific event. Finally, it cannot be completely excluded anthropogenic con-tribution within BB plumes, which can increase the slope of the BC-CO correlation. As reported by Cristofanelli et al. (2009), at ICO-OV, anthropogenic pollution plumes from the polluted Po basin can be characterised by ERs higher than 14 ng m−3ppb−1. FLEXPART retroplume analyses (here not shown) indicated significant footprint emission sensitivity over the central/northern France and the eastern Po basin for the air-masses reaching ICO-OV during event III and V, re-spectively. Thus, it is possible that mixing with polluted air-masses occurred 1–2 days before the arriving of air-air-masses at the measurement site.
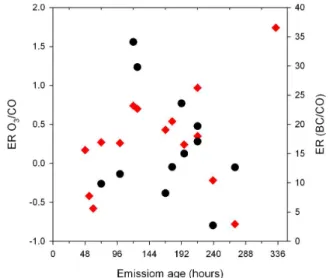
To provide a more robust characterization of the O3/CO and BC/CO ER as a function of the BB plume ages, we con-sidered the 16 BB events identified by FLEXPART (Fig. 5). By excluding event IV (as discussed before) and a further very old BB event (representative emission age: 273 h), we observed for O3a good qualitative agreement with previous investigations showing a general increase of ER values with the ageing of BB plumes (e.g. Pfister et al., 2006; Val Martin et al., 2006; Real et al., 2007; Cristofanelli et al, 2009), prob-ably indicating the role of PAN, HNO3and organic nitrates, which favor the photochemical formation of O3. On the other side a general decrease of ERs with increasing emission age has been observed for BC, possibly related to a more
effi-Fig. 5. ERs of O3(red) and BC (black) relative to CO observed for the 16 BB events detected at CMN by FLEXPART.
cient scavenging of aerosol particles during long atmospheric transport. On the other side we did not obtain a clear rela-tionship between the type of vegetation burnt or the differ-ent source regions with the ERs. This could indicate that the plume aging is the main parameters for determining ERs in relatively aged (i.e. older than 2 days) BB plumes. However, a number of uncertainties related with the actual type of com-bustion (e.g. smoldering vs. flaming), actual composition of the fuel, its moisture and structure (see Andrea and Merlet, 2001) can affect our results.
5 Role of anthropogenic emissions
Fig. 6. Monthly distributions of FLEXPART daily COant (upper plot) with related representative emission ages (bottom plot) at ICO-OV during the period January 2007–July 2009. The boxes and whiskers denote the 10th, 25th, 50th, 75th and 90th percentiles. Bold lines represent average value. Data at 3-h resolution have been shown.
by FLEXPART. The 20-day old FLEXPART COant has an average value of 22.4 ppb, which corresponds to 17.4 % of the mean CO value observed at ICO-OV during the same period. It is difficult to recognise a clear yearly cycle of COant (Fig. 6): the highest monthly COant is found for April (27.7 ppb) and the lowest ones in autumn and early winter (January 16.8 ppb, October 19.3 ppb and November 18.5 ppb). In particular, April 2007 was characterised by higher average COant(+25 %) than April 2008 and 2009, in good agreement with the highest observed CO at ICO-OV (see Fig. 1). This suggests that the transport variability of an-thropogenic CO simulated by FLEXPART can explain part of the inter-annual CO variability observed at ICO-OV.
Larger upper percentiles of FLEXPART COant indicate that spring and summer (from April to September) are more affected by episodes with air-masses rich in anthropogenic CO. These events are typically due to relatively fresh emis-sions. The emission age median value for April–September is only 72 h, whereas it is 114 h from October to February. This can be explained by the more efficient export of CO from the planetary boundary layer to the altitude of ICO-OV during summer. FLEXPART also gives high COant in December with upper quantiles similar to those seen for the
Fig. 7. Fraction of COantat CMN (y-axis) as a function of source regions (stacked coloured bars) and representative emission age (x-axis).
warm months. However, the median emission age (129 h) is much higher than in summer. Even if a significant fraction of these high COant were still related with moderately aged (less than 96 h) European emissions, transport from North America significantly increased the emission age at ICO-OV during specific periods (e.g. 3–11 December 2008). This is in agreement with previous work showing that inter-continental transport can be a relevant source of polluted air-masses over Europe (e.g. Stohl and Trickl, 1999; Trickl et al., 2003).
With the aim of systematically investigate the source re-gions of COant as a function of the representative emis-sion ages, we calculated the average contribution to the to-tal COantat Mt. Cimone for different source regions tagged back by FLEXPART (i.e. Europe, Asia, North America and other continents). This analysis (see Fig. 7) suggests that the contributions related to the long-range transport from outside Europe became predominant for emission ages larger than 120 h. In particular, anthropogenic emissions from North America appeared to play a predominant role when the COant emission age exceeded 192 h. For emission ages older than 120 days not negligible contributions were also tagged to emissions from Asia (ranging from 4.7 to 11.7 %, as a func-tion of emission age) as well as from other continents (rang-ing from 3.9 to 11.5 %), with predominant contribution re-lated with transport of anthropogenic emission from Africa.
Fig. 8. Observed CO and O3anomalies (1CO and1O3)for January–April (top), May–September (middle) and October–December (bot-tom). Left column shows data tagged with BC concentrations observed at ICO-OV, while right column shows data tagged with emission age of COantfrom FLEXPART. Linear correlation coefficients between1CO and1O3(R) are reported for each plot in the left column. Data are averaged over a 24-h time window.
significantly contributed to the presence of the highest O3 and CO values observed at ICO-OV during late spring and summer. On the other hand,1O3is not correlated with1CO during January–April (R: −0.07). Nevertheless, the highest BC values (>400 ng m−3)were still observed together with positive1CO and1O3. During October–December,1CO and1O3 were negatively correlated (R: −0.51) indicating reduced photochemical production and/or O3depletion due to NO titration. In particular, positive1O3mostly coincides with negative1CO and low BC values, indicating that clean air-masses, possibly from the free troposphere or the lower stratosphere (e.g. Cristofanelli et al., 2006) could lead to O3 increase during these months.
Figure 8 also shows that, for May–September, the great-est fraction of observations tagged to COant<7 days were mostly associated with enhanced1CO,1O3and BC.
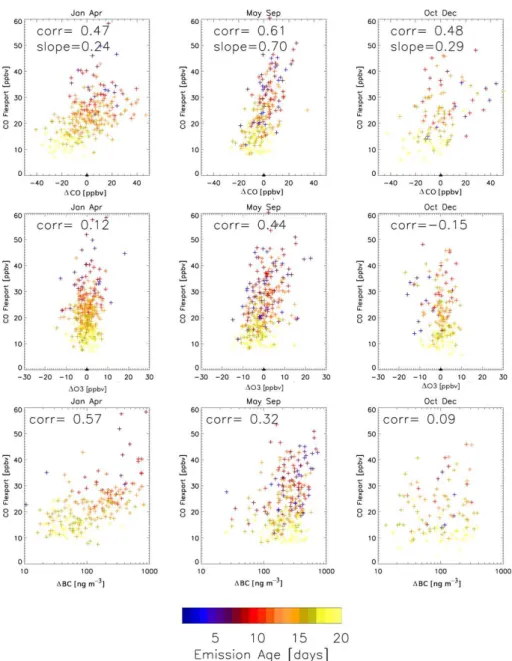
Fig. 9. Observed1CO (first row),1O3(second row) and BC (third row) versus FLEXPART COantfor January–April (left column), May– September (middle column) and October–December (right column). Data are averaged over 24 h and are tagged with emission age of COant (colored scale). The linear correlation coefficients (corr) is reported for all the scatter-plots while the slope values (slope) are only reported for the1CO-COantcorrelation.
In order to quantify the amount of observed variability that can be ascribed to transport diagnosed by FLEXPART, Fig. 9 reports the seasonal correlation between1CO,1O3and BC with COantfor 24-h time average. The days influenced by the BB transport events identified in the previous Section were not treated in this analysis. Correlation between FLEXPART COant with observed 1CO increases with the length of the time averaging window between 3 and 24 h because the effect of short timing errors in modelled contributions is reduced by increasing the average time window. Correlations decrease for even longer averaging times, so we present the results obtained for the 24 h analysis. FLEXPART COant correctly
young anthropogenic emissions (blue dots) were generally characterised by negative1O3further stressing the possible role played by NO titration in the local-regional European PBL during these months.
For BC, the linear correlation with COant is highest in January–April (R:0.57): as suggested by FLEXPART it is likely that enhancement in aerosol concentrations is due to relatively aged anthropogenic emissions. Significant correla-tion can be seen also in May–September with BC enhance-ments above 400 ng m−3 mainly related to emission ages lower than 7 days. In October–December BC and COant ap-pear to be almost uncorrelated with BC concentrations never increased up to 300 ng m−3 and minimum values of COant (see Fig. 6).
6 Conclusions
We quantified the variability of O3, CO and BC at the Mt. Cimone global GAW-WMO station (ICO-OV) and we inves-tigated the influence of biomass burning (BB) and anthro-pogenic emissions younger than 20 days.
In 2007–2009, the average O3, CO and BC at ICO-OV were 54±3 ppb, 122±7 ppb and 213±34 ng m−3(mean±
expanded uncertainty withp <95 %), with marked seasonal cycles characterized by summer maxima – winter minima for O3and BC, and a spring maximum – summer minimum for CO.
According to the FLEXPART simulations, impact of 20-day old BB emissions is maximized during the warm months from May to September, however BB emissions traced back by FLEXPART had a significant impact on the observed tracers only during 16 specific events (21 days over the 30 months here considered). Very large variability of enhance-ment ratios for O3/CO and for BC/CO were observed at ICO-OV during these events even if we observed a general in-creasing (dein-creasing) trend of O3/CO (BC/CO) with increas-ing emission ages.
As indicated by FLEXPART, 20-day old anthropogenic CO contributions can explain 17.4 % of the mean CO value observed at ICO-OV during the investigating period, with the warm months (from April to September) appearing to be particularly affected by transport events of air-masses rich in anthropogenic CO. Overall, the correlation analysis of
O3 values observed in presence of high BC concentration (>400 ng m−3). On the other side, CO and O3 were neg-atively correlated (R: −0.51) during October–December: such behaviour may be attributed to an ensemble of processes concurrent in enhancing O3with low CO (i.e upper tropo-sphere/lower stratosphere intrusions) and O3 titration with NO in polluted air-masses along with low photochemical activity. An intermediate situation occurs in January–April with CO and O3almost uncorrelated and BC enhancements mainly associated to relatively old (>7 days) anthropogenic emissions.
This work lead to the conclusion that trace gas and BC concentrations at the ICO-OV, which can be considered rep-resentative for SE/MB, are partially driven by local to global scale transport of anthropogenic emissions while, as diag-nosed by FLEXPART, BB appeared to have a minor impact on the annual mean. However, it should be clear in mind that these values represent minimal estimates about BB influence, since FLEXPART cannot quantify the contributions com-ing from the well-mixed background. FLEXPART showed to be accurate in capturing long-range transport, including BB plume (e.g. Stohl et al., 1998, 2006, 2007; Forster et al., 2001; Damoah et al., 2006; Lapina et al., 2008), even if, espe-cially for individual events of long-range BB transport, some uncertainties can affect the identification of the BB transport event at CMN, due to air-mass transport simulation, identi-fication of fires and estimate of emissions. However, as also shown by MOPITT satellite measurements for two case stud-ies of long-range BB transport, FLEXPART seems to be able in describing the impact of BB emissions. Nevertheless, fur-ther work is needed to explore the validity of the results here obtained for other sites in the SE/MB region, that can be af-fected by different transport patterns and/or emissions.
Supplementary material related to this article is
available online at: http://www.atmos-chem-phys.net/13/ 15/2013/acp-13-15-2013-supplement.pdf.
Acknowledgements. The research presented in this paper has been
Affairs and by ACTRIS, funded within the EC 7th Framework Programme under “Research Infrastructures for Atmospheric Research”. Part of this work has been supported by the Project of National Interest NEXTDATA. MOPITT (Measurements of Pollution in the Troposphere) CO data were provided by NCAR by the web site http://www.acd.ucar.edu/mopitt/visualize.shtml.
Edited by: H. Wernli
References
Andreae, M. O. and Gelencs´er, A.: Black carbon or brown car-bon? The nature of light-absorbing carbonaceous aerosols, At-mos. Chem. Phys., 6, 3131–3148, doi:10.5194/acp-6-3131-2006, 2006.
Andreae, M. O. and Merlet, P.: Emission of trace gases and aerosols from biomass burning, Global Biogeochem. Cy., 15, 955–966, 2001.
Auvray, M. and Bay, I.: Long-range transport to Europe: Seasonal variations and implications for the European ozone budget, J. Geophys. Res., 110, D11303, doi:10.1029/2004JD005503, 2005. Balis, D., Papayannis, A., Galani, E., Marenco, F., Santacesaria, V., Hamonou, E., Chazette, P., Ziomas, I., and Zerefos, C.:. Tropo-spheric LIDAR aerosol measurements and sun photometric ob-servations at Thessaliniki, Greece, Atmos. Environ., 34, 925– 932, 2000.
Bertschi, I. T. and Jaffe, D. A.: Long-range transport of ozone, carbon monoxide, and aerosols to the NE Pacific troposphere during the summer of 2003: Observations of smoke plumes from Asian boreal fires, J. Geophys. Res., 110, D05303, doi:10.1029/2004JD005135, 2005.
Bonasoni, P., Stohl, A., Cristofanelli, P., Calzolari, F., Colombo, T., and Evangelisti, F.: Background ozone variations at Mt. Cimone Station, Atmos. Environ., 34, 5183–5189, 2000.
Bonasoni, P., Cristofanelli, P., Calzolari, F., Bonaf`e, U., Evangelisti, F., Stohl, A., Zauli Sajani, S., van Dingenen, R., Colombo, T., and Balkanski, Y.: Aerosol-ozone correlations during dust transport episodes, Atmos. Chem. Phys., 4, 1201–1215, doi:10.5194/acp-4-1201-2004, 2004.
Bond, T. C., Streets, D. G., Yarber, K. F., Nelson, S. M., Woo, J.-H., and Klimont, Z.: A technology based global inventory of black carbon and organic carbon emissions from combustion, J. Geo-phys. Res., 109, D14203, doi:10.1029/2003JD003697, 2004. Bond, T. C., Zarzycki, C., Flanner, M. G., and Koch, D. M.:
Quan-tifying immediate radiative forcing by black carbon and organic matter with the Specific Forcing Pulse, Atmos. Chem. Phys., 11, 1505–1525, doi:10.5194/acp-11-1505-2011, 2011.
Conti, S., Meli, P., Minelli, G., Solimini, R., Toccaceli, V., Vichi, M., Beltrano, C., and Perini, L.: Epidemiologic study of mortality during the Summer 2003 heat wave in Italy, Environ. Res., 98, 390–399, 2005.
Chevalier, A., Gheusi, F., Delmas, R., Ord´o˜nez, C., Sarrat, C., Zbinden, R., Thouret, V., Athier, G., and Cousin, J.-M.: Influ-ence of altitude on ozone levels and variability in the lower troposphere: a ground-based study for western Europe over the period 2001–2004, Atmos. Chem. Phys., 7, 4311–4326, doi:10.5194/acp-7-4311-2007, 2007.
Chevalier, A., Gheusi, F., Atti´e, J.-L., Delmas, R., Zbinden, R., Athier, G., and Cousin, J.-M.: Carbon monoxide observations
from ground stations in France and Europe and long trends in the free troposphere, Atmos. Chem. Phys. Discuss., 8, 3313–3356, doi:10.5194/acpd-8-3313-2008, 2008.
Cristofanelli, P., Bonasoni, P., Tositti, L., Bonaf`e, U., Calzolari, F., Evangelisti, F., Sandrini, S., and Stohl, A.: A 6-year analysis of stratospheric intrusions and their influence on ozone at Mt. Ci-mone (2165 m above sea level), J. Geophys. Res., 111, D03306, doi:10.1029/2005JD006553, 2006.
Cristofanelli, P., Bonasoni, P., Carboni, G., Calzolari, F., Casarola, L., Zauli Sajani, S., and Santaguida, R.: Anomalous high ozone concentrations recorded at a high mountain station in Italy in summer 2003, Atmos. Environ., 41, 1383–1394, 2007.
Cristofanelli, P., Marinoni, A., Arduini, J., Bonaf`e, U., Calzolari, F., Colombo, T., Decesari, S., Duchi, R., Facchini, M. C., Fierli, F., Finessi, E., Maione, M., Chiari, M., Calzolai, G., Messina, P., Orlandi, E., Roccato, F., and Bonasoni, P.: Significant varia-tions of trace gas composition and aerosol properties at Mt. Ci-mone during air mass transport from North Africa – contributions from wildfire emissions and mineral dust, Atmos. Chem. Phys., 9, 4603–4619, doi:10.5194/acp-9-4603-2009, 2009.
Crutzen, P. J. and Andreae, M. O.: Biomass burning in the trop-ics: Impact on atmospheric chemistry and biogeochemical cy-cles, Science, 250, 1669–1678, 1990.
Crutzen, P. J., Lawrence, M. G., and P¨oschl, U.: On the back-ground photochemistry of tropospheric ozone, Tellus, 51, 123– 146, 1999.
Damoah, R., Spichtinger, N., Servranckx, R., Fromm, M., Elo-ranta, E. W., Razenkov, I. A., James, P., Shulski, M., Forster, C., and Stohl, A.: A case study of pyro-convection using transport model and remote sensing data, Atmos. Chem. Phys., 6, 173– 185, doi:10.5194/acp-6-173-2006, 2006.
Duncan, B. N., West, J. J., Yoshida, Y., Fiore, A. M., and Ziemke, J. R.: The influence of European pollution on ozone in the Near East and northern Africa, Atmos. Chem. Phys., 8, 2267–2283, doi:10.5194/acp-8-2267-2008, 2008.
Fischer, H., Kormann, R., Kl¨upfel, T., Gurk, Ch., K¨onigstedt, R., Parchatka, U., M¨uhle, J., Rhee, T. S., Brenninkmeijer, C. A. M., Bonasoni, P., and Stohl, A.: Ozone production and trace gas cor-relations during the June 2000 MINATROC intensive measure-ment campaign at Mt. Cimone, Atmos. Chem. Phys., 3, 725–738, doi:10.5194/acp-3-725-2003, 2003.
Flanner, M. G., Zender, C. S., Hess, P. G., Mahowald, N. M., Painter, T. H., Ramanathan, V., and Rasch, P. J.: Springtime warming and reduced snow cover from carbonaceous particles, Atmos. Chem. Phys., 9, 2481–2497, doi:10.5194/acp-9-2481-2009, 2009.
Forster, C., Wandinger, U., Wotawa, G., James, P., Mattis, I., Al-thausen, D., Simmonds, P., O’Doherty, S., Kleefeld, C., Jennings, S. G., Schneider, J., Trickl, T., Kreipl, S., J¨ager, H., and Stohl, A.: Transport of boreal forest fire emissions from Canada to Europe, J. Geophys. Res., 106, 22887–22906, 2001.
Hauglustaine, D. A., Horowitz, L. W., Jacob, D. J., Johnson, M., Law, K. S., Mickley, L. J., M¨uller, J.-F., Plantevin, P.-H., Pyle, J. A., Rogers, H. L., Stevenson, D. S., Sundet, J. K., van Weele, M., and Wild, O.: Radiative forcing in the 21st century due to ozone changes in the troposphere and the lower stratosphere, J. Geophys. Res., 108, 4292, doi:10.1029/2002JD002624, 2003. Giglio, L., Descloitres, J., Justice, C. O., and Kaufman, Y.: An
en-hanced contextual fire detection algorithm for MODIS, Remote Sens. Environ., 87, 273–282, 2003.
Gilge, S., Plass-Duelmer, C., Fricke, W., Kaiser, A., Ries, L., Buch-mann, B., and Steinbacher, M.: Ozone, carbon monoxide and nitrogen oxides time series at four alpine GAW mountain sta-tions in central Europe, Atmos. Chem. Phys., 10, 12295–12316, doi:10.5194/acp-10-12295-2010, 2010.
Harrison, S. P., Kohfeld, K. E., Roelandt, C., and Claquin, T.: The role of dust in climate changes today, at the Last Glacial Maxi-mum and in the future, Earth Sci. Rev., 54, 43–80, 2001. He, S. and Carmichael, G. R.: Sensitivity of photolysis rates and
ozone production in the troposphere to aerosol properties, J. Geo-phys. Res., 104, 26307–26324, 1999.
Henne, S., Dommen, J., Neininger, B., Reimann, S., Staehelin, J., and Pr`evˆot, A. S. H.: Influence of mountain venting in the Alps on the ozone chemistry of the lower free troposphere and the European pollution export, J. Geophys. Res., 110, D22307, doi:10.1029/2005JD005936, 2005.
Honrath, R. E., Owen, R. C., Val Martın, M., Reid, J. S., Lapina, K., Fialho, P., Dziobak, M. P., Kleissl, J., and Westphal, D. L.: Re-gional and hemispheric impacts of anthropogenic and biomass burning emissions on summertime CO and O3in the North At-lantic lower free troposphere, J. Geophys. Res., 109, D24310, doi:10.1029/2004JD005147, 2004.
Huntrieser, H., Heland, J., Schlager, H., Forster, C., Stohl, A., Aufmhoff, H., Arnold, F., Scheel, H. E., Campana, M., Gilge, S., Eixmann, R., and Cooper, O.: Intercontinental air pollution transport from North America to Europe: Experimental evidence from airborne measurements and surface observations, J. Geo-phys. Res., 110, D01305, doi:10.1029/2004JD005045, 2005. Justice, C. O., Giglio, L., Korontzi, S., Owens, J., Morisette, J. T.,
Roy, D., Descloitres, J., Alleaume, S., Petitcolin, F., and Kauf-man, Y.: The MODIS fire products, Remote Sens. Environ., 83, 244–262, 2002.
Kaneyasu, N., Igarashi, Y., Sawa, Y., Takahashi, H., Takada, H., Kumata, H., and Holler, R.: Chemical and optical prop-erties of 2003 Siberian forest fire smoke observed at the summit of Mt. Fuji, Japan, J. Geophys. Res., 112, D13214, doi:10.1029/2007JD008544, 2007.
doi:10.1029/2007JD009421, 2008.
Lelieveld, J., Berresheim, H., Borrmann, S., Crutzen, P. J., Den-tener, F. J., Fischer, H., Feichter, J., Flatau, P. J., Heland, J., Holzinger, R., Kormann, R., Lawrence, M. B., Levin, Z., Markowicz, K., Mihalopoulos, N., Minikin, A., Ramanthan, V., de Reus, M., Roelofs, G. J., Scheeren, H. A., Sciare, J., Schlager, H., Schulz, M., Siegmund, P., Steil, B., Stephanou, E. G., Stier, P., Traub, M., Warneke, C., Williams, J., and Ziereis, H.: Global air pollution crossroads over the Mediterranean, Science, 298, 794–799, 2002.
Lohmann, U., Feichter, J., Penner, J. E., and Leaitch, W. R.: Indi-rect effect of sulfate and carbonaceous aerosols: A mechanistic treatment, J. Geophys. Res., 105, 12193–12206, 2000.
Marinoni, A., Cristofanelli, P., Calzolari, F., Roccato, F., Bonaf`e, U., and Bonasoni, P.: Continuous measurements of aerosol physical parameters at the Mt. Cimone GAW Station (2165 m asl, Italy), Sci. Total Environ., 391, 241–251, 2008.
Mill`an, M., Sanz, J., Salvador, R., and Mantilla, E.:. Atmospheric dynamics and ozone cycles related to nitrogen deposition in the western Mediterranean, Environ. Poll., 118, 167–186, 2006. Monks, P.: A review of the observations and origins of the spring
maximum, Atmos. Environ, 34, 3545–3561, 2000.
Monks, P. S., Granier, C., Fuzzi, S., Stohl, A., Williams, M. L., Aki-moto, H., Amann, M., Baklanov, A., Baltensperger, U., Bey, I., Blake, N., Blake, R. S., Carslaw, K., Cooper, O. R., Dentener, F., Fowler, D., Fragkou, E., Frost, G. J., Generoso, S., Ginoux, P., Grewe, V., Guenther, A., Hansson, H. C., Henne, S., Hjorth, J., Hofzumahaus, A., Huntrieser, H., Isaksen, I. S. A., Jenkin, M. E., Kaiser, J., Kanakidou, M., Klimont, Z., Kulmala, M., Laj, P., Lawrence, M. G., Lee, J. D., Liousse, C., Maione, M., McFig-gans, G., Metzger, A., Mieville, A., Moussiopoulos, N., Orlando, J. J., O’Dowd, C. D., Palmer, P. I., Parrish, D. D., Petzold, A., Platt, U., P¨oschl, U., Pr´evˆot, A. S. H., Reeves, C. E., Reimann, S., Rudich, Y., Sellegri, K., Steinbrecher, R., Simpson, D., ten Brink, H., Theloke, J., van der Werf, G. R., Vautard, R., Vestreng, V., Lachokostas, Ch., and von Glasow, R.: Atmospheric compo-sition change – global and regional air quality, Atmos. Environ., 43, 5268–5350, 2009.
Novelli, P. C.: CO in the atmosphere: measurement techniques and related issues, Chemosphere, Global Change Sci., 1, 115–126, 1999.
Novelli, P. C., Masarie, K. A., Lang, P. M., Hall, B. D., Myers, R. C., and Elkins, J. W.: Reanalysis of tropospheric CO trends: Ef-fects of the 1997–1998 wildfires, J. Geophys. Res., 108, 4464, doi:10.1029/2002JD003031, 2003.
Mediterranean). 1. Influence of transport and identification of different aerosol types, Atmos. Chem. Phys., 6, 697–713, doi:10.5194/acp-6-697-2006, 2006.
Pan, X. L., Kanaya, Y., Wang, Z. F., Liu, Y., Pochanart, P., Aki-moto, H., Sun, Y. L., Dong, H. B., Li, J., Irie, H., and Takigawa, M.: Correlation of black carbon aerosol and carbon monoxide in the high-altitude environment of Mt. Huang in Eastern China, Atmos. Chem. Phys., 11, 9735–9747, doi:10.5194/acp-11-9735-2011, 2011.
Petzold, A., Kramer, H., and Sch¨onlinner, M.: Continuous measure-ment of atmospheric black carbon using a multi-angle absorption photometer, Environ. Sci. Pollut. Res., 4, 78–82, 2002.
Pfister, G., Petron, G., Emmons, L. K., Gille, J. C., Edwards, D. P., Lamarque, J. F., Attie, J. L., Granier, C., and Novelli, P. C.: Evaluation of CO simulations and the analysis of the CO budget for Europe, J. Geophys. Res.-Atmos., 109, D19304, doi:10.1029/2004JD004691, 2004.
Putaud, J.-P., Raes, F., Van Dingenen, R., Bruggemann, E., Fac-chini, M. C., Decesari, S., Fuzzi, S., Gehrig, R., Huglin, C., Laj, P., Lorbeer, G., Maenhaut, W., Mihalopoulos, N., Muller, K., Querol, X., Rodriguez, S., Schneider, J., Spindler, G,, Ten Brink, H., Torseth, K., and Wiedensohler, A.: A European aerosol phe-nomenology – 2: chemical characteristics of particulate matter at kerbside, urban, rural and background sites in Europe, Atmos. Environ., 38, 2579–2595, 2004.
Real, E., Law, K. S., Weinzierl, B., Fiebig, M., Petzold, A., Wild, O., Methven, J., Arnold, S., Stohl, A., Huntrieser, H., Roiger, A., Schlager, H., Stewart, D., Avery, M., Sachse, G., Brow-ell, E., Ferrare, R., and Blake, D.: Processes influencing ozone levels in Alaskan forest fire plumes during long-range trans-port over the North Atlantic, J. Geophys. Res., 112, D10S41, doi:10.1029/2006JD007576, 2007.
Seinfeld, J. H. and Pandis, S. N.: Atmospheric chemistry and physics: from air pollution to climate change, Wiley-Interscience, 1326 pp., New York, USA, 1998.
Simmonds, P., Manning, A., Derwent, R., Ciais, P., Ramonet, M., Kazan, V., and Ryall, D.: A burning question: Can recent growth rate anomalies in the greenhouse gases be attributed to large scale biomass burning events?, Atmos. Environ., 39, 2513–2517, doi:10.1016/j.atmosenv.2005.02.018, 2005.
Solomon, S., Qin, D., Manning, M., Alley, R. B., Berntsen, T., Bind-off, N. L., Chen, Z., Chidthaisong, A., Gregory, J. M., Hegerl, G. C., Heimann, M., Hewitson, B., Hoskins, B. J., Joos, F., Jouzel, J., Kattsov, V., Lohmann, U., Matsuno, T., Molina, M., Nicholls, N., Overpeck, J., Raga, G., Ramaswamy, V., Ren, J., Rustic-ucci, M., Somerville, R., Stocker, T. F., Whetton, P.,Wood R. A., and Wratt, D.:: Technical Summary, in Climate Change 2007: The Physical Science Basis. Contribution of Working Group I to the Fourth Assessment Report of the Intergovernmental Panel on Climate Change, edited by: Solomon, S., Qin D., Manning M., Chen Z., Marquis, M., Averyt K. B., Tignor, M., and Miller, H. L., Cambridge University Press, Cambridge, United Kingdom and New York, NY, USA, 2007.
Stohl, A. and Trickl, T.: A textbook example of long-range trans-port: Simultaneous observation of ozone maxima of stratospheric and North American origin in the free troposphere over Europe, J. Geophys. Res., 104, 30445–30462, 1999.
Stohl, A., Hittenberger, M., and Wotawa, G., Validation of the Lagrangian particle dispersion model FLEXPART against
largescale tracer experiment data, Atmos. Environ., 32, 4245– 4264, 1998.
Stohl, A., Spichtinger-Rakowsky, N., Bonasoni, P., Feldmann, H., Memmesheimer, M., Scheel, H. E., Trickl, T., Huebener, S. H., Ringer, W., and Mandl, M.: The influence of stratospheric intru-sions on alpine ozone concentrations, Atmos. Environ, 34, 1323– 1354, 2000.
Stohl, A., Huntrieser, H., Richter, A., Beirle, S., Cooper, O. R., Eckhardt, S., Forster, C., James, P., Spichtinger, N., Wenig, M., Wagner, T., Burrows, J. P., and Platt, U.: Rapid intercontinental air pollution transport associated with a meteorological bomb, Atmos. Chem. Phys., 3, 969–985, doi:10.5194/acp-3-969-2003, 2003.
Stohl, A., Forster, C., Frank, A., Seibert, P., and Wotawa, G.: Technical note: The Lagrangian particle dispersion model FLEXPART version 6.2, Atmos. Chem. Phys., 5, 2461–2474, doi:10.5194/acp-5-2461-2005, 2005.
Stohl, A., Andrews, E., Burkhart, J. F., Forster, C., Herber, A., Hoch, S. W. , Kowal, D., Lunder, C., Mefford, T., Ogren, J. A., Sharma, S., Spichtinger, N., Stebel, K., Stone, R., Str¨om, J., Tørseth, K., Wehrli, C., and Yttri, K. E.: Pan-Arctic enhancements of light absorbing aerosol concentrations due to North American boreal forest fires during summer 2004, J. Geophys. Res., 111, D22214, doi:10.1029/2006JD007216, 2006.
Stohl, A., Berg, T., Burkhart, J. F., Fjae’raa, A. M., Forster, C., Her-ber, A., Hov, Ø., Lunder, C., McMillan, W. W., Oltmans, S., Shio-bara, M., Simpson, D., Solberg, S., Stebel, K., Str¨om, J., Tørseth, K., Treffeisen, R., Virkkunen, K., and Yttri, K. E.: Arctic smoke – record high air pollution levels in the European Arctic due to agricultural fires in Eastern Europe in spring 2006, Atmos. Chem. Phys., 7, 511–534, doi:10.5194/acp-7-511-2007, 2007. Trickl, T., Cooper, O. R., Eisele, H., James, P., M¨ucke, R., and Stohl,
A.: Intercontinental transport and its influence on the ozone con-centrations over central Europe: Three case studies, J. Geophys. Res., 108, 8530, doi:10.1029/2002JD002735, 2003.
Turquety, S., Hurtmans, D., Hadji-Lazaro, J., Coheur, P.-F., Cler-baux, C., Josset, D., and Tsamalis, C.: Tracking the emission and transport of pollution from wildfires using the IASI CO re-trievals: analysis of the summer 2007 Greek fires, Atmos. Chem. Phys., 9, 4897–4913, doi:10.5194/acp-9-4897-2009, 2009. Val Martin, M., Honrath, R. E., Owen, R. C., Pfister, G., Fialho,
P., and Barata, F.: Significant enhancements of nitrogen oxides, black carbon, and ozone in the North Atlantic lower free tropo-sphere resulting from North American boreal wildfires, J. Geo-phys. Res., 111, D23S60, doi:10.1029/2006JD007530, 2006. van der Werf, G. R., Randerson, J. T., Giglio, L., Collatz, G. J.,
Kasibhatla, P. S., and Arellano Jr., A. F.: Interannual variabil-ity in global biomass burning emissions from 1997 to 2004, At-mos. Chem. Phys., 6, 3423–3441, doi:10.5194/acp-6-3423-2006, 2006.
Van Dingenen, R., Putaud, J.-P., Martins-Dos Santos, S., and Raes, F.: Physical aerosol properties and their relation to air mass ori-gin at Monte Cimone (Italy) during the first MINATROC cam-paign, Atmos. Chem. Phys., 5, 2203–2226, doi:10.5194/acp-5-2203-2005, 2005.
A., Miller, L., Montzka, S., Murphy, D. M., Peischl, J., Ryerson, T. B. , Schwarz, J. P., Spackman, J. R., and Veres, P.: Biomass burning in Siberia and Kazakhstan as an important source for haze over Alaskan Arctic in April 2008, Geophys. Res. Lett., 36, L02813, doi:10.1029/2008GL036194, 2009.
World Meteorological Organization (WMO): Global Atmospheric Watch measurement guide, Tech. Doc. 1073, GAW Rep. 143, Geneva, Switzerland, 2002.
5, 563–573, doi:10.5194/acp-5-563-2005, 2005.