Women with Preterm Prelabor Rupture of Membranes
between 34 and 37 Weeks: A Randomized Controlled
Trial
David P. van der Ham1*, Sylvia M. C. Vijgen2, Jan G. Nijhuis1, Johannes J. van Beek3, Brent C. Opmeer4, Antonius L. M. Mulder5, Rob Moonen6, Marie¨t Groenewout7, Marie¨lle G. van Pampus7, Gerald D. Mantel8,
Kitty W. M. Bloemenkamp9, Wim J. van Wijngaarden10, Marko Sikkema11, Monique C. Haak12,
Paula J. M. Pernet13, Martina Porath14, Jan F. M. Molkenboer15, Simone Kuppens16, Anneke Kwee17, Michael E. Kars18, Mallory Woiski19, Martin J. N. Weinans20, Hajo I. J. Wildschut21,
Bettina M. C. Akerboom22, Ben W. J. Mol2, Christine Willekes1, on behalf of the PPROMEXIL trial group" 1Department of Obstetrics and Gynecology, Maastricht University Medical Center, GROW—School for Oncology and Developmental Biology, Maastricht, The Netherlands, 2Department of Obstetrics and Gynecology, Academic Medical Center Amsterdam, Amsterdam, The Netherlands,3Department of Obstetrics and Gynecology, VieCuri Medical Center, Venlo, The Netherlands,4Department of Clinical Epidemiology, Biostatistics and Bioinformatics, Academic Medical Center Amsterdam, Amsterdam, The Netherlands,5Department of Pediatrics, Maastricht University Medical Center, GROW—School for Oncology and Developmental Biology, Maastricht, The Netherlands, 6Department of Pediatrics, Atrium Medical Center, Heerlen, The Netherlands,7Department of Obstetrics and Gynecology, University Medical Center Groningen, Groningen, The Netherlands,8Department of Obstetrics and Gynecology, Isala Klinieken, Zwolle, The Netherlands,9Department of Obstetrics and Gynecology, Leiden University Medical Center, Leiden, The Netherlands,10Department of Obstetrics and Gynecology, Bronovo Hospital, The Hague, The Netherlands,11Department of Obstetrics and Gynecology, Ziekenhuisgroep Twente, Almelo, The Netherlands,12Department of Obstetrics and Gynecology, VU University Medical Center, Amsterdam, The Netherlands,13Department of Obstetrics and Gynecology, Kennemer Gasthuis, Haarlem, The Netherlands,14Department of Obstetrics and Gynecology, Maxima Medical Center, Veldhoven, The Netherlands,15Department of Obstetrics and Gynecology, Sint Anna Hospital, Geldrop, The Netherlands,16Department of Obstetrics and Gynecology, Catharina Hospital, Eindhoven, The Netherlands,17Department of Obstetrics and Gynecology, University Medical Center, Utrecht, The Netherlands, 18Department of Obstetrics and Gynecology, Sint Antonius Hospital, Nieuwegein, The Netherlands, 19Department of Obstetrics and Gynecology, Sint Radboud University Medical Center, Nijmegen, The Netherlands,20Department of Obstetrics and Gynecology, Gelderse Vallei Hospital, Ede, The Netherlands,21Department of Obstetrics and Gynecology, Erasmus Medical Center, Rotterdam, The Netherlands,22Department of Obstetrics and Gynecology, Albert Schweitzer Hospital, Dordrecht, The Netherlands
Abstract
Background:At present, there is insufficient evidence to guide appropriate management of women with preterm prelabor rupture of membranes (PPROM) near term.
Methods and Findings:We conducted an open-label randomized controlled trial in 60 hospitals in The Netherlands, which included non-laboring women with.24 h of PPROM between 34+0and 37+0wk of gestation. Participants were randomly
allocated in a 1:1 ratio to induction of labor (IoL) or expectant management (EM) using block randomization. The main outcome was neonatal sepsis. Secondary outcomes included mode of delivery, respiratory distress syndrome (RDS), and chorioamnionitis. Patients and caregivers were not blinded to randomization status. We updated a prior meta-analysis on the effect of both interventions on neonatal sepsis, RDS, and cesarean section rate. From 1 January 2007 to 9 September 2009, 776 patients in 60 hospitals were eligible for the study, of which 536 patients were randomized. Four patients were excluded after randomization. We allocated 266 women (268 neonates) to IoL and 266 women (270 neonates) to EM. Neonatal sepsis occurred in seven (2.6%) newborns of women in the IoL group and in 11 (4.1%) neonates in the EM group (relative risk [RR] 0.64; 95% confidence interval [CI] 0.25 to 1.6). RDS was seen in 21 (7.8%, IoL) versus 17 neonates (6.3%, EM) (RR 1.3; 95% CI 0.67 to 2.3), and a cesarean section was performed in 36 (13%, IoL) versus 37 (14%, EM) women (RR 0.98; 95% CI 0.64 to 1.50). The risk for chorioamnionitis was reduced in the IoL group. No serious adverse events were reported. Updating an existing meta-analysis with our trial results (the only eligible trial for the update) indicated RRs of 1.06 (95% CI 0.64 to 1.76) for neonatal sepsis (eight trials, 1,230 neonates) and 1.27 (95% CI 0.98 to 1.65) for cesarean section (eight trials, 1,222 women) for IoL compared with EM.
Conclusions:In women whose pregnancy is complicated by late PPROM, neither our trial nor the updated meta-analysis indicates that IoL substantially improves pregnancy outcomes compared with EM.
Trial registration:Current Controlled Trials ISRCTN29313500
Citation:van der Ham DP, Vijgen SMC, Nijhuis JG, van Beek JJ, Opmeer BC, et al. (2012) Induction of Labor versus Expectant Management in Women with Preterm Prelabor Rupture of Membranes between 34 and 37 Weeks: A Randomized Controlled Trial. PLoS Med 9(4): e1001208. doi:10.1371/journal.pmed.1001208 Academic Editor:Philippa Middleton, The University of Adelaide, Australia
ReceivedSeptember 5, 2011;AcceptedMarch 16, 2012;PublishedApril 24, 2012
Copyright:ß2012 van der Ham et al. This is an open-access article distributed under the terms of the Creative Commons Attribution License, which permits unrestricted use, distribution, and reproduction in any medium, provided the original author and source are credited.
Funding:The trial was funded by ZonMW (The Medical and Health Research Council of The Netherlands) grant number 94507212. The funders had no role in study design, data collection and analysis, decision to publish, or preparation of the manuscript.
Competing Interests:The authors have declared that no competing interests exist.
Abbreviations:PPROM, preterm prelabor rupture of membranes; PPROMEXIL, PPROM Expectant Management versus Induction of Labor; CI, confidence interval; EM, expectant management; HELLP syndrome, hemolysis, elevated liver enzymes, and low platelets; IoL, induction of labor; NICU, neonatal intensive care unit; RDS, respiratory distress syndrome; RR, relative risk
* E-mail: [email protected]
Introduction
Preterm prelabor rupture of membranes (PPROM) complicates 1%–5% of all pregnancies and accounts for 30%–40% of all preterm deliveries [1–3]. It is associated with increased fetal and maternal morbidity and mortality [4–7].
There is no consensus on the management of women with PPROM between 34+0
and 37+0
wk. The American Congress of Obstetricians and Gynecologists guidelines recommend induction of labor (IoL) if PPROM occurs at or beyond 34+0
wk of gestation [8]. The Royal College of Obstetricians and Gynaecologists guidelines state that delivery should be considered at 34+0
wk of gestation and recommend that women with PPROM who are managed expectantly beyond 34 wk of gestation be counseled about the increased risk of chorioamnionitis and the presumed decreased risk of neonatal respiratory problems, admission for neonatal intensive care, and cesarean section [9]. The Dutch Society for Obstetrics and Gynecology guidelines advise expectant management (EM) until 35+0wk and recommend discussing IoL
with the patient from 35+0
wk onwards, whereas IoL is advocated beyond 37+0
wk [10]. Canadian and Australian surveys identify a lack of consensus on management in women with PPROM between 34+0
and 36+0
wk in those countries [11,12].
A recent Cochrane review on the management of PPROM prior to 37 wk concluded that there is insufficient evidence to guide clinical practice in the management of PPROM [7]. In view of this lack of knowledge, we undertook a randomized controlled trial called PPROM Expectant Management versus Induction of Labor (PPROMEXIL).
In this trial, we tested the hypothesis that IoL reduces neonatal sepsis without increasing neonatal morbidity due to prematurity and without increasing the assisted delivery rate as compared to EM in women with PPROM between 34+0
and 37+0
wk of gestation.
Methods
We conducted a multicenter, parallel, open-label randomized controlled trial in The Netherlands, in which all eight academic and 52 non-academic hospitals participated. The study was approved by the medical ethics committee of the Maastricht University Medical Center, Maastricht, The Netherlands (Ref. no. MEC 05-240, 8 March 2006). Local approval was given by the boards of each of the participating hospitals. After the start of the trial, no changes were made to the trial protocol or to the trial outcome measures. The protocol has been published previously [13]. The trial was registered in the ISRCTN register (ISRCTN29313500; Text S1). This trial is reported in concor-dance with the CONSORT 2010 checklist (Text S2).
Patients
Women with a singleton or twin pregnancy presenting with PPROM between 34+0
and 36+6
wk of gestation who were not in labor within 24 h after rupture of membranes were eligible for this study. Women in whom PPROM was diagnosed after 26+0
wk, but who had not delivered by 34+0
wk of gestational age were also eligible for participation. All eligible patients were counseled about participation in the study within the first 24 h after PPROM had occurred. Informed consent was obtained from all who partici-pated in the study at least 24 h after PPROM, as soon as was possible and convenient. Breech presentation was not an exclusion criterion, as both cesarean and vaginal delivery were allowed in the protocol. Women with a monochorionic multiple pregnancy; abnormal (non-reassuring) cardiotocogram; meconium-stained
amniotic fluid; signs of intrauterine infection; major fetal anomalies; hemolysis, elevated liver enzymes, and low platelets (HELLP syndrome); or severe preeclampsia were not eligible for the study. Women who declined consent for randomization but authorized use of their medical data were included in the database and were followed in the patient preference arm.
Rupture of membranes was diagnosed based on history and clinical findings such as gross vaginal fluid loss, in combination with other available diagnostic test methods when necessary. The final decision on whether or not a patient had rupture of membranes was made by the attending staff.
Gestational age was based either on first trimester ultrasound scan or, in women with a regular cycle, on the first day of the last menstrual period if the expected date of delivery differed less than 7 d from that estimated by ultrasound. In women with an unknown/ uncontrolled pregnancy beyond the first trimester, gestational age was estimated by second trimester ultrasound measurements.
Randomization
After written informed consent had been obtained, patient data were entered in a password-protected web-based database. Randomization was performed on a central password-protected web-based application developed by the clinical trial unit of the Academic Medical Center Amsterdam, Amsterdam, The Nether-lands. The randomization sequence was created using a block size of four, stratified for center and parity, in a 1:1 ratio for immediate IoL versus EM.
Procedures
Induction of labor. Patients allocated to IoL were induced within 24 h after randomization. Induction was performed according to the national guidelines [14]. After vaginal examination labor was induced with either prostaglandin or oxytocin. In the case of planned cesarean section, the cesarean section was performed as soon as feasible after randomization.
Expectant management. Women randomized to EM were monitored according to local protocol until spontaneous delivery, which could be in an outpatient or an inpatient setting. Monitoring in both settings consisted of at least daily maternal temperature monitoring and twice weekly blood sampling for maternal leukocyte count and C-reactive protein measurement. When a patient in the EM group reached 37+0
wk of gestational age, labor was induced according to the national guidelines [10]. Whenever a patient with an indication for planned cesarean section was allocated to EM, the cesarean section was performed as soon as labor commenced. Labor was induced prior to 37+0
wk of gestation if there were clinical signs of infection or when another fetal or maternal indication occurred that warranted IoL.
Data Collection
At all local centers, data collection was the responsibility of the local investigators, who were supported by regional research nurses and midwives. Data were collected, coded, and processed with adequate precautions to ensure patient confidentiality.
Postpartum neonatal and maternal outcome measures were recorded, including maternal and neonatal length of stay in hospital. The placenta was sent for histological examination to determine the presence or absence of chorioamnionitis, and funisitis in particular. Serious adverse events were reported to the Adverse Events Committee of the study. No interim analysis was planned, as both treatment options were common practice.
Outcome Measures
Primary outcome. Neonatal sepsis was defined as follows: (1) blood culture taken at birth found positive for bacteria (excluding
Staphylococcus epidermidis) or (2) two or more symptoms of infection (apnea, temperature instability, lethargy, feeding intolerance, respiratory distress, hemodynamic instability) within 72 h after birth, plus one of the following: (a) positive blood culture (culture-proven sepsis); (b) C-reactive protein .20 mmol/l (suspicion of sepsis); (c) positive surface cultures of a known virulent pathogen (suspicion of sepsis).
When a local investigator classified a case as sepsis, or when criteria for sepsis were entered in the database, the case was judged by an independent panel of pediatricians (A. L. M. M. and R. M.)
who, unaware of the allocation of randomization, adjudicated between neonatal sepsis (proven or suspected sepsis) or no sepsis [13]. Secondary outcomes. Secondary neonatal outcome mea-sures were respiratory distress syndrome (RDS), wet lung, meconium aspiration syndrome, pneumothorax/pneumome-diastinum, asphyxia, late onset neonatal sepsis, hypoglycemia, necrotizing enterocolitis, hyperbilirubinemia, intraventricular hemorrhage, periventricular leucomalacia, convulsions, other neurological abnormalities, other complications, intrapartum death, total length of hospital stay and admission, and length of stay on neonatal intensive care unit (NICU).
Maternal outcome measures were antepartum hemorrhage, uterine rupture, umbilical cord prolapse, signs of chorioamnionitis (defined as fever before or during labor as a temperature greater than 37.5uC on two occasion more than 1 h apart before or during labor, or a temperature greater than 38.0uC on one occasion with uterine tenderness, leukocytosis, maternal or fetal tachycardia, or a foul-smelling vaginal discharge in absence of any other cause of hyperpyrexia), maternal sepsis (defined as a temperature greater than 38.5uC and a positive blood culture or circulatory instability requiring intensive care monitoring), thromboembolic
complica-Figure 1. Trial profile.
tions, urinary tract infection treated with antibiotics, endometritis (defined as a temperature greater than 38.0uC on two occasions at least 1 h apart after the first 24 h postpartum with associated uterine tenderness), pneumonia, anaphylactic shock, HELLP syndrome, maternal death, other complications, total length of hospital stay, and admission to the intensive care unit. Finally, we recorded mode of delivery and need for anesthesia [13].
Statistical Analysis
Sample size. The proportion of neonates with sepsis was hypothesized to be 7.5% in the EM group and 2.5% in the IoL group. Because it was considered clinically not plausible that IoL would lead to a higher proportion of neonatal sepsis as compared to EM, we performed a power analysis based on a one-sided test, without continuity correction. This required 260 women per
Table 1.Baseline characteristics.
Characteristica IoL (n= 266) EM (n= 266)
Maternal age (range) [±SD], y 29.5 (18.3–43.3) [64.9] 29.6 (18.1–46.7) [65.6] Number nulliparous (parity range) (percent nulliparous) 147 (0–5) (55%) 152 (0–5) (57%)
Twin pregnancy 2 (0.8%) 4 (1.5%)
Ethnic origin
White 211 (79%) 209 (79%)
Other ethnic origin 35 (13%) 45 (17%)
Unknown 20 (7.5%) 14 (5.3%)
Educationb,c
Primary school (4 to 12 y) 10 (6.6%) 0 (0%)
Secondary school (12–18 y) 11 (7.2%) 15 (9.5%)
Lower professional school 14 (9.2%) 15 (9.5%)
Medium professional school 69 (46%) 80 (51%)
Higher professional school 35 (23%) 34 (22%)
University 12 (7.9%) 14 (8.9%)
Maternal smoking 58 (23%) 63 (25%)
Antenatal administration of corticosteroids 37 (15%) 39 (15%)
Body mass indexc
At booking (range) [6SD], kg/m2 24.8 (17.0–52.2) [65.7] 24.6 (16.4–45.1) [65.1] At study entry (range) [6SD], kg/m2 29.4 (16.3–52.1) [
66.3] 28.7 (17.9–46.3) [65.7] Diagnostic test for rupture of membranesd
Positive history 224 (84%) 235 (88%)
Positive ferning 127 (48%) 133 (50%)
Positive pH test 9 (3.4%) 10 (3.8%)
Positive PAMG-1 test 17 (6.4%) 18 (6.8%)
Other positive ROM test 18 (6?8%) 10 (3?8%)
Decrease amniotic fluid on ultrasound 126 (47%) 133 (50%)
Gestational age at PPROM
,34 wk 36 (14%) 38 (14%)
34+0to 34+6wk 41 (15%) 35 (13%)
35+0to 35+6wk 79 (30%) 84 (32%)
36+0to 36+6wk 110 (41%) 109 (41%)
Gestational age at PPROM, median [IQR], d 249 [243–253] 249 [243–253]
Gestational age at randomization, median [IQR], d 251 [245–255] 251 [245–255] Fetal position at data entry
Cephalic 251 (94%) 245 (92%)
Breech 15 (5.6%) 21 (7.9%)
Maternal temperature at inclusion, mean [±SD],6Cc 36.9 [
60.48] 36.9 [60.44]
Data are presented as number (percent) unless otherwise indicated.
aPercents given are related to available data per characteristic and may differ from total number of patients. bPercents given as part of known educational level.
cOutcome characteristic with more than 5% missing data. Education: data available for 310 women (58%); body mass index at booking: data available for 453 women (85%); body mass index at start study available for 266 women (50%); maternal temperature at inclusion: data available for 504 women (95%).
dSum of tests exceeds 100% because more than one test could be applied on the same patient.
treatment arm to statistically demonstrate a 66% risk reduction with 80% power and a 5% type one error probability.
Data analysis. Data were analyzed on an intention to treat basis. After tabulation, study baseline characteristics were compared. Continuous data were tested with the Student’st test
or the non-parametric Mann-Whitney U test. Relative risks (RRs), mean differences, and 95% confidence intervals (CIs) were calculated for the relevant outcome measures. Categorical data were analyzed with x2 statistics. Since the randomization was stratified for center and parity, we performed a stratified analysis
Table 2.Pregnancy outcomes.
Outcomea IoL (n= 266/268)b EM (n= 266/270)c
RR or Mean Difference (95% CI;p-Value)
Absolute Risk Reduction (95% CI)
Onset of labor
Spontaneous 38 (14%) 161 (61%) 0.24 (0.17 to 0.32;,0.0001) 46.3% (39.0% to 53.5%)
Planned cesarean section 5 (1.9%) 14 (5.3%) 0.36 (0.13 to 0.98; 0.036) 3.3% (0.24% to 6.5%)
Induction 223 (84%) 91 (34%) 2.45 (2.06 to 2.92;,0.0001) 249.6% (242.4% to
256.8%)
$37 wk gestational age 0 (0%) 70 (77%) NA NA
Gestational age at birth, mean [±SD] (median) [IQR], d
250.9 [66.6] (252) [246–256]
254.3 [65.8] (256) [251–259]
23.34 (24.39 to22.29;
,0.0001)d NA
Gestational age at birth
34+0to 34+6wk 49 (18%) 22 (8.1%) 2.24 (1.0 to 3.60; 0.0005)
210.1% (24.47% to
215.8%)
35+0to 35+6wk 79 (30%) 49 (18%) 1.62 (1.19 to 2.22; 0.002)
211.3% (24.19% to
218.5%)
36+0to 36+6wk 124 (46%) 110 (41%) 1.14 (0.94 to 1.38; 0.196)
25.53% (213.9% to 2.84%)
37+0to 37+6wk 14 (5.2%) 89 (33%) 0.16 (0.09 to 0.27;
,0.0001) 27.7% (21.5% to 34.0%)
.38 wk 2 (0.7%)e 0 (0%) 0.155
20.75% (21.77% to 0.28%)
Interval between randomization and birth, mean [±SD] (median) [IQR], h
38.4 [679.7] (26) [14–38]
117 [6135] (65) [26–141]
278.5 (297.3 to259.7;
,0.0001)d
NA
Interval between rupture of membranes and birth, mean [±SD] (median) [IQR], h
103 [6140] (62) [47–98]
202 [6234] (110) [64–234]
298.3 (2131 to265.2;
,0.0001)d
NA
Mode of delivery
Vaginal, spontaneous 213 (80%) 209 (77%) 1.03 (0.94 to 1.12; 0.559) 22.07% (29.02% to 4.88%)
Vaginal, assisted 19 (7.1%)f 24 (8.9%)g 0.80 (0.45 to 1.42; 0.442) 1.80% (
22.78% to 6.38%)
Cesarean section 36 (13%) 37 (14%) 0.98 (0.64 to 1.50; 0.927) 0.27% (25.52% to
6.06%)
Any instrumental delivery 55 (21%) 61 (23%) 0.91 (0.66 to 1.26; 0.559) 2.07% (24.88% to 9.02%)
Antibiotics
During admission 92 (35%) 92 (35%) 1.00 (0.79 to 1.26;.0.999) 0.0% (28.08% to 8.08%)
During labor 84 (32%) 73 (28%) 1.14 (0.88 to 1.48; 0.336) 23.85% (211.7% to
3.98%)
During admission or labor 112 (42%) 108 (41%) 1.04 (0.85 to 1.27; 0.725) 21.50% (29.87% to 6.86%)
Epidural and/or spinal analgesia 71 (27%) 43 (16%) 1.65 (1.18 to 2.32; 0.003) 210.5% (217.4% to
23.61%) Hemorrhage, mean (range) [±SD], ml 420 (50–5,000) [6471] 437 (50–4,000) [6491] 217.8 (2101 to 65.1; 0.674) NA Total maternal admission, mean [±SD]
(median) [IQR], d
9.3 [66.2] (8) [6–12] 11.3 [68.3] (9) [6–14] 21.94 (23.21 to20.68; 0.003) NA
Data are presented as number (percent) unless otherwise indicated.
aPercents, RRs, 95% CIs, andp-values given are related to available data per characteristic and may differ from the total number of patients. bThe number of women in the IoL group was 266; the number of newborns in the IoL group was 268.
cThe number of women in the EM group was 266; the number of newborns in the EM group was 270. dMean difference with 95% CI.
eAfter randomization, the diagnosis rupture of membranes was reconsidered for these two women, and they were managed as having intact membranes. fIncluding one forceps extraction.
gIncluding two forceps extractions.
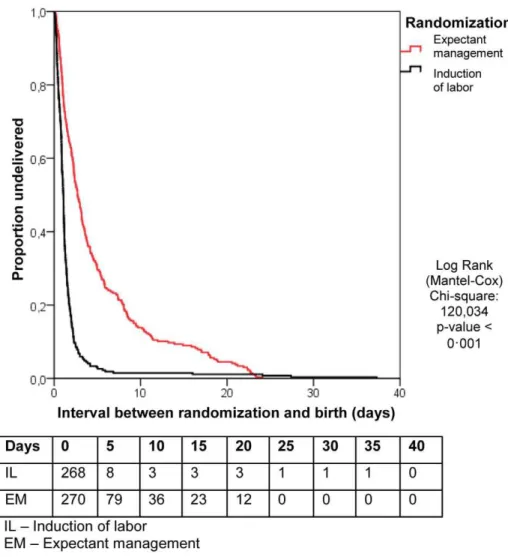
using a Cochran-Mantel-Haenszel correction. The primary outcome of neonatal sepsis is presented as RR after applying the Cochran-Mantel-Haenszel correction. Kaplan-Meier curves were constructed to analyze time from randomization to delivery in both study arms. These curves were compared using the log rank test.p-Values below 0.05 were considered to indicate statistical significance. Statistical analyses were performed using SPSS Statistics (version 17.0).
Meta-Analysis
We updated a recent Cochrane review [7] on sepsis, RDS, and cesarean section rate. To do so, we performed an additional search in MEDLINE and CENTRAL (from 1 October 2009 until 30 April 2011), using the same strategy as described by Buchanan et al. in order to find additional papers that were not in the systematic review [7]. Two authors (D. P. v. d. H. and B. W. J. M.) identified papers for relevance and quality, and extracted the data. We calculated risk ratios, with 95% CIs for all outcomes. Buchanan et al. subdivided their analysis between overall sepsis (defined or undefined by the authors) and culture-proven sepsis [7]. They also made a comparison between suspicion of neonatal sepsis and management of labor. In this comparison they included one study [15]. Because of the broad definition given by the authors of this study for suspicion of sepsis (‘‘clinical findings suggestive for neonatal sepsis’’), we considered our definition of suspicion of neonatal sepsis not comparable. But we considered
our overall sepsis rate as comparable with the overall sepsis rate, and added the culture-proven sepsis cases in our study to the culture-proven sepsis comparison in the meta-analysis.
Statistical analyses were carried out using RevMan, version 5.1 [16].
Results
From 1 January 2007 until 9 September 2009 a total of 776 women were asked to participate in the trial, of which 536 women (69%) gave informed consent. A total of 268 women were randomized to IoL (IoL group) and 268 to EM (EM group). Figure 1 outlines the study profile. In both arms two patients were excluded because after completion of the trial it became clear that their gestational age was over 36+6wk at the time of inclusion.
Baseline characteristics were comparable between the two groups (Table 1). Median gestational age at randomization was 251 d (35+6wk). The percentage of women that had PPROM before
34 wk of gestation was 14% in both groups.
Table 2 shows the data on pregnancy outcome and mode of delivery. In the EM group, labor was induced in 94 women (34%), in 70 (77%) of these cases because the gestational age of 37 wk was reached. In 24 women induction was prior to 37 wk, in four cases (4.4%), this was for fetal distress, in four (4.4%) for meconium-stained amniotic fluid, in six (6.6%) for signs of infections, in three
(3.3%) for maternal hypertensive disorders, and in two (2.2%) for other maternal complications. In the remaining two patients (2.2%), no reason for induction was recorded. Figure 2 shows the Kaplan-Meier curve for the interval between randomization and delivery in both groups.
Of the 266 women allocated to the IoL group, 38 (14%) went into labor spontaneously (i.e., after randomization but before it
was possible to start induction), five (2%) had a planned cesarean section, and in the remaining 223 (84%) women, labor was induced.
Women allocated to IoL obtained epidural or spinal analgesia more often than those in the EM group, 71 (27%) versus 43 (16%), respectively (RR 1.7; 95% CI 1.2 to 2.3). There was no difference in antibiotic administration during admission or labor between the
Table 3.Neonatal outcomes.
Outcomea IoL (n= 268) EM (n= 270)
RR or Mean Difference (95% CI;p-Value)
Absolute Risk Reduction (95% CI)
Primary outcome
Proven neonatal sepsis 1 (0.4%) 3 (1.1%) 0.34 (0.04 to 3.21; 0.319) 0.74% (20.71% to 2.19%) Suspected neonatal sepsis 6 (2.2%) 8 (2.9%) 0.76 (0.27 to 2.15; 0.598) 0.72% (21.96% to 3.41%) Sepsis overall 7 (2.6%) 11 (4.1%) 0.64 (0.25 to 1.63; 0.346) 1.46% (21.57% to 4.50%) Secondary outcomes
Apgar score at 1 min,7 12 (4.5%) 17 (6.4%) 0.70 (0.34 to 1.44; 0.340) 1.87% (21.97% to 5.71%) Apgar score at 5 min,7 2 (0.7%) 1 (0.4%) 2.02 (0.18 to 22.1; 0.558) 20.38% (21.64% to 0.89%) Neonatal temperature.38.0uCb 16 (11%) 6 (4.1%) 2.74 (1.10 to 6.81; 0.022)
27.06% (213.1% to21.02%) pH umbilical artery,7.1 mmol/lb 9 (4.6%) 5 (2.5%) 1.87 (0.64 to 5.47; 0.249)
22.14% (25.78% to 1.50%) Birth weight, mean [6SD], g 2,660 (6438) 2,723 (6414) 262.7 (2135 to 9.44; 0.088)c NA
Respiratory distress 21 (7.8%) 17 (6.3%) 1.25 (0.67 to 2.31; 0.486) 21.54% (25.57% to 2.79%)
Wet lung 2 (0.7%) 4 (1.5%) 0.50 (0.09 to 2.73; 0.417) 0.74% (21.04% 2.51%)
Asphyxia 0 (0%) 0 (0%) NA NA
Pneumothorax/pneumomediastinum 0 (0%) 1 (0.4%) 0.322 0.38% (20.37% to 1.13%)
Meconium aspiration syndrome 0 (0%) 0 (0%) NA NA
Neonatal meningitis 0 (0%) 1 (0.4%) 0.323 0.38% (20.37% to 1.14%)
Late onset sepsis 0 (0%) 1 (0.4%) 0.323 0.38% (20.37% to 1.13%)
Hypoglycemia 49 (19%) 23 (8.9%) 2.16 (1.36 to 3.43; 0.0008) 210.3% (216.2% to24.33%) Hyperbilirubinemia 96 (38%) 67 (26%) 1.47 (1.13 to 1.90; 0.004) 211.9% (219.9% to23.97%)
Necrotizing enterocolitis 0 (0%) 0 (0%) NA NA
HIE grade 1 or 2 0 (0%) 0 (0%) NA NA
HIE grade 3 or 4 0 (0%) 0 (0%) NA NA
IVH grade 1 or 2b 0 (0%) 1 (0.4%) 0.325 0.39% (
20.37% to 1.15%)
IVH grade 3 or 4b 0 (0%) 1 (0.4%) 0.325 0.39% (
20.37% to 1.15%)
PVL grade 1 or 2 1 (0.4%) 0 (0%) 0.314 20.40% (21.17 to 0.38%)
PVL grade 3 or 4 0 (0%) 0 (0%) NA NA
Convulsions 0 (0%) 1 (0.4%) 0.322 0.38% (20.36% to 1.13%)
Other neurologic disorders 2 (0.8%) 3 (1.2%) 0.68 (0.11 to 4.02; 0.666) 0.37% (21.32% to 2.06%) Other disorders 25 (9.8%) 37 (15%) 0.68 (0.42 to 1.09; 0.104) 4.69% (20.95% to 10.3%)
Intrapartum death 0 (0%) 0 (0%) NA NA
Neonatal death 0 (0%) 0 (0%) NA NA
Hospital admission 251 (94%) 253 (94%) 0.999 (0.96 to 1.05; 0.98) 0.05% (4.1% to 4.2%) Length of hospital stay, mean [6SD]
(median) [IQR], d
8.0 [67.1] (6) [2.5–11] 6.5 [67.9] (4) [2–9] 1.4 (0.11 to 2.74; 0.034)c NA
NICU admission 24 (9.0%) 15 (5.6%) 1.61 (0.86 to 3.00; 0.128) 23.40% (27.78% to 0.98%) Length of NICU stay, mean [6SD]
(median) [IQR], d
4.1 [64.1] (2) [1–6] 8.1 [67.9] (5) [3–12] 23.98 (27.89 to20.08; 0.046)c NA
Data are presented as number (percent) unless otherwise indicated. aPercentages, RRs, 95% CIs, andp-values given according to available data.
bOutcome characteristic with more than 5% missing data. Neonatal temperature data available for 292 infants (54%); pH umbilical artery data available for 397 (74%); intraventricular hemorrhage data available for 508 (94%).
cMean difference with 95% CI.
HIE, hypoxic ischemic encephalopathy; IQR, interquartile range; IVH, intraventricular hemorrhage; NA, not applicable; PVL, periventricular leucomalacia; SD, standard deviation.
two groups. The cesarean section rate was comparable in both groups (36 [13%] cesarean sections in the IoL group versus 37 [14%] in the EM group; RR 0.98; 95% CI 0.64 to 1.5). No serious adverse events were reported during the study period.
Neonatal Sepsis
Neonatal sepsis was seen in seven newborns (2.6%) in the IoL group versus 11 (4.1%) in the EM group (RR 0.64; 95% CI 0.25 to 1.6) (see Table 3). The RR for neonatal sepsis was similar when stratified for center and parity (RR 0.65; 95% CI 0.25 to 1.7).
Other Neonatal Outcomes
Table 3 shows all neonatal outcomes. Neonates born in the IoL group stayed 1.4 d longer in hospital than neonates born after EM and were admitted more often to the NICU. Newborns admitted
to the NICU in the IoL group stayed shorter than those in the EM group.
RDS was seen in 21 (7.8%) newborns in the IoL group versus 17 (6.3%) in the EM group. Hypoglycemia (RR 2.2) and hyperbil-irubinemia (RR 1.5) were seen significantly more often in the IoL group. For other neonatal outcome measures, there were no significant differences between the two groups. Seventy-six newborns (28%) in the IoL group were treated with antibiotics, for an average of 5.0 d, versus 78 (27%) in the EM group, for an average of 5.0 d (Table 4).
Maternal Outcomes
Table 5 shows the maternal outcomes. Clinical chorioamnio-nitis was seen in six women (2.3%) in the IoL group versus 15 (5.6%) women in the EM group (RR 0.40; 95% CI 0.16 to 1.02).
Table 4.Neonatal treatments.
Outcomea IoL (n= 268) EM (n= 270)
RR or Mean Difference (95% CI;p-Value)
Absolute Risk Reduction (95% CI)
Antibiotic treatment, number (percent)
Augmentin 12 (4.5%) 18 (6.7%) 0.67 (0.33 to 1.37; 0.270) 2.19% (21.68% to
6.06%)
Amoxicillin 49 (18%) 55 (20%) 0.90 (0.64 to 1.27; 0.540) 2.09% (24.58% to
8.76%)
Gentamycin 44 (16%) 45 (17%) 0.99 (0.67 to 1.44; 0.938) 0.25% (26.03% to
6.53%)
Cephalosporin 10 (3.7%) 9 (3.3%) 1.12 (0.46 to 2.71; 0.803) 20.40% (23.52% to
2.72%)
Other antibiotics 25 (9.3%) 19 (7.0%) 1.33 (0.75 to 2.35; 0.332) 22.29% (26.92% to
2.34%)
Any antibiotic treatment 76 (28%) 75 (28%) 1.02 (0.78 to 1.34; 0.881) 20.58% (28.17% to 7.01%)
Antibiotic treatment length, mean (±SD)b
Augmentin 4.5 (62.3) 5.2 (62.5) 20.72 (22.57 to 1.13; 0.430)c NA
Amoxicillin 4.8 (62.8) 5.2 (62.5) 20.46 (21.50 to 0.57; 0.377)c NA
Gentamycin 4.4 (61.9) 3.7 (61.6) 0.68 (20.07 to 1.42; 0.076)c NA
Cephalosporin 4.7 (63.8) 5.4 (62.2) 20.74 (23.83 to 2.34; 0.617)c NA
Other antibiotics 4.8 (62.7) 5.1 (62.7) 20.25 (21.97 to 1.46; 0.768)c NA
Any antibiotic treatment 5.1 (62.8) 5.1 (62.5) 20.01 (20.86 to 0.84; 0.974)c NA Other neonatal treatment, number (percent)
Positive pressure ventilation with endotracheal tube 2 (0.7%) 4 (1.5%) 0.50 (0.09 to 2.73; 0.417) 0.73% (21.04% to 2.51%)
Positive pressure ventilation 11 (4.1%) 9 (3.3%) 1.23 (0.52 to 2.92; 0.636) 20.77% (23.97% to 2.43%)
Tube feeding 37 (14%) 33 (12%) 1.13 (0.73 to 1.75; 0.585) 21.58% (27.27% to
4.10%)
Total parenteral feeding 5 (1.9%) 5 (1.9%) 1.007 (0.30 to 3.44; 0.991) 20.01% (22.29% to 2.27%)
Other neonatal treatment length, mean (±SD)d
Positive pressure ventilation with endotracheal tube 2.0 (61.4) 2.5 (61.3) 20.50 (23.68 to 2.68; 0.685)c NA Positive pressure ventilation 3.1 (62.9) 1.8 (60.97) 1.40 (20.77 to 3.58; 0.191)c NA
Tube feeding 8.1 (64.5) 6.0 (64.2) 2.16 (0.07 to 4.25; 0.043)c NA
Total parenteral feeding 5.2 (62.7) 7.2 (69.8) 2.00 (212.5 to 8.51; 0.672)c NA a
Percentages given according to available data.
bMean treatment length calculated for neonates receiving each antibiotic. cMean difference with 95% CI.
dMean treatment length calculated from neonates receiving each treatment. NA, not applicable; SD, standard deviation.
The incidence of histological chorioamnionitis was 43 (22%) versus 62 (32%), respectively (RR 0.69; 95% CI 0.49 to 0.96).
Non-Randomized Women
Table 6 shows the baseline characteristics of the 207 non-randomized women. The non-non-randomized women differed to those randomized in level of education (more educated), smoking (fewer smoked), maternal age (older), and management (preferred EM). Furthermore, they differed in gestational age at PPROM (earlier PPROM). Neonatal sepsis was seen in one of 13 (7.7%) neonates born to mothers who preferred IoL, and in seven of the 198 (3.5%) neonates born to mothers who chose EM.
Meta-Analysis
The electronic search yielded ten new results relevant for meta-analysis. After reviewing these papers, none fulfilled the inclusion criteria. Figure 3 presents the results of the meta-analysis including our own data. In total, 1,230 neonates could be analyzed from
eight studies for neonatal sepsis, 892 neonates (five studies) for culture-proven sepsis, 1,230 neonates (eight studies) for RDS, and 1,222 women (eight studies) for cesarean section rate. None of the risk ratios for these outcomes were statistically different (1.06 [95% CI 0.64–1.76],p= 0.81; 0.94 [95% CI 0.43–2.05],p= 0.87; 1.03 [95% CI 0.80–1.33], p= 0.83; 1.27 [95% CI 0.98 to 1.65],
p= 0.07, respectively).
Discussion
We conducted a large randomized study (the PPROMEXIL trial) to compare IoL and EM in women with PPROM between 34 and 37 wk of gestational age. Because of the conservative treatment policy and conservative preferences amongst patients in The Netherlands, we had an ideal population in which to perform this trial, with extensive data on all eligible patients including non-participants (31%), the vast majority of whom declined participa-tion because they preferred EM.
Table 5.Maternal outcomes.
Outcomea IoL (n= 266) EM (n= 266) RR (95% CI;p-Value) Absolute Risk Reduction (95% CI)
Maternal complications
Antepartum hemorrhage 2 (0.8%) 5 (1.9%) 0.40 (0.08 to 2.04; 0.255) 1.13% (20.81% to 3.06%)
Cord prolapse 1 (0.4%) 0 (0%) 0.319 20.38% (21.11% to 0.36%)
Uterine rupture 1 (0.4%) 0 (0%) 0.319 20.38% (21.11% to 0.36%)
Clinical chorioamnionitis 6 (2.3%) 15 (5.6%) 0.40 (0.16 to 1.02; 0.045) 3.38% (0.09% to 6.68%)
Sepsis 6 (2.3%) 1 (0.4%) 6.00 (0.72 to 49.5; 0.057) 21.88% (23.81% to 0.05%)
Thromboembolic complications 0 (0%) 1 (0.4%) 0.319 0.38% (20.36% to 1.11%)
Urinary tract infections treated with antibiotics
4 (1.5%) 0 (0%) 0.045 21.50% (22.97% to20.04%)
Endometritis 2 (0.8%) 4 (1.5%) 0.50 (0.09 to 2.71; 0.412) 0.75% (21.04% to 2.55%)
Pneumonia 0 (0%) 1 (0.4%) 0.319 0.38% (20.36% to 1.11%)
Anaphylactic shock 0 (0%) 0 (0%) NA NA
HELLP syndrome 0 (0%) 2 (0.8%) 0.157 0.75% (20.29% to 1.79%)
Death 0 (0%) 0 (0%) NA NA
Other complications 11 (4.1%) 9 (3.4%) 1.22 (0.52 to 2.90; 0.649) 20.75% (23.98% to 2.48%) Perineum
No laceration 116 (44%) 114 (43%) 1.02 (0.84 to 1.24; 0.831) 20.92% (29.35% to 7.51%) First degree laceration 49 (19%) 52 (20%) 0.95 (0.67 to 1.34; 0.756) 1.06% (25.62% to 7.73%) Second degree laceration 27 (10%) 35 (13%) 0.77 (0.48 to 1.24; 0.288) 2.97% (22.49% to 8.43%) Third degree laceration 2 (0.8%) 2 (0.8%) 1.004 (0.14 to 7.07; 0.997) 0.003% (21.47% to 1.47%) Fourth degree laceration 2 (0.8%) 4 (1.5%) 0.50 (0.09 to 2.72; 0.414) 0.75% (21.05% to 2.55%) Episiotomy 69 (26%) 59 (22%) 1.17 (0.87 to 1.59; 0.301) 23.86% (211.1% to 3.41%) Delivery of placenta
Spontaneous 211 (79%) 209 (79%) 1.01 (0.92 to 1.10; 0.832) 20.75% (27.68% to 6.18%) Manual placental removal 19 (7.1%) 20 (7.5%) 0.95 (0.52 to 1.74; 0.868) 20.38% (24.05% to 4.81%) During cesarean section 36 (14%) 37 (14%) 0.97 (0.64 to 1.49; 0.900) 0.38 (25.47% to 6.22%) Chorioamnionitis
Histological chorioamnionitisb 43 (22%) 62 (32%) 0.69 (0.49 to 0.96; 0.026) 9.86% (1.22% to 18.5%) Histological funisitisb 21 (11%) 34 (18%) 0.61 (0.36 to 1.004; 0.048) 6.99% (0.07% to 13.9%) Other complications 16 (6.0%) 15 (5.6%) 1.07 (0.54 to 2.11; 0.853) 20.38% (24.36% to 3.61%) Data are presented as number (percent).
aPercents, RRs, 95% CIs, andp-values given are related to available data per characteristic and may differ from the total number of patients.
bOutcome characteristic with more than 5% missing data. Histological chorioamnionitis data available for 396 women (74%); histological funisitis data available for 388 women (73%).
We found that in pregnancies complicated by PPROM between 34 and 37 wk of gestation, IoL does not substantially reduce the incidence of neonatal sepsis compared to EM. The number of neonates with respiratory distress was comparable in both arms, and IoL did not increase the risk of a cesarean section, findings that were confirmed in meta-analysis. However, in our study IoL increased the risk of hypoglycemia and hyperbilirubinemia, as well as the use of epidural or spinal analgesia during labor.
Our findings are in line with the results of the TERMPROM trial, which compared IoL with EM in 5,041 women with prelabor rupture of membranes at term [17]. The TERMPROM trial showed that IoL did not reduce the risk of neonatal sepsis as compared to EM (2.5% versus 2.8%) [17].
In contrast to earlier studies [15,17–19], our pragmatic protocol did not include routine cultures from all neonates to diagnose sepsis. Because of the lack of consensus amongst Dutch neonatologists on whether to take blood samples routinely after prolonged premature rupture of membranes, neonatal blood samples and liquor cultures were taken only on clinical indication.
All cases with any possible sign of neonatal sepsis were adjudicated by a panel of neonatologists. In consensus they decided whether or not a newborn had suffered neonatal sepsis (suspected or proven). Despite of the lack of blood culture from all neonates in the trial, we believe that no cases of neonatal sepsis were missed and that the incidence of neonatal sepsis was not overestimated.
IoL reduced the risk of chorioamnionitis. Several studies have demonstrated a relationship between chorioamnionitis and adverse neonatal outcome [20–23]. In a large study of very premature neonates (,28 wk; the ELGAN study) [20], a relationship between cerebral palsy and/or white matter damage and positive bacteriological cultures from the placenta was demonstrated. Other studies have also described a relationship between chorioamnionitis and increased risk for sepsis, respiratory distress, pneumonia, and even neonatal death [22,23]. We doubt, however, that these findings can be extrapolated to our population. The incidence of cerebral palsy is significantly lower in the near-term-birth population, and reported incidences of adverse neonatal outcome in a near-term and term newborns are
Table 6.Baseline characteristics for randomized versus non-randomized participants.
Characteristica Randomized (n= 532) Non-Randomized (n= 207) p-Value
Maternal age (range) [±SD], y 29.6 (18.0–46.7) [65.3] 32.3 (19.5–45.5) [65.0] ,0.0001 Number nulliparous (parity range) (percent nulliparous) 299 (0–5) (56%) 121 (0–3) (58%) 0.580
Twin pregnancy 6 (1.1%) 4 (1.9%) 0.395
Ethnic origin
White 420 (79%) 149 (72%)
Other ethnic origin 78 (15%) 37 (18%) 0.188
Unknown 34 (6.4%) 21 (10%) NA
Educationb,c
Primary school (4 to 12 y) 10 (3.2%) 0 (0%)
Secondary school (12–18 y)b 26 (8.4%) 10(8.7%)
Lower professional school 29 (9.4%) 5 (4?4%)
Medium professional school 149 (48%) 42 (37%)
Higher professional school 70 (23%) 37 (32%)
University 26 (8.4%) 21 (18%) 0.002
Maternal smoking 121 (24%) 21 (11%) 0.001
Body mass indexc
At booking (range) [6SD], kg/m2 24.7 (16.4–52.2) [65.4] 24.4 (17.3–41.9) [64.5] 0.605 At study entry (range) [6SD], kg/m2 29.1 (16.3–52.1) [66.0] 28.0 (17.3–43.8) [64.7] 0?139 Gestational age at PPROM
,34 wk 74 (14%) 60 (29%)
34+0to 34+6wk 76 (14%) 38 (18%)
35+0to 35+6wk 163 (31%) 64 (31%)
36+0to 36+6wk 219 (41%) 44 (21%)
,0.0001
Gestational age at PPROM, median [IQR], d 249 [243–253] 244 [234–250] ,0.0001
Maternal temperature at inclusion, mean [±SD],6Cc 36.9 [
60.46] 36.8 [60.46] 0.214
Treatment
IoL 266 (50%) 13 (6.3%)
EM 266 (50%) 194 (94%) ,0.0001
Data are presented as number (percent) unless otherwise indicated.
aPercents given are related to available data per characteristic and may differ from the total number of patients. bPercents given as part of known educational level.
cOutcome characteristic with more than 5% missing data. Education: data available for 425 women (58%); body mass index at booking: data available for 616 women (83%); body mass index at start study available for 346 women (47%); maternal temperature at inclusion: data available for 689 women (93%).
Figure 3. Meta-analysis.Risk ratio according to Mantel-Haenszel (M–H) with fixed effects and 95% CIs for neonatal sepsis, culture-proven neonatal sepsis, RDS, and cesarean section rates.
low (maximum reported incidences of 1.9% in the chorioamni-onitis group) [23].
In line with the TERMPROM trial, the number of cesarean sections in our study was comparable in the IoL and EM groups [17]. We could not confirm the trend for increased risk on cesarean section in the EM group that was reported in the previous systematic review [7].
The risks of hypoglycemia and hyperbilirubinemia were decreased in children of women treated expectantly. These findings have, to our knowledge, not previously been reported for a prospective study. In a recent retrospective study in three tertiary hospitals in France, a similar incidence of hyperbilirubinemia (37% for IoL versus 33% for EM) and a slightly lower incidence of hypoglycemia (12% for IoL versus 6% for EM) was found, but due to a lack of power, differences were not statistically significant in the French study [24].
We doubt whether prolongation of pregnancy, which was on average 3.3 d longer in the EM group in our trial, will have solely contributed to the decreased risk of hypoglycemia and hyperbil-irubinemia. Maybe spontaneous onset of labor enhances the speed of physiological maturing by means of a still unknown adapta-tional process, as is known to happen in the lungs, reducing the incidence of RDS in spontaneous delivery compared to elective cesarean section [25].
The clinical importance of these findings for later (cognitive and motor) development in children is not clear at present for our study group, although it is known that following symptomatic neonatal hypoglycemia, more than 50% of infants demonstrate cognitive and motor impairments at the age of 18 mo [26]. In low-birth-weight infants, even an asymptomatic moderate hypoglyce-mia may lead to cognitive and motor impairments at the age of 18 mo [27]. Hyperbilirubinemia is potentially neurotoxic, espe-cially in infants born preterm [28]. When treated appropriately, however, bilirubin levels under 30 mg/dl are not associated with adverse neurodevelopmental outcome [29].
MacKay et al. [30] reported on the increased need for special education in preterm-delivered infants. In a retrospective cohort study of 407,503 schoolchildren, they showed that gestational age at delivery had a strong, dose-dependent relationship with special educational need. Until further evidence becomes available, the decreased risk of special educational need with advancing gestational age should be taken into account when considering how best to manage PPROM.
Within the Dutch Consortium for Women’s Health and Repro-ductivity Studies (http://www.studies-obsgyn.nl), the PPRO-MEXIL trial is the largest trial so far with regard to the number of participating hospitals (60 out of 98 eligible hospitals, 61%). The 207 non-randomized women in our study who allowed data collection differed from the randomized women. Similar to two other Dutch consortium trials (HYPITAT and DIGITAT) [31,32], the women who agreed to be randomized differed in level of education, smoking habits, maternal age, and preferred management from those who did not agree to be randomized. The non-randomized subgroup of women who preferred IoL was too small to draw any conclusions from. In the EM subgroup, no differences were seen in the primary outcome or the secondary neonatal and maternal outcomes. Even though some women eligible to participate in the trial did not, we believe that we did not miss a significant group at a higher (or lower) risk for neonatal sepsis who were treated expectantly. Despite some differences in baseline characteristics, we assume that the results of our study can be generalized to at least the Dutch/Western European popula-tion. Because of wide differences in general health care and availability of antibiotics, it is likely that these results cannot be generalized to low-income countries.
The main limitation of our study is that it proved to be underpowered. We hypothesized a decrease in neonatal sepsis rate of 7.5% to 2.5%, but found a difference of only 1.5% (2.6% in the IoL group versus 4.1% in the EM group). The liberal use of antibiotic therapy before or during labor (41% of all participating women received antibiotics) might have contributed to a lower incidence compared to the other trials in which antibiotics were not administered prophylactically [15,18,33–37]. These previous studies showed high rates of neonatal sepsis with EM. Similarly, improved health care may have contributed to a reduction of the incidence of neonatal sepsis in women with PPROM over the last decades.
In our study the observed difference in sepsis rates between the EM and IoL groups did not reach statistical significance. Although this study is one of the largest published so far, our sample size was insufficient to demonstrate small differences. In retrospect, anticipating a risk reduction of 66% (a difference in neonatal sepsis rate of 7.5% versus 2.5%) might have been too optimistic. However, several previous studies [18,33,35] showed neonatal sepsis incidences up to 9.5% with EM, and we did observe an incidence near 2.5% in the IoL group. Although optimistic, we feel that our hypothesized risk reduction was not unrealistic. Furthermore, we used a one-sided test for the power calculation. We considered it not plausible that IoL in women with PPROM near term would increase the proportion of cases of neonatal sepsis. In retrospect, considering the results of the meta-analysis, one might question this choice of a one-sided test, as several studies in the meta-analysis show an increased risk for sepsis in the IoL group. However, the analysis was executed exactly as planned in advance. Two-sided testing would have required a sample size that would not have been feasible in our setting, in view of the limitations set by our funding body.
A second potential limitation is that EM prolonged gestation by just 4 d. This rather small difference might be partly due to the fact that the median gestational age at rupture of membranes was 35+4
wk and median gestational age at randomization was 35+6
wk. The overrepresentation of women beyond the 35th com-pleted week of gestation was caused by the fact that women in their 35th week of gestation more often refused to participate (mean gestational age at PPROM in the non-randomized group was 34+6
wk), and before our study an expectant policy was the standard. Furthermore, hesitation of clinicians to induce labor before 35 completed weeks of gestation, which prior to the start of the PPROMEXIL trial was not recommended in the Dutch guidelines, might also have influenced this outcome.
A third limitation of this study is that we reported many secondary, mostly neonatal, outcomes. Although this is not uncommon in studies in maternal–fetal medicine, it is possible that a significant difference can be found by chance. If one applies a Bonferroni correction to the p-value, the adjusted threshold is
p,0.001. By applying this threshold, the incidence of hypoglyce-mia (p= 0.0008) remains the only statistically significant difference between the groups.
already planned such an analysis with the PPROMT study group, and will contact researchers from other published trials to collaborate in an individual patient data meta-analysis.
We conclude that in pregnancies complicated by PPROM between 34 and 37 wk of gestation the incidence of neonatal sepsis is low. Neither our trial nor the updated meta-analysis shows that IoL substantially improves pregnancy outcomes compared with EM.
Supporting Information
Text S1 Study protocol. Previously published in [13]. (PDF)
Text S2 CONSORT statement. (DOC)
Acknowledgments
The PPROMEXIL collaborators: F. Roumen (Atrium Medical Center, Heerlen), J. E. van de Riet (Antonius Hospital, Sneek), R. Kok (Bernhoven, Veghel/Oss), M. J. C. P. Hanssen (Bethesda Hospital, Hoogeveen), B. Dijkman (BovenIJ Hospital, Amsterdam), R. Stigter (Deventer Hospital, Deventer), N. W. E. Schuitemaker (Diakonessen Hospital, Utrecht), F. Delemarre (Elkerliek Hospital, Helmond), G. Kleiverda (Flevo Hospital, Almere), J. Friederich (Gemini Hospital, Den Helder), A. J. M. Huisjes (Gelre Hospital, Apeldoorn), C. A. van Meir (Groene Hart Hospital, Gouda), M. van Huizen (Haga/Leyenburg Hospital, The Hague), J. W. de Leeuw (Ikazia Hospital, Rotterdam), R. J. P. Rijnders (Jeroen Bosch Hospital, Den Bosch), M. Heres (Lucas Andreas Hospital, Amsterdam), R. Aardenburg (Orbis Medical Center, Sittard), A. C. de Wit (Maas Hospital, Boxmeer), A. J. van Loon (Martini Hospital, Groningen), P. van der Salm (Meander Medical Center,
Amersfoort), C. de Groot (Medical Center Haaglanden, The Hague), D. Perquin (Medical Center Leeuwarden, Leeuwarden), J. T. J. Brons (Medical Spectrum Twente, Enschede), E. van Beek (Mesos Medical Center, Oudenrijn), J. Wilpshaar (Nij Smellinghe, Drachten), E. S. A. van den Akker (Onze Lieve Vrouwe Gasthuis, Amsterdam), H. A. Bremer (Reinier de Graaf Gasthuis, Delft), K. de Boer (Rijnstate, Arnhem), J. M. Burggraaff (Scheper Hospital, Emmen), I. M. de Graaf (Spaarne Hospital, Hoofddorp), C. M. van Oirschot (Sint Elisabeth Hospital, Tilburg), N. van Gemund (Sint Franciscus Gasthuis, Rotterdam), I. M. A. van Dooren (Sint Jans Gasthuis, Weert), R. E. Bernardus (Tergooi Hospitals, Blaricum/ Hilversum), A. Drogtrop (TweeSteden Hospital, Tilburg), M. Buimer (Westfries Gasthuis, Hoorn), A. Koops (Wilhelmina Hospital, Assen), J. P. R. Doornbos (Zaans Medical Center, Zaandam), A. van Ginkel (Hospital Zevenaar, Zevenaar).
We thank the research staff of our consortium and the residents, midwives, nurses, and gynecologists of the participating centers for their help with recruitment and data collection.
We would like to thank Maya Kruijt and Zelda van Dijk for their efforts in obtaining local ethical approval and their administrative support.
Author Contributions
Conceived and designed the experiments: BM CW. Analyzed the data: DH SV BO BM. Wrote the first draft of the manuscript: DH BO BM. Contributed to the writing of the manuscript: DH JN BO JvB AM WvW BM CW. ICMJE criteria for authorship read and met: DH SV JN JvB BO AM RM MG MvP GM KB WvW MS MH PP MP JM SK AK MK MW MJW HW BA BM CW. Agree with manuscript results and conclusions: DH SV JN JvB BO AM RM MG MvP GM KB WvW MS MH PP MP JM SK AK MK MW MJW HW BA BM CW. Enrolled patients: DH JN JvB MG MvP GM KB WvW MS MH PP MP JM SK AK MK MW MJW HW BA BM CW. Scored and discussed neonatal outcome on neonatal sepsis: AM RM. Supported and helped with the database: SV. Obtained funding for the trial: BM CW.
References
1. Cox SM, Williams ML, Leveno KJ (1988) The natural history of preterm ruptured membranes: what to expect of expectant management. Obstet Gynecol 71: 558–562.
2. Gibbs RS, Blanco JD (1982) Premature rupture of the membranes. Obstet Gynecol 60: 671–679.
3. Mercer BM, Goldenberg RL, Meis PJ, Moawad AH, Shellhaas C, et al. (2000) The Preterm Prediction Study: prediction of preterm premature rupture of membranes through clinical findings and ancillary testing. The National Institute of Child Health and Human Development Maternal-Fetal Medicine Units Network. Am J Obstet Gynecol 183: 738–745.
4. Furman B, Shoham-Vardi I, Bashiri A, Erez O, Mazor M (2000) Clinical significance and outcome of preterm prelabor rupture of membranes: population-based study. Eur J Obstet Gynecol Reprod Biol 92: 209–216. 5. Goldenberg RL, Nelson KG, Davis RO, Koski J (1984) Delay in delivery:
influence of gestational age and the duration of delay on perinatal outcome. Obstet Gynecol 64: 480–484.
6. Mercer BM (2003) Preterm premature rupture of the membranes. Obstet Gynecol 101: 178–193.
7. Buchanan SL, Crowther CA, Levett KM, Middleton P, Morris J (2010) Planned early birth versus expectant management for women with preterm prelabour rupture of membranes prior to 37 weeks’ gestation for improving pregnancy outcome. Cochrane Database Syst Rev 2010: CD004735.
8. ACOG Committee on Practice Bulletins-Obstetrics (2007) ACOG Practice Bulletin No. 80: premature rupture of membranes. Clinical management guidelines for obstetrician-gynecologists. Obstet Gynecol 109: 1007–1019. 9. Royal College of Obstetricians and Gynaecologists (2006) Preterm prelabour
rupture of membranes. Guideline No. 44. Available: http://www.rcog.org.uk/ files/rcog-corp/uploaded-files/GT44PretermPrelabourRupture2006.pdf. Ac-cessed 1 September 2011.
10. Nederlandse Vereniging voor Obstetrie en Gynaecologie (2002) [Rupture of membranes before onset of labor.] Available: http://nvog-documenten.nl/ index.php?pagina=/richtlijn/item/pagina.php&richtlijn_id= 564. Accessed 1 September 2011.
11. Buchanan S, Crowther C, Morris J (2004) Preterm prelabour rupture of the membranes: a survey of current practice. Aust N Z J Obstet Gynaecol 44: 400–403.
12. Smith G, Rafuse C, Anand N, Brennan B, Connors G, et al. (2005) Prevalence, management, and outcomes of preterm prelabour rupture of the membranes of women in Canada. J Obstet Gynaecol Can 27: 547–553.
13. van der Ham DP, Nijhuis JG, Mol BW, van Beek JJ, Opmeer BC, et al. (2007) Induction of labour versus expectant management in women with preterm
prelabour rupture of membranes between 34 and 37 weeks (the PPROMEXIL-trial). BMC Pregnancy Childbirth 7: 11.
14. Nederlandse Vereniging voor Obstetrie en Gynaecologie (2006) [Induction of labor.] Available: http://nvog-documenten.nl/index.php?pagina = /richtlijn/ item/pagina.php&richtlijn_id=689. Accessed 1 September 2011.
15. Mercer BM, Crocker LG, Boe NM, Sibai BM (1993) Induction versus expectant management in premature rupture of the membranes with mature amniotic fluid at 32 to 36 weeks: a randomized trial. Am J Obstet Gynecol 169: 775–782. 16. The Nordic Cochrane Centre (2011) RevMan, version 5.1 [computer program].
Copenhagen: The Cochrane Collaboration.
17. Hannah ME, Ohlsson A, Farine D, Hewson SA, Hodnett ED, et al. (1996) Induction of labor compared with expectant management for prelabor rupture of the membranes at term. TERMPROM Study Group. N Engl J Med 334: 1005–1010.
18. Naef RW, 3rd, Allbert JR, Ross EL, Weber BM, Martin RW, et al. (1998) Premature rupture of membranes at 34 to 37 weeks’ gestation: aggressive versus conservative management. Am J Obstet Gynecol 178: 126–130.
19. Neerhof MG, Cravello C, Haney EI, Silver RK (1999) Timing of labor induction after premature rupture of membranes between 32 and 36 weeks’ gestation. Am J Obstet Gynecol 180: 349–352.
20. Leviton A, Allred EN, Kuban KC, Hecht JL, Onderdonk AB, et al. (2010) Microbiologic and histologic characteristics of the extremely preterm infant’s placenta predict white matter damage and later cerebral palsy. The ELGAN study. Pediatr Res 67: 95–101.
21. O’Shea TM, Allred EN, Dammann O, Hirtz D, Kuban KC, et al. (2009) The ELGAN study of the brain and related disorders in extremely low gestational age newborns. Early Hum Dev 85: 719–725.
22. Lau J, Magee F, Qiu Z, Hoube J, Von Dadelszen P, et al. (2005) Chorioamnionitis with a fetal inflammatory response is associated with higher neonatal mortality, morbidity, and resource use than chorioamnionitis displaying a maternal inflammatory response only. Am J Obstet Gynecol 193: 708–713.
23. Alexander JM, McIntire DM, Leveno KJ (1999) Chorioamnionitis and the prognosis for term infants. Obstet Gynecol 94: 274–278.
24. Kayem G, Bernier-Dupreelle A, Goffinet F, Cabrol D, Haddad B (2010) Active versus expectant management for preterm prelabor rupture of membranes at 34–36 weeks of completed gestation: comparison of maternal and neonatal outcomes. Acta Obstet Gynecol Scand 89: 776–781.
26. Burns CM, Rutherford MA, Boardman JP, Cowan FM (2008) Patterns of cerebral injury and neurodevelopmental outcomes after symptomatic neonatal hypoglycemia. Pediatrics 122: 65–74.
27. Lucas A, Morley R, Cole TJ (1988) Adverse neurodevelopmental outcome of moderate neonatal hypoglycaemia. BMJ 297: 1304–1308.
28. Shapiro SM (2003) Bilirubin toxicity in the developing nervous system. Pediatr Neurol 29: 410–421.
29. Newman TB, Liljestrand P, Jeremy RJ, Ferriero DM, Wu YW, et al. (2006) Outcomes among newborns with total serum bilirubin levels of 25 mg per deciliter or more. N Engl J Med 354: 1889–1900.
30. MacKay DF, Smith GC, Dobbie R, Pell JP (2010) Gestational age at delivery and special educational need: retrospective cohort study of 407,503 schoolchil-dren. PLoS Med 7: e1000289. doi:10.1371/journal.pmed.1000289. 31. Boers KE, Vijgen SM, Bijlenga D, van der Post JA, Bekedam DJ, et al. (2010)
Induction versus expectant monitoring for intrauterine growth restriction at term: randomised equivalence trial (DIGITAT). BMJ 341: c7087.
32. Koopmans CM, Bijlenga D, Groen H, Vijgen SM, Aarnoudse JG, et al. (2009) Induction of labour versus expectant monitoring for gestational hypertension or mild pre-eclampsia after 36 weeks’ gestation (HYPITAT): a multicentre, open-label randomised controlled trial. Lancet 374: 979–988.
33. Cox SM, Leveno KJ (1995) Intentional delivery versus expectant management with preterm ruptured membranes at 30–34 weeks’ gestation. Obstet Gynecol 86: 875–879.
34. Spinnato JA, Shaver DC, Bray EM, Lipshitz J (1987) Preterm premature rupture of the membranes with fetal pulmonary maturity present: a prospective study. Obstet Gynecol 69: 196–201.
35. Iams JD, Talbert ML, Barrows H, Sachs L (1985) Management of preterm prematurely ruptured membranes: a prospective randomized comparison of observation versus use of steroids and timed delivery. Am J Obstet Gynecol 151: 32–38.
36. Garite TJ, Freeman RK, Linzey EM, Braly PS, Dorchester WL (1981) Prospective randomized study of corticosteroids in the management of premature rupture of the membranes and the premature gestation. Am J Obstet Gynecol 141: 508–515.
37. Nelson LH, Meis PJ, Hatjis CG, Ernest JM, Dillard R, et al. (1985) Premature rupture of membranes: a prospective, randomized evaluation of steroids, latent phase, and expectant management. Obstet Gynecol 66: 55–58.
Editors’ Summary
Background.Most pregnancies last around 40 weeks, but in industrialized countries, 5%–10% of babies are born before 37 weeks of gestation (gestation is the period during which a baby develops in its mother’s womb). Premature birth is a major cause of infant death in many developed countries, and preterm babies can also have short- and/or long-term health problems such as breathing problems, increased susceptibility to life-threatening infections, and learning and developmental disabilities. There are many reasons why some babies are born prematurely, but preterm prelabor rupture of the membranes (PPROM) accounts for 30%–40% of preterm deliveries. Inside the womb, the baby is held in a fluid-filled bag called the amniotic sac. The amniotic fluid cushions the baby, helps some of its organs develop, and protects both mother and baby from infection. The membranes that form the sac usually break at the start of labor (‘‘water breaking’’), but in PPROM, the membranes break before the baby is fully grown. PPROM increases the mother’s risk of a womb infection called chorioamnionitis and the baby’s risk of neonatal sepsis (blood infection), and can trigger early labor.
Why Was This Study Done? There is currently no consensus on how to manage women whose membranes rupture between 34 and 37 weeks’ gestation. Some guidelines recommend immediate induction of labor if PPROM occurs at or beyond 34 weeks’ gestation. Others recommend that labor not be induced unless the mother develops signs of infection such as a high temperature or has not delivered her baby spontaneously by 37 weeks’ gestation (expectant management). Before 34 weeks’ gestation, expectant management is generally recom-mended. In this randomized controlled trial, the re-searchers compare the effects of induction of labor and of expectant management on the rate of neonatal sepsis (the proportion of babies that develop neonatal sepsis; the trial’s primary outcome) and on secondary outcomes such as the rates of neonatal respiratory distress syndrome (RDS), cesarean section (surgical delivery), and chorioamnionitis in women with PPROM between 34 and 37 weeks’ gestation. The researchers also undertake a meta-analysis of published trials on the effect of both interventions on pregnancy outcomes. A randomized controlled trial compares the effects of different interventions in groups of individuals chosen through the play of chance; meta-analysis is a statistical approach that combines the results of several trials.
What Did the Researchers Do and Find?In the PPROM Expectant Management versus Induction of Labor (PRROMEXIL) trial, 532 non-laboring women with PPROM between 34 and 37 weeks’ gestation were randomly assigned to either immediate induction of labor or expectant management. Neonatal sepsis occurred in seven babies born to women in the induction of labor group and in 11 babies born to women in the expectant management
group. This difference was not statistically significant. That is, it could have happened by chance. Similarly, although more babies born to women in the induction of labor group than in the expectant management group developed RDS (21 and 17 babies, respectively), this difference was not significant. Cesarean section rates were similar in both intervention groups, but the risk of chorioamnionitis was slightly reduced in the induction of labor group compared to the expectant management group. Finally, the researchers’ meta-analysis (which included these new results) found no significant differences in the risk of neonatal sepsis, RDS, or cesarean section associated with the two interventions.
What Do These Findings Mean? These findings show that, compared to expectant management, induction of labor did not reduce the incidence of neonatal sepsis in pregnancies complicated by PPROM between 34 and 37 weeks’ gestation. However, because fewer babies than expected born to the women in the expectant manage-ment group developed neonatal sepsis, this trial was underpowered. That is, too few women were enrolled in the trial to enable the detection of a small difference between the interventions in the neonatal sepsis rate. These findings also show that induction of labor did not sub-stantially affect most of the secondary outcomes measured by the researchers. Given these results and those of their meta-analysis, the researchers conclude that, in women whose pregnancy is complicated by PPROM late in pregnancy, induction of labor does not substantially improve the outcome for either the woman or her baby compared to expectant management.
Additional Information.Please access these web sites via the online version of this summary at http://dx.doi.org/10. 1371/journal.pmed.1001208.
N
The March of Dimes, a nonprofit organization forpregnancy and baby health, provides information onpreterm birth (in English and Spanish); its News Moms Need blog contains a post on PPROM
N
Tommy’s is a nonprofit organization that funds researchand provides information on the causes and prevention ofmiscarriage, premature birth, and stillbirth
N
The Royal College of Obstetricians and Gynaecologistsguidelines on the diagnosis, investigation, andmanagement of PPROM are available (in English and Russian)
N
Information about the PPROMEXIL trial is availableN
Personal stories about PPROM are available on theAustprem web site, a non-profit organization that providesinformation about prematurity and support for parents of premature babies in Australia