Distributional Variations in Trabecular
Architecture of the Mandibular Bone: An
In
Vivo
Micro-CT Analysis in Rats
Zhongshuang Liu1, Chengwei Yan2, Chen kang1, Bin Zhang1,3*, Ying Li1,3*
1Sino-Russian Institute of Hard Tissue Development and Regeneration, the Second Affiliated Hospital of Harbin Medical University, Harbin 150001, Heilongjiang, China,2Department of Pediatric Dentistry, the First Affiliated Hospital of Harbin Medical University, Harbin 150001, Heilongjiang, China,3Heilongjiang Academy of Medical Sciences, Harbin 150001, Heilongjiang, China
*[email protected](BZ); [email protected](YL)
Abstract
Purpose
To evaluate the effect of trabecular thickness and trabecular separation on modulating the trabecular architecture of the mandibular bone in ovariectomized rats.
Materials and Methods
Fourteen 12-week-old adult female Wistar rats were divided into an ovariectomy group (OVX) and a sham-ovariectomy group (sham). Five months after the surgery, the mandibles from 14 rats (seven OVX and seven sham) were analyzed by micro-CT. Images of inter-radicular alveolar bone of the mandibular first molars underwent three-dimensional recon-struction and were analyzed.
Results
Compared to the sham group, trabecular thickness in OVX alveolar bone decreased by 27% (P = 0.012), but trabecular separation in OVX alveolar bone increased by 59% (P = 0.005). A thickness and separation map showed that trabeculae of less than 100μm in-creased by 46%, whereas trabeculae of more than 200μm decreased by more than 40% in the OVX group compared to those in the sham group. Furthermore, the OVX separation of those trabecular of more than 200μm was 65% higher compared to the sham group. Bone mineral density (P = 0.028) and bone volume fraction (p = 0.001) were also significantly de-creased in the OVX group compared to the sham group.
Conclusions
Ovariectomy-induced bone loss in mandibular bone may be related to the distributional vari-ations in trabecular thickness and separation which profoundly impact the modulation of the trabecular architecture.
a11111
OPEN ACCESS
Citation:Liu Z, Yan C, kang C, Zhang B, Li Y (2015) Distributional Variations in Trabecular Architecture of
the Mandibular Bone: AnIn VivoMicro-CT Analysis in
Rats. PLoS ONE 10(1): e0116194. doi:10.1371/ journal.pone.0116194
Academic Editor:Brenda Smith, Oklahoma State University, UNITED STATES
Received:December 18, 2013
Accepted:December 7, 2014
Published:January 27, 2015
Copyright:© 2015 Liu et al. This is an open access
article distributed under the terms of theCreative
Commons Attribution License, which permits unrestricted use, distribution, and reproduction in any medium, provided the original author and source are credited.
Funding:This work was supported by the Heilongjiang postgraduate innovation science foundation (Grant No. YJSCX2012-240HLJ) and Natural Science Foundation of China (Grant No. 81170960), the National Key Science Instrument and Equipment Development Project (Grant No. 2011YQ04008708), and Specialized Research Fund for the Doctoral Program of Higher Education (Grant No. 20102307110006). The funders had no role in study design, data collection and analysis, decision to publish, or preparation of the manuscript.
Introduction
Osteoporosis is a condition of low bone mass and microstructural changes in bone tissue,
which leads to increased bone fragility and risk of fracture [1,2,3]. As the aging population
in-creases, osteoporosis should be considered as a major growing public health problem. The most common and primary osteoporosis occurs in postmenopausal women, as a consequence of ovarian atrophy and the reduction of estrogen levels. This condition causes an imbalance
be-tween bone formation and resorption and leads to bone loss [4]. Bone remodeling is a lifelong
process involving bone formation (mediated by osteoblasts) and bone resorption (mediated by osteoclasts). Imbalance between bone formation and resorption leads to metabolic bone
dis-eases, such as osteoporosis [5]. In recent years, many studies have demonstrated the
relation-ship between systemic osteoporosis and the loss of mandibular bone mass [6,7,8].
Ovariectomized rats have been widely used as experimental model for the study of
postmeno-pausal osteoporosis in the spine and long bones [9,10,11]. However, studies on the
relation-ship between bone loss in the jaw and estrogen deficiency are still controversial. Wende et al. indicated that osteoporosis is correlated with alveolar bone loss in postmenopausal women
[12]. Kribbs reported that osteoporotic women had less mandibular bone mass and density
compared to healthy women [13]. In addition, Tanaka et al. suggested that ovariectomy causes
greatly accelerated bone resorption in the mandibular alveolar bone [14]. In contrast, Moriya
et al. demonstrated that only ovariectomy may not be capable of causing periodontal
destruc-tion and alveolar bone loss [15].
Based on the studies above, understanding the influence of ovarian hormone deficiency on bone remodeling and bone structural changes of the mandible is needed. The efficacy of vari-ous measures for the assessment of trabecular bone architecture has been widely studied. Until recently, quantitative histologic techniques were the standard of the evaluation of trabecular and cortical bone architecture. The standard method to measure trabecular structure is histo-morphometry of thin stained sections. Although histological analyses provide unique informa-tion on cell morphology and dynamic index of bone remodeling, this technique has several major limitations: it is destructive, the sample preparation is tedious and it is essentially 2D by
nature [16]. However, microcomputed tomography imaging (micro-CT) is a powerful tool for
quantifying bone quality of small samples non-destructively [17,18]. With non-invasive 3D
imaging techniques, trabecular bone morphology parameters were commonly denoted by an
asterisk like mean trabecular thickness (Tb.Th), and mean trabecular separation (Tb.Sp) [19,
20,21,22]. But all these studies failed to show the distributions of the trabecular thickness and
separation in the inter-radicular alveolar bone. In our study, thickness and separation maps of the inter-radicular alveolar bone were generated by Scanco Medical image processing software.
The present study used micro-CT to evaluate the effect of trabecular thickness and trabecu-lar separation on modulating the trabecutrabecu-lar architecture of the mandibutrabecu-lar bone in
ovariectomized rats.
Materials and Methods
Fourteen 12-week-old adult female Wistar rats (approximate weight, 230–260 g) were used for
this study. All the experimental protocols followed had been approved by the Ethics Commit-tee of Harbin Medical University, and the experiments were carried out under the control of
the University’s Guidelines for Animal Experimentation.
Ovariectomy
The animals were divided randomly, seven were subjected to bilateral ovariectomy (OVX group), while the other 7 rats were selected for sham ovariectomy (sham group). All animals
were housed under the same conditions and fed a standard Rodent diet with free access to water for 5 months.
Micro-CT scanning and alveolar bone analysis
Five months after surgery, all rats were euthanized with an overdose of chloral hydrate and the mandibles were extracted and stored in 4% paraformaldehyde. Fourteen samples (seven OVX and seven sham) were scanned by a micro-CT scanner (μCT35, Scanco Medical AG, Bassers-dorf, Switzerland) with a 12μm voxel size using the following parameters: 114mA, 70kVp, and exposure time of 300ms. The scanning procedure lasted about 1h per sample and generated ap-proximately 600 images.
The region of interest (ROI) of the alveolar bone was performed according to previously
de-scribed method which succeeded in showing the integral structure of alveolar bone [19]. The
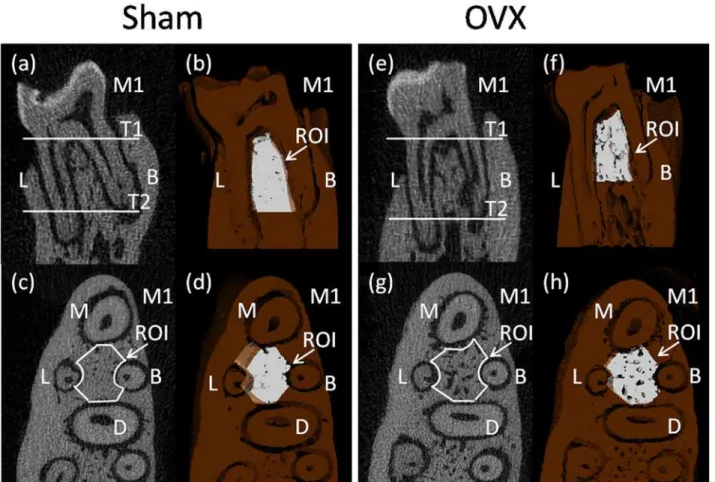
ROI of the alveolar bone was manually established in the inter-radicular septal bone of the left mandibular first molar (M1), as there is an obvious stress concentration in this region which is frequently used for histomorphometry of trabecular bone. First, we identified the coronal sur-face passing the centers of the buccal root and the lingual root on two-dimensional images (Fig. 1a,e). Then, we chose two horizontal surfaces passing the alveolar ridge crest and apex of the buccal root separately and they were parallel to the occlusion plane (T1 and T2 in
Fig. 1a,e). The white part showed the upper and lower borders of the ROI on three-dimensional
images (Fig. 1b,f). Third, we selected out the inter-radicular alveolar bone by drawing a contour
from the center of one root canal to another, avoiding roots and other structures on
two-dimensional image which showed a horizontal plane of mandibular first molar (Fig. 1c,g). The
white part showed the ROI between the centers of the four roots in the M1 on the horizontal
surfaces (Fig. 1d,h).
Three-dimensional microarchitecture of the alveolar bone was analyzed by the software af-filiated to the micro-CT. The alveolar bone histomorphometry were calculated directly from the ROI. We evaluated the bone volume/total volume (BV/TV,%), trabecular thickness (Tb.Th, mm), trabecular number (Tb.N. per mm), trabecular separation (Tb.Sp, mm), and bone miner-al density (BMD).
X-ray
The lingual side of left mandibular bone were radiographed (Fig. 2) by a Faxitron Specimen
Ra-diography System (Model MX-20; Faxitron X-ray Corporation, Wheeling, IL) at 26 kVp, expo-sure-time of 8.5s.
Statistical analysis
All data was presented as means±SD, and statistical analysis was carried out by using SPSS, ver-sion 13.0 (SPSS Inc., Chicago, IL, USA). Parameters of the sham and OVX groups were
com-pared by using the t-test. A result was considered as statistically significant at P<0.05.
Results
Micro-CT histomorphometry of alveolar bone structure analysis
Micro-CT was able to assess trabecular bone morphology of alveolar bone in both
two-dimen-sional and three-dimentwo-dimen-sional views. Two-dimentwo-dimen-sional images of coronal sections (Fig. 1a,e)
and horizontal sections (Fig. 1c,g) showed the marrow spaces, in which the inter-radicular
were used to visualize the region of the inter-radicular alveolar bone in rats (Fig. 1b,d,f,h). The quantification of micro-CT trabecular bone changes (mean±SD) was shown in the OVX and
sham groups (Table 1andFig. 3). All trabecular parameters in alveolar bone showed significant
changes. The inter-radicular alveolar bone trabecular bone volume fraction (BV/TV) was found to be lower in the animals of the OVX group as compared to those of the sham groups (p = 0.001). Moreover, lower bone mass and looser construction of more widely separated tra-beculae could be observed in OVX rats. At the same time, BMD was significantly reduced in the OVX rats compared to that of the sham rats (P = 0.028). Furthermore, the inter-radicular alveolar bone loss of the molars was confirmed through X-ray measurement between two
groups inFig. 2. However, trabecular number exhibited no significant differences either in
sham or in OVX rats.
Trabecular thickness and trabecular separation analysis
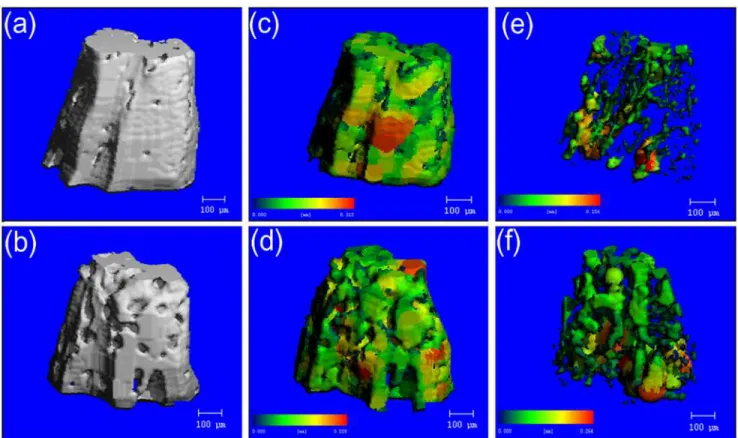
Images of inter-radicular alveolar bone generated by micro-CT were shown inFig. 4. a and b
showed the 3D reconstruction images. Pseudocolor coding displayed larger thicknesses and seperations in red and smaller thicknesses and seperations in blue/green. The thickness map Fig 1. Micro-CT images of the rat mandibular alveolar bone and the mandibular first molar.a,b,c,d were obtained from a sham rat, while e,f,g,h were obtained from an ovariectomied rat. a,b,e,f showed the coronal surface passing the centers of the buccal root and the lingual root. c,d,g,h showed the horizontal surface which was parallel to the occlusion plane. M1, the mandibular first molar; M, mesial root; B, buccal root; D, distal root; L, lingual root. T1 and T2, two horizontal surfaces passed the alveolar ridge crest and apex of the buccal root separately and were parallel to the occlusion plane. a,c,e,g showed two-dimensional images, b,d,f,h showed three-dimensional images. In the 3D reconstruction images, the deep brown part represented alveolar bone and the white part represented the region of interest (ROI).
doi:10.1371/journal.pone.0116194.g001
(c,d) and the separation map (e,f) generated after segmentation of teeth and bone demonstrat-ed the ability to quantitatively analyze trabecular bone morphology.
Trabecular thickness in OVX alveolar bone decreased by 27% (P = 0.012) compared to the sham group. Trabecular separation in OVX alveolar bone increased by 59% (P = 0.005)
com-pared to the sham group (Fig. 3). Compared with the compact structure of alveolar bone in
sham rats, there were more pores on the surfaces of alveolar bone in OVX rats (Fig. 4a,b). After
segmentation of inter-radicular alveolar bone from jaw bone, the thickness map (Fig. 4c,d) and
separation map (Fig. 4e,f) of the inter-radicular alveolar bone surface layer indicated significant
differences in Tb.Th. and Tb.Sp. distribution of the alveolar bone between the sham and OVX
rats. Tables2and3showed comparision of the distributions of the trabecular thickness and
trabecular separation in the inter-radicular region of the mandibular bone between the sham and OVX groups. It provided the percentage of trabeculae with different thicknesses and Fig 2. Analysis of mandible on radiographs: (a) Sham group (b) OVX group.The arrows showed the inter-radicular alveolar bone loss of the molars.
doi:10.1371/journal.pone.0116194.g002
Table 1. The microarchitectural parametric values of the mandibular bone in the inter-radicular region (n = 7).
Sham OVX P
BV/TV (%) 89.71±4.10 76.13±6.52 0.001**
Tb.N.(1 mm-1) 7.174±0.80 7.398±0.61 0.564
Tb.Th. (mm) 0.208±0.026 0.164±0.030 0.012*
Tb.Sp. (mm) 0.064±0.019 0.102±0.022 0.005**
BMD (mg cm3) 985.6±25.89 949.35±28.38 0.028
*
BV/TV, bone volume fraction; Tb.N., trabecular number; Tb.Th., trabecular thickness; Tb.Sp., trabecular separation; BMD, bone mineral density.
*P<0.05,
**P<0.01.
Fig 3. Micro-tomographic histomorphometric comparisons between the sham and OVX groups.Values are mean±S.D. Significant differences between the two groups were marked with asterisks (*P<0.05;**P<0.01).
doi:10.1371/journal.pone.0116194.g003
Fig 4. Representative image illustrating micro-CT image analysis in the inter-radicular region of the mandibular bone.a, c, e were obtained from a sham rat, while b, d, f were obtained from an ovariectomied rat. Pseudocolor coding displayed larger thicknesses and seperations in red and smaller thicknesses and seperations in blue/green. a,b showed the 3D reconstruction images. The thickness map (c,d) and the separation map (e,f) generated after segmentation of teeth and bone demonstrated the ability to quantitatively analyze trabecular bone morphology.
doi:10.1371/journal.pone.0116194.g004
trabecular separation (In-%) with an assessment through the software affiliated to the micro-CT in the sham and OVX groups. Obvious differences in trabecular thickness and separation
between the OVX rats and the sham rats could be found inFig. 5.
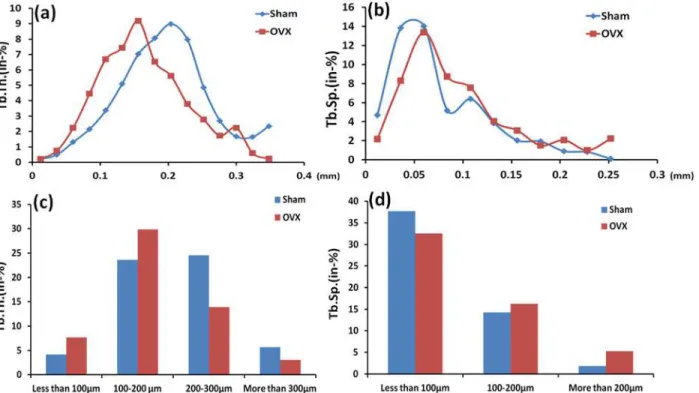
Trabeculae of less than 100μm and 100–200μm in the OVX group increased by 46% and
21% respectively compared to those in the sham group. Trabeculae of 200–300μm and more
than 300μm in the OVX group were 43% and 46% lower than those in the sham group. Fur-thermore, trabecular separation of less than 100μm in the sham group was 16% higher than the OVX group. The OVX group had significantly higher trabecular separation by 14% and 65%
for trabecular separation of 100–200μm and more than 200μm, respectively, compared to the
sham group. At the same time, trabeculae of 156μm thick was dominant in the alveolar bone in the OVX group, and the same thickness in sham rats was about 23% lower than that in OVX rats. However, trabeculae of 204μm thick was dominant in the alveolar bone in the sham group, and the same thickness in sham rats was about 38% higher than that in OVX rats. In ad-dition, trabecular separation of 60μm took over the majority in the alveolar bone in both the sham and OVX groups, but trabecular separation of more than 60μm in the OVX group was al-most always significantly higher than that in the sham group. Specifically, the difference
reached more than 30% between the two groups (Fig. 5).
Discussion
Osteoporosis is becoming a public health problem because this disease appears in the elderly, especially postmenopausal women. Estrogen deficiency would be expected to increase bone
re-sorption and impair bone formation [23,24]. With the increasing number of elderly dental
pa-tients, the effects of osteoporosis on alveolar bone have become an important issue in the field of dentistry. Previous studies showed that osteoporosis may significantly affect the alveolar bone remodeling processes, which have been observed in treatments such as orthodontic
movement, implant restoration, periodontal treatment [25]. Micro-CT systems have become
an effective and noninvasive method for the assessment of bone microstructural features. The Table 2. Comparison of the distributions of the trabecular thickness in the inter-radicular region of the mandibular bone between the sham and OVX groups.
Tb.Th. Group
0.012 0.036 0.06 0.084 0.108 0.132 0.156 0.18 0.204 0.228 0.252 0.276 0.300 0.324 0.348
Sham(in-%) 0.197 0.485 1.311 2.152 3.372 5.101 7.038 8.066 8.999 7.978 4.856 2.696 1.672 1.647 2.353 OVX(in-%) 0.224 0.752 2.247 4.453 6.693 7.446 9.184 6.537 5.608 3.791 2.783 1.731 2.246 0.598 0.229
Tb.Th., trabecular thickness (mm).
Sham (in-%) and OVX (in-%) respectively represent the percentages of trabeculae with different thicknesses in the sham and OVX groups.
doi:10.1371/journal.pone.0116194.t002
Table 3. Comparison of the distributions of the trabecular separation in the inter-radicular region of the mandibular bone between the sham and OVX groups.
Tb.Sp. Group
0.012 0.036 0.060 0.084 0.108 0.132 0.156 0.18 0.204 0.228 0.252
Sham (in-%) 4.675 13.838 14.018 5.183 6.387 3.863 2.045 1.933 0.913 0.828 0.109
OVX (in-%) 2.175 8.300 13.374 8.719 7.566 4.052 3.088 1.517 2.070 1.009 2.222
Tb.Sp., trabecular separation (mm).
Sham (in-%) and OVX (in-%) respectively represent the percentages of trabecular separation in the sham and OVX groups.
advantage of using micro-CT is that it can show internal and external alveolar bone anatomy
in smallest possible fraction clearly and accurately [17,26]. The efficacy of various measures by
micro-CT for the assessment of trabecular bone architecture has been widely studied, but all these methods failed to show the distributions of the trabecular thickness and separation in the
inter-radicular alveolar bone of the mandible [19,27]. In our study, thickness and separation
maps of the inter-radicular alveolar bone were generated by using Scanco Medical image pro-cessing software. Larger trabecular thickness could be observed in the sham group compared to the OVX group. Moreover, trabecular thickness of less than 200μm significantly increased in the OVX rats compared to the sham rats. Correspondingly, the OVX group had significantly higher trabecular separation for trabecular separation of more than 200μm compared to the sham group. According to the significant variations between the sham and OVX rats, it ex-plained that a looser structure of more widely separated trabeculae could be observed in OVX rats. Compared to other researches, our study not only showed the mean trabecular thickness and mean trabecular separation to indicate the effect of osteoporosis on the bone quality and quantities, but also exhibited significant difference in the distribution of trabecular thickness
and separation between OVX and sham rats [28,29,30,31].
Postmenopausal osteoporosis is a kind of metabolic osteopathy that produces bone of lower
quality, and osteoporosis of mandible often leads to the failure of dental prosthetics [28]. Bone
micro-architecture is an important factor, which contributes to bone quality. Obviously, the distribution of trabecular thickness and separation has effects on the alveolar bone mechanical property, which is very important for the stability and long-term success of dental treatment in osteoporosis. Because the mean trabecular thickness and separation are the most important pa-rameters to estimate the microstructure of cancellous bone, some studies have indicated that Fig 5. Comparison of the distributions of the trabecular thickness (a) and the trabecular separation (b) in the inter-radicular region of the mandibular first molar between the Sham and OVX groups; Comparison between two groups of the different ranges for trabecular thickness (c) and trabecular separation (d).Tb.Th., trabecular thickness; Tb.Sp., trabecular separation.
doi:10.1371/journal.pone.0116194.g005
trabecular thickness and separation are necessary for reliable investigation of morphologic
changes in bone [17,19]. However, even if the elderly dental patients have the similar mean
trabecular thickness and separation, it still wouldn’t prove that their bone is in approximately
the same structure. Therefore, establishing a proper evaluation method is very important to un-derstand trabecular architecture under osteoporotic situation. In this paper, a new method was proposed to evaluate the effect of trabecular thickness and separation on modulating the tra-becular architecture of the mandibular bone in ovariectomized rats.
Furthermore, the present study indicated that the peak value of trabecular thickness in the inter-radicular alveolar bone was obviously decreased from 204μm in the sham rats to 156μm in the OVX rats. The values of the trabecular thickness in the OVX group were considerably lower than those in the sham group. Specifically, the difference reached more than 30%
be-tween the two groups. In addition, trabecular separation of more than 60μm significantly
in-creased in the OVX rats compared to the sham rats. The value of trabecular separation in the sham group was approximately 21%, which was about 10% lower than that of the OVX group. These differences may be a consequence of the internal organization structures of trabecular
bone changing in ovariectomized rats [15,28]. Considering the influences of osteoporosis, the
analysis revealed an expected significant difference in the peak value of trabecular thickness and the distribution of trabecular separation of more than 60μm. Despite the great impact caused by osteoporosis, some investigators continued to use mean value analysis to trabecular structural parameters without considering the effect of distributional variations in trabecular
architecture on their evaluation [32,33]. Therefore, it is important to take distribution of
tra-becular thickness and separation of alveolar bone into account so that the tratra-becular architec-ture can be analyzed accurately.
There was also a significant decrease of bone volume fraction, bone mineral density con-firmed by micro-CT analysis in the OVX rats when compared with the sham group. The OVX condition resulted in alteration of the trabecular distance and thickness as compared to the sham group, which indicated profound impact on the histological integrity of the bone. The re-duction in trabecular bone volume accompanied by the expansion of bone marrow area in the alveolar bone encompassing mandibular molars was in agreement with another investigation
[19]. In this context, these results may describe a state of osteopenia in the OVX rats, which
might be the result of an imbalance between bone formation and resorption. The effects of es-trogen-deficiency on the bones were complex. It was mentioned in literature that estrogen
ex-erts direct anabolic effects on bone cells [34]. It stimulated bone resorption or bone formation
and regulated osteoclastic differentiation from hematopoietic mononuclear cells, and osteo-blastic functions and activity. Tanaka et al previously reported high bone turnover of
mandibu-lar alveomandibu-lar bone in OVX rats, in both high osteoclastic and osteoblastic parameters [14].
Moreover, osteoclasts showed reduced bone resorption in response to ovarian
estrogen-defi-ciency [24]. These findings support the idea that estrogen-deficiency in bone could directly
me-diate the stimulation of osteoblasts and inhibition of osteoclasts, which may be the reason for the porotic changes in trabecular structure. Furthermore, it could have profound effects on bio-mechanical behavior of bone.
BMDs were continually evaluated for 5 months after the ovariectomy. Analysis of mandibular BMD data revealed that the sham group and OVX group had significant differences in statistics. This was comparable to the results of Rawlinson et al., which showed that the period of 5 months
was sufficient to detect statistical changes in the mandibular bone structure [35]. The BMD in the
OVX group was lower (P<0.001) than that in the sham group. Results relative to the OVX
group agreed with other studies [9,36,37,38] that found lower BMD after ovariectomy. Contrary
to the results presented here, Kuroda et al. showed no differences between the sham and OVX
Consider that rat’s incisors occupy a large area, it may change the DXA analyses because the mineral content of incisors and molars is included in global BMD evaluation. Removal of these teeth may change the mandible bone structure, while teeth extraction for the evaluation of DXA was a more complex process, particularly in the region near dental elements which may
limit or alter the BMD read by DXA [40]. Micro-CT has been used for a wide range of studies
to estimate bone mineral density [41,42]. Compared to DXA, the advantage of using
micro-CT for assessment of bone mass was that the ROI can be performed as required [17,43,44]. In
our study, the ROI of the alveolar bone was successfully performed while avoiding the influence from the molars. Consequently, the degree of mineralization in the inter-radicular alveolar bone can be analyzed accurately by micro-CT.
The results of the present study seem to confirm the hypothesis that estrogen levels have an important effect on alveolar bone. Significant adaptation of trabecular bone architecture in al-veolar bone to a modified OVX environment happened. This, extrapolated to humans, could mean that for those elderly postmenopausal women who seek dental treatment, the effect of postmenopausal osteoporosis on the alveolar bone quantity and quality can be expected. How-ever, the micro-CT analysis technique cannot, at present, be used for dynamic bone histomor-phometry. Furthermore, the measurement of the dynamics of bone formation is needed for further studies to evaluate the influence of estrogen deficiency on the alveolar bone.
Author Contributions
Conceived and designed the experiments: BZ YL. Performed the experiments: ZL Ck. Analyzed the data: CY. Wrote the paper: ZL.
References
1. Genant HK, Cooper C, Poor G, Reid I, Ehrlich G, et al. (1999) Interim report and recommendations of the World Health Organization Task-Force for Osteoporosis. Osteoporos Int 10: 259–264. doi: 10.1007/s001980050224PMID:10692972
2. Kanis JA, Melton LJ, Christiansen C, Johnston CC, Khaltaev N (1994) The diagnosis of osteoporosis. J Bone Miner Res 9: 1137–1141. doi:10.1002/jbmr.5650090802PMID:7976495
3. Legrand E, Chappard D, Pascaretti C, Duquenne M, Krebs S, et al. (2000) Trabecular bone microarchi-tecture, bone mineral density, and vertebral fractures in male osteoporosis. J Bone Miner Res 15: 13–19. doi:10.1359/jbmr.2000.15.1.13PMID:10646109
4. Frost HM (1999) On the estrogen–bone relationship and postmenopausal bone loss: a new model. J Bone Miner Res 14: 1473–1477. doi:10.1359/jbmr.1999.14.9.1473PMID:10469274
5. Heshmati HM, Khosla S, Robins SP, O’Fallon WM, Melton LJ, et al. (2002) Role of low levels of endog-enous estrogen in regulation of bone resorption in late postmenopausal women. J Bone Miner Res 17: 172–178. doi:10.1359/jbmr.2002.17.1.172PMID:11771665
6. Jeffcoat MK, Lewis CE, Reddy MS, WANG CY, Redford M (2000) Post‐menopausal bone loss and its relationship to oral bone loss. Periodontol 2000 23: 94–102. doi:10.1034/j.1600-0757.2000.2230109.x PMID:11276771
7. Jeffcoat M (1998) Osteoporosis: a possible modifying factor in oral bone loss. Ann periodontol 3: 312–321. doi:10.1902/annals.1998.3.1.312PMID:9722715
8. Hildebolt C (1997) Osteoporosis and oral bone loss. Dentomaxillofac Rad 26: 3–15. doi:10.1038/sj. dmfr.4600226
9. Omi N, Ezawa I (1995) The effect of ovariectomy on bone metabolism in rats. Bone 17: S163–S168. doi:10.1016/8756-3282(95)00329-C
10. Wronski T, Schenk P, Cintron M, Walsh C (1987) Effect of body weight on osteopenia in ovariectomized rats. Calcified Tissue Int 40: 155–159. doi:10.1007/BF02555700
11. Elovic R, Hipp J, Hayes W (1995) Ovariectomy decreases the bone area fraction of the rat mandible. Calcified Tissue Int 56: 305–310. doi:10.1007/BF00318051
12. Wactawski-Wende J, Grossi SG, Trevisan M, Genco RJ, Tezal M, et al. (1996) The role of osteopenia in oral bone loss and periodontal disease. J Periodontol 67: 1076–1084. doi:10.1902/jop.1996.67.10s. 1076PMID:8910826
13. Kribbs PJ, Chesnut III CH, Ott SM, Kilcoyne RF (1989) Relationships between mandibular and skeletal bone in an osteoporotic population. J Prosthet Dent 62: 703–707. doi:10.1016/0022-3913(89)90596-9 PMID:2585328
14. Tanaka M, Toyooka E, Kohno S, Ozawa H, Ejiri S (2003) Long-term changes in trabecular structure of aged rat alveolar bone after ovariectomy. Or Surg or Med or Pa 95: 495–502. doi:10.1067/moe.2003. 135PMID:12686937
15. Moriya Y, Ito K, Murai S (1998) Effects of experimental osteoporosis on alveolar bone loss in rats. J Oral ScI 40: 171. doi:10.2334/josnusd.40.171PMID:10036831
16. Müller R, Van Campenhout H, Van Damme B, Van der Perre G, Dequeker J, et al. (1998) Morphometric analysis of human bone biopsies: a quantitative structural comparison of histological sections and micro-computed tomography. Bone 23: 59–66. doi:10.1016/S8756-3282(98)00068-4PMID:9662131 17. Bouxsein ML, Boyd SK, Christiansen BA, Guldberg RE, Jepsen KJ, et al. (2010) Guidelines for
assess-ment of bone microstructure in rodents using micro–computed tomography. J Bone Miner Res 25: 1468–1486. doi:10.1002/jbmr.141PMID:20533309
18. González‐García R, Monje F (2012) Is micro‐computed tomography reliable to determine the micro-structure of the maxillary alveolar bone? Clin Oral Implan Res 24: 730–737.
19. Dai QG, Zhang P, Wu YQ, Ma XH, Pang J, et al. (2013) Ovariectomy induces osteoporosis in the maxil-lary alveolar bone: an in vivo micro‐CT and histomorphometric analysis in rats. Oral Dis.
20. Litzlbauer HD, Neuhaeuser C, Moell A, Greschus S, Breithecker A, et al. (2006) Three-dimensional im-aging and morphometric analysis of alveolar tissue from microfocal X-ray-computed tomography. Am J Physiol-lung C 291: L535–L545. doi:10.1152/ajplung.00088.2005
21. Moon H-S, Won Y-Y, Kim K-D, Ruprecht A, Kim H-J, et al. (2004) The three-dimensional microstructure of the trabecular bone in the mandible. Surg Radiol Anat 26: 466–473. doi: 10.1007/s00276-004-0247-xPMID:15146293
22. Brouwers J, Lambers F, Gasser J, Van Rietbergen B, Huiskes R (2008) Bone degeneration and recov-ery after early and late bisphosphonate treatment of ovariectomized wistar rats assessed by in vivo micro-computed tomography. Calcified Tissue Int 82: 202–211. doi:10.1007/s00223-007-9084-3 23. Riggs BL (1991) Overview of osteoporosis. Western J Med 154: 63–77.
24. Garnero P, Sornay‐Rendu E, Chapuy MC, Delmas PD (1996) Increased bone turnover in late postmen-opausal women is a major determinant of osteoporosis. J Bone Miner Res 11: 337–349. doi:10.1002/ jbmr.5650110307PMID:8852944
25. Ejiri S, Tanaka M, Watanabe N, Anwar RB, Yamashita E, et al. (2008) Estrogen deficiency and its effect on the jaw bones. J Bone Miner Metab 26: 409–415. doi:10.1007/s00774-008-0870-4PMID:
18758898
26. Cardoso L, Fritton SP, Gailani G, Benalla M, Cowin SC (2012) A review of recent advances in the as-sessment of bone porosity, permeability, and interstitial fluid flow. J Biomech 46: 253–265. doi: 10.1016/j.jbiomech.2012.10.025PMID:23174418
27. Shimizu Y, Ishida T, Hosomichi J, Kaneko S, Hatano K, et al. (2013) Soft diet causes greater alveolar osteopenia in the mandible than in the maxilla. Arch Oral Biol 58: 907–911. doi:10.1016/j.archoralbio. 2013.02.003PMID:23490352
28. Jiang G, Matsumoto H, Fujii A (2003) Mandible bone loss in osteoporosis rats. J Bone Miner Metab 21: 388–395. doi:10.1007/s00774-003-0433-7PMID:14586795
29. Laib A, Kumer J, Majumdar S, Lane N (2001) The temporal changes of trabecular architecture in ovari-ectomized rats assessed by MicroCT. Osteoporosis Int 12: 936–941. doi:10.1007/s001980170022 30. Jonasson G, Bankvall G, Kiliaridis S (2001) Estimation of skeletal bone mineral density by means of the
trabecular pattern of the alveolar bone, its interdental thickness, and the bone mass of the mandible. Or Surg or Med or Pa 92: 346–352. doi:10.1067/moe.2001.116494PMID:11552157
31. Lerouxel E, Libouban H, Moreau M-F, Baslé MF, Audran M, et al. (2004) Mandibular bone loss in an an-imal model of male osteoporosis (orchidectomized rat): a radiographic and densitometric study. Osteo-porosis Int 15: 814–819. doi:10.1007/s00198-004-1611-8
32. Cui G, Leng H, Wang K, Wang J, Zhu S, et al. (2013) Effects of Remifemin Treatment on Bone Integrity and Remodeling in Rats with Ovariectomy-Induced Osteoporosis. PloS One 8: e82815. doi:10.1371/ journal.pone.0082815PMID:24349369
33. Leppänen OV, Sievänen H, Jokihaara J, Pajamäki I, Kannus P, et al. (2008) Pathogenesis of age-related osteoporosis: impaired mechano-responsiveness of bone is not the culprit. PloS One 3: e2540. doi:10.1371/journal.pone.0002540PMID:18648530
35. Rawlinson S, Boyde A, Davis G, Howell P, Hughes F, et al. (2009) Ovariectomy vs. hypofunction: their effects on rat mandibular bone. J Dent Res 88: 615–620.
36. Orrico SR, Giro G, Gonçalves D, Takayama L, Pereira RM (2007) Influence of the period after ovariec-tomy on femoral and mandibular bone density and on induced periodontal disease. J Periodontol 78: 164–169. doi:10.1902/jop.2007.060136PMID:17199554
37. Jiang G, Matsumoto H, Yamane J, Kuboyama N, Akimoto Y, et al. (2004) Prevention of trabecular bone loss in the mandible of ovariectomized rats. Journal of oral science 46: 75–85. doi:10.2334/josnusd. 46.75PMID:15287540
38. Jiang G-Z, Matsumoto H, Hori M, Gunji A, Hakozaki K, et al. (2008) Correlation among geometric, den-sitometric, and mechanical properties in mandible and femur of osteoporotic rats. J Bone Miner Metab 26: 130–137. doi:10.1007/s00774-007-0811-7PMID:18301968
39. Kuroda S, Mukohyama H, Kondo H, Aoki K, Ohya K, et al. (2003) Bone mineral density of the mandible in ovariectomized rats: analyses using dual energy X‐ray absorptiometry and peripheral quantitative computed tomography. Oral Dis 9: 24–28. doi:10.1034/j.1601-0825.2003.01810.xPMID:12617254 40. Sornay‐Rendu E, Boutroy S, Munoz F, Delmas PD (2007) Alterations of cortical and trabecular archi-tecture are associated with fractures in postmenopausal women, partially independent of decreased BMD measured by DXA: the OFELY study. J Bone Miner Res 22: 425–433. doi:10.1359/jbmr.061206 PMID:17181395
41. Jiang Y, Zhao J, Liao E-Y, Dai R-C, Wu X-P, et al. (2005) Application of micro-CT assessment of 3-D bone microstructure in preclinical and clinical studies. J Bone Miner Metab 23: 122–131. doi:10.1007/ BF03026336PMID:15984427
42. Ding M, Odgaard A, Hvid I (1999) Accuracy of cancellous bone volume fraction measured by micro-CT scanning. J Biomech 32: 323–326. doi:10.1016/S0021-9290(98)00176-6PMID:10093033
43. Hanson NA, Bagi CM (2004) Alternative approach to assessment of bone quality using micro-computed tomography. Bone 35: 326–333. doi:10.1016/j.bone.2004.02.019PMID:15207774
44. Genant H, Engelke K, Prevrhal S (2008) Advanced CT bone imaging in osteoporosis. Rheumatology 47: iv9–iv16. doi:10.1093/rheumatology/ken180PMID:18556648