www.atmos-chem-phys.net/12/7809/2012/ doi:10.5194/acp-12-7809-2012
© Author(s) 2012. CC Attribution 3.0 License.
Chemistry
and Physics
Chemically-resolved aerosol eddy covariance flux measurements in
urban Mexico City during MILAGRO 2006
R. Zalakeviciute1,*, M. L. Alexander2, E. Allwine3, J. L.Jimenez4, B. T. Jobson3, L. T. Molina5, E. Nemitz6, S.N. Pressley3, T. M. VanReken3, I. M. Ulbrich4, E. Velasco7, and B. K. Lamb3
1Department of Ecology and Evolutionary Biology, Cornell University, Ithaca, NY, USA 2Pacific Northwest National Laboratory, Richland, WA, USA
3Laboratory for Atmospheric Research, Washington State University, Pullman, WA, USA 4Department of Chemistry & Biochemistry, University of Colorado, Boulder, CO, USA 5Molina Center for Energy and the Environment (MCE2), USA
6Centre for Ecology and Hydrology, Edinburgh, UK
7Center for Environmental Sensing and Modeling, Singapore
*formerly at: Laboratory for Atmospheric Research, Washington State University, Pullman, WA, USA
Correspondence to:B. K. Lamb (blamb@wsu.edu)
Received: 29 February 2012 – Published in Atmos. Chem. Phys. Discuss.: 9 May 2012 Revised: 2 August 2012 – Accepted: 11 August 2012 – Published: 31 August 2012
Abstract. As part of the MILAGRO 2006 field campaign, the exchange of atmospheric aerosols with the urban land-scape was measured from a tall tower erected in a heav-ily populated neighborhood of Mexico City. Urban submi-cron aerosol fluxes were measured using an eddy covari-ance method with a quadrupole aerosol mass spectrometer during a two week period in March, 2006. Nitrate and am-monium aerosol concentrations were elevated at this loca-tion near the city center compared to measurements at other urban sites. Significant downward fluxes of nitrate aerosol, averaging−0.2 µg m−2s−1, were measured during daytime. The urban surface was not a significant source of sulfate aerosols. The measurements also showed that primary ganic aerosol fluxes, approximated by hydrocarbon-like or-ganic aerosols (HOA), displayed diurnal patterns similar to CO2fluxes and anthropogenic urban activities. Overall, 47 % of submicron organic aerosol emissions were HOA, 35 % were oxygenated (OOA) and 18 % were associated with biomass burning (BBOA). Organic aerosol fluxes were bi-directional, but on average HOA fluxes were 0.1 µg m−2s−1, OOA fluxes were−0.03 µg m−2s−1, and BBOA fluxes were −0.03 µg m−2s−1. After accounting for size differences (PM1 vs PM2.5) and using an estimate of the black carbon component, comparison of the flux measurements with the 2006 gridded emissions inventory of Mexico City, showed
that the daily-averaged total PM emission rates were essen-tially identical for the emission inventory and the flux mea-surements. However, the emission inventory included dust and metal particulate contributions, which were not included in the flux measurements. As a result, it appears that the in-ventory underestimates overall PM emissions for this loca-tion.
1 Introduction
(NH+4), sulfate (SO24−), and nitrate (NO−3), but it can also in-clude primary sodium (Na+) and chloride (Cl−) and crustal
elements (Heintzenberg, 1989). Unlike the inorganic aerosol component, the organic aerosol (OA) is composed of thou-sands of individual compounds. While a small fraction of in-organic aerosol components may be associated with organon-itrates and organosulfates, in this paper we still use inor-ganic component nomenclature with the charges (e.g. SO24−) (for more information see Farmer et al. 2010). The Aero-dyne Aerosol Mass Spectrometer (AMS) (Canagaratna et al., 2007) has emerged as a valuable tool to provide an in-dication of the make-up of the organic aerosol (OA) mass. The application of statistical techniques such as Positive Ma-trix Factorization (PMF, see Sect. 2.4 below) to the AMS mass spectra often identifies individual OA components that are consistent between studies (Ng et al., 2010, 2011). Pri-mary organic aerosols (POA) are directly emitted from nat-ural or anthropogenic sources, such as fossil fuel combus-tion, cooking, and other urban sources. These are usually identified by an AMS factor referred to as hydrocarbon-like OA (HOA), but cooking aerosols are increasingly identified separately (Allan et al., 2010) or as part of the aerosols as-sociated with biomass burning (BBOA). Secondary organic aerosols (SOA) are formed by atmospheric oxidation of gas-phase species (Jimenez et al., 2009) and are identified as oxy-genated organic aerosols (OOA) due to their characteristic mass spectrum with high oxygen content. The OOA some-times can be divided into sub-classes. Low-volatility OOA (LV-OOA), characterized by a high O:C ratio, is associated with regional and aged SOA (Jimenez et al., 2009; Cappa and Jimenez, 2010). Semi-volatile OOA (SV-OOA) has a lower O:C ratio, and is associated with less photochemically aged SOA (Jimenez et al., 2009).
A substantial fraction of particulate pollution is produced by industry and transportation in urban areas and is recog-nized to influence regional and global atmospheric chemistry (Lawrence et al., 2007). Anthropogenic pollution problems have been intensified by the rapid urbanization and the grow-ing number of megacities (population exceedgrow-ing 10 million inhabitants). Currently, about 58 % of the global population lives in urban areas, which have a population growth rate 18 times higher than in the rural areas (UN, 2010). Thus, in or-der to reliably predict future impacts on environment and hu-man health, it is essential to understand the sources, chemical nature, evolution, and fate of urban pollution. The Megacity Initiative: Local and Global Research Observations (MILA-GRO) 2006 field campaign, conducted in Mexico City dur-ing March 2006, was an international initiative designed to study these topics (Molina et al., 2010). One research focus during MILAGRO was the exchange of mass and energy be-tween the urban surface and the atmosphere. Using fast re-sponse sensors coupled with eddy covariance (EC) methods, fluxes of chemically-resolved submicron aerosols, selected volatile organic compounds (VOCs), CO2, and components of the energy balance were measured in a typical
residen-tial and commercial neighborhood of Mexico City. Ambient NOx, CO, and O3concentrations were also measured. Anal-yses of fluxes of VOCs and CO2 and the local energy bal-ance have been reported by Velasco et al. (2009; 2011). In this work, we present results from the aerosol flux measure-ments.
Integral aerosol mass and number fluxes have been re-ported for a few urban sites (Dorsey et al., 2002; Vogt et al., 2011), This work extends this approach to measure ur-ban EC fluxes of individual aerosol chemical components using an Aerodyne Quadrupole Aerosol Mass Spectrometer (Q-AMS). We follow the approach described by Nemitz et al. (2008) for Boulder, CO (USA), which has since been ap-plied to measure chemically resolved fluxes above Gothen-burg (Sweden), and in London, Manchester, and EdinGothen-burgh (all in the UK) (Thomas, 2007; Nemitz et al., 2008). Here, we present the first chemically resolved urban aerosol EC fluxes for an arid, subtropical megacity. The objectives of this study were to investigate daily patterns of aerosol concentrations and fluxes over a megacity landscape, identify the sources and sinks for organic, nitrate and sulfate aerosols, and, to the extent possible, compare the measurements with the existing gridded emissions inventory of Mexico City.
2 Methods
2.1 Experimental setup and study period
The flux measurements were conducted in a popu-lated neighborhood (Escandon district: 19◦24′12.63′′N,
99◦10′34.18′′W, 2240 m above sea level) near the center of
Mexico City and surrounded by a dense road network in-cluding several major avenues (Fig. 1). Following the lo-cal climate zone classification proposed by Stewart and Oke (2010), the monitored urban surface corresponds to “com-pact housing”. The predominant land use is residential and commercial with 57 % of the surface covered by buildings of three and four stories high; roadways and other impervi-ous surfaces accounted for 37 %, and vegetation covered the remaining 6 %. The site is completely flat with a relatively homogeneous distribution of roughness elements (i.e., build-ings and trees) and emission sources (i.e., vehicular traffic).
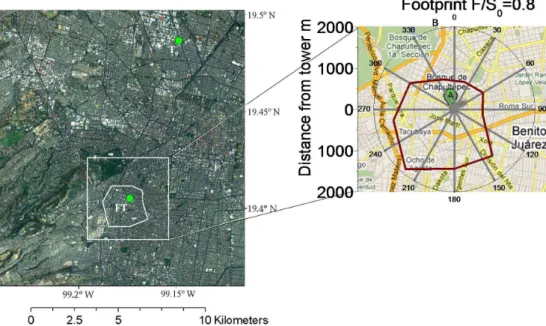
Fig. 1.Aerial photograph of Mexico City showing the MILAGROT0and SIMAT flux tower (FT) sites with green dots. The white contour indicates the footprint that accounted for 80 % (F/S0=0.8) of the measured aerosol fluxes during the entire study as a function of the wind direction. The aerial photograph was taken from ArcMap. The insert to the right shows the flux footprint plotted over the area map (Google Maps) immediately around the tower.
also measured at the roof level. Additional details are given by Velasco et al. (2009, 2011)
For the aerosol flux measurements, air was drawn at a high rate (∼60 slpm) through a 1.6 cm (5/8”) outer diameter (OD) 27 m long copper sampling line down to a pump located on the roof of the building. A second smaller pump was used to draw sample air from the copper line upstream of the large pump through a 0.6 cm (1/4′′) OD 1 m long stainless steel tubing into the Q-AMS (Aerodyne Research, Inc, Bil-lerica, MA) located in a small penthouse room on the roof. Data were recorded at 10 Hz for both the Q-AMS and sonic anemometer using custom Q-AMS flux data acquisition soft-ware (Nemitz et al., 2008) and LabView (National Instru-ments) software, respectively.
Aerosol fluxes were measured during the period 12–30 March 2006. However, the week of 18–24 March was ex-cluded from the data analysis due to unstable instrument op-erations caused by frequent power outages in the residen-tial area. The remaining two sampling periods were char-acterized by different meteorological conditions. In the first period, conditions were warm and mostly sunny with fre-quent wildfires in the surrounding mountains (see Fig. S2), while in the second period, conditions were more humid with frequent afternoon precipitation and wildfires were strongly suppressed (Fast et al., 2007; Aiken et al., 2010) (Fig. 2).
The data are presented in local time and ambient condi-tions. Aerosol concentrations are shown in µg m−3and fluxes in µg m−2s−1. In this article we refer to positive (upward) fluxes as emissions and negative (downward) fluxes as de-position although these can include formation or loss of
aerosols within the urban canopy below the measurement height.
2.2 The Aerodyne Quadrupole Aerosol Mass Spectrometer (Q-AMS)
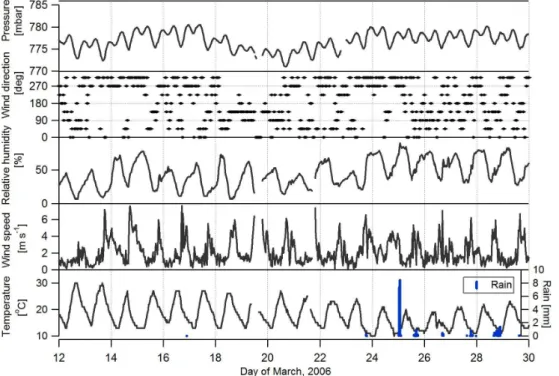
Fig. 2.Pressure, wind direction, relative humidity, wind speed, ambient temperature, and precipitation (right axis) data at 30 min time step measured at the SIMAT site during the observation period.
2.3 Operation modes
During the field campaign, the Q-AMS was operated in al-ternating modes for 30-min periods to measure either con-centrations or fluxes, respectively. These modes of operation have been described in detail by Jimenez et al. (2003) and Nemitz et al. (2008), and they are only briefly reviewed here. In the concentration mode (“general alternation” or GenAlt mode), the instrument alternated among three sub-modes (20 s in each submode cycled during a 2.5 min aver-aging period) in order to measure: (i) particle size-resolved composition (particle time of flight (PToF) submode), (ii) en-semble composition form/z12-300 without size resolution (mass spectrum (MS) submode), and (iii) ensemble compo-sition at selectedm/zonly (jump mass spectrum (JMS) sub-mode (Crosier et al., 2007). Each subsub-mode is described in more detail below. In the second 30-min mode (Flux mode), the instrument was used only in the JMS mode to measure selectedm/zat a rate fast enough for EC flux calculations. In Flux mode there was a 1-min background measurement followed by 29 min of ambient measurement. This approach to splitting each hour yields particle size data and ensem-ble mass spectra of aerosol composition during one 30-min period, and fast measurements at selectedm/z suitable for flux calculations in the second 30-min period. During MILA-GRO, the ions selected for the PToF and JMS mode analyses were:m/z9 (for quantification of drifts on DC level of the signal);m/z28 for the airbeam (N+2, used to track instrument sensitivity variations);m/z30 and 46 for nitrate (representing
mostly NO+and NO+
2 );m/z48 and 64 for sulfate (mostly SO+and SO+2); andm/z31, 43, 55 and 57 for organic species (Jayne et al., 2000). The dominance of the inorganic ions at the nitrate and sulfate masses during MILAGRO was verified by Aiken et al. (2009) (see Fig. S18 in that paper).
2.4 Estimation of organic components using Positive Matrix Factorization (PMF)
studies in Mexico City (Aiken et al., 2009; Dzepina et al., 2009; DeCarlo et al., 2010; Ulbrich et al., 2012).
2.5 Eddy covariance flux calculations and system validation
The fundamentals of flux dynamics and measurements of fine aerosol and gaseous species are essentially identical in the at-mospheric surface layer. While there are differences for very large particles in terms of settling and differences in transport at the laminar sub-layer, these differences do not affect atmo-spheric surface layer flux measurements and calculations for fine aerosols. The raw fluxes (Fm/z) for 10 selected aerosol m/z(see Section 2.3) were calculated using the standard EC method as the cross product of the instantaneous deviation of the vertical wind velocity (w′) and the instantaneous de-viation of each mass concentration (χm/z′ ) from their 30-min means (McMillen, 1988):
Fm/z=w′χm/z′ =
1
N N X
i=1
w′(ti)χm/z′ (ti) (1)
The same method was employed to calculate energy and gas fluxes measured at this site (Velasco et al., 2009, 2011) and during a previous Mexico City study at a different site (Ve-lasco et al., 2005a, b).
The method to calculate the fluxes of aerosol compo-nents (nitrates, sulfates and organics), using only a few
m/z scanned in the flux mode was developed by Nemitz et al. (2008). After the raw equivalent mass concentrations (χm/z) (Zhang et al., 2005) and raw fluxes (Fm/z) of the
individual masses were calculated, the exchange velocity
Vexm/z=Fm/z/χm/zwas determined for eachm/z.The
com-parison of the Vexm/z calculated for different m/z derived
from the same compound (e.g.,m/z48 and 64 for SO24−) pro-vides a strong quality control. Because the Q-AMS measures only a singlem/zat a time, the differentVexm/zreflect
differ-ent particle populations and the comparison of relatedVexm/z
provides information on the uncertainty associated with par-ticle statistics. Above Mexico City there was a very strong correlation between relatedVexm/z(Fig. S3). The sulfate and
nitrate aerosol fluxes were then calculated using the total sul-fate and nitrate concentration obtained from the MS mode and the subsequent periodVexm/z from JMS mode.
Ammo-nium fluxes typically cannot be determined with the Q-AMS due to high noise from the interference of HxO+ions at the samem/z, and require the use of the high resolution AMS (Farmer et al., 2011).
The determination of fluxes of the organic components is more complex because different organic aerosol components can contribute to the signal for an individualm/z. These frac-tional contributions are estimated from the PMF analyses. In terms of aerosol fluxes, the flux of eachm/z(Fm/z) reflects a
linear combination of the fluxes of the different OA
compo-nents (Fi, wherei= HOA, OOA and BBOA):
Fm/z= X
m/z
am/z,i·Fi (2)
Here,am/z,iis the fraction of a component’s total signal
rep-resented by a particular m/z. Equation (2) can be inverted to provide a unique solution for threeFi (i.e.FHOA,FOOA, andFBBOA) from the measured fluxes of three differentm/z (Fm/z) (Nemitz et al., 2008). In this study, the factors are
de-rived from the ambient scan mode while fluxes are calculated from the flux jump mode. This approach assumes that the mass spectra of the concentration components are also rep-resentative of the flux components. In this analysis, we used fourm/zin a linear best-fit approach to determine the three organic aerosol factors, where them/zused were 31, 43, 55 and 57.
To summarize, the fractional contributions of eachm/zto each organic component were obtained by PMF using the 30-min concentration measurement mode. The fluxes of in-dividual organic mass elements were obtained from eddy co-variance analyses using the flux mode data. The fractional contributions and the individual mass fluxes were used in a least-squared residual minimization of Eq. (2) to yield the final organic flux components for HOA, OOA, and BBOA. Because of the m/z selected for flux mode measurements, decomposition of OOA fluxes into the volatility components was not included.
The remainder of the flux data reduction method was based on the approach described by Velasco et al. (2005a, b, 2009). During data reduction, raw data with low AMS sam-ple flow rates were discarded; in total twelve 30-min peri-ods were discarded, most of them on 14 March. Hard spikes and soft spikes in the sonic anemometer data were eliminated (Schmid et al., 2000). Hard spikes are random electronic spikes caused by a blocked path between a sonic anemometer sensor pair (e.g., from precipitation) and are flagged during the measurements (Vickers and Mahrt, 1997). About 0.05 % of data points were removed from the data as hard spikes, ap-proximately 10 points per period. Soft spikes are large short-lived departures from the 30-min period means; soft spikes were removed during post processing using a series of filters corresponding to 3.6, 3.9, and 4.2 times the standard devi-ation (Højstrup, 1993). About 1 % of data points were re-moved as soft spikes.
fluctuations were applied (Webb et al., 1980) and a high fre-quency correction was applied to account for high frefre-quency losses during transport down the sampling line. The WPL correction was insignificant, less than 0.1 %.
To evaluate the overall operation of the system, (co)spectral analyses were conducted, and the flux data were evaluated in terms of meteorological stationarity. The spec-tral and co-specspec-tral analyses are important as the EC sys-tem tends to attenuate the true turbulent signal at high and low frequencies due to physical size limitations of the in-struments, the instrument separation distances, and their time response and signal processing (Massman and Lee, 2002). The spectra showed a good agreement (slope approximately −5/3) for the temperature and the measured aerosol mass concentrations. Power co-spectra of instantaneous deviation of mass fluxes were also calculated (see example m/z43, Fig. S4 in the Supplement). The co-spectral analysis showed a good agreement with previously reported results from Ne-mitz et al. (2008).
As described by Aubinet et al. (2000), a stationarity test helps to identify non-valid sampling periods affected by the short-term horizontal advection produced by local plumes or rapidly changing wind or stability conditions. The test was applied by examining the difference between the 30-min av-eraged flux and the average of six 5-min average fluxes mea-sured in Flux mode. Each period was accepted if the two av-erages were within 60 % of each other (Aubinet et al., 2000). 25 % of the periods were excluded from the analysis based on this test (Fig. S5 in the Supplement).
It should be noted that with a single point flux measure-ment, errors due to storage and advection could not be quan-tified during this study. Moreover, the flux measurement can-not distinguish between primary emissions, chemical pro-duction, and condensation below the measurement height (for upward fluxes), or between deposition and evaporation below the measurement height (for downward fluxes). All fluxes reported here should therefore be considered local fluxes at the measurement height.
A footprint area indicates the size of the area that measured flux originates from. A source footprint analysis was per-formed using a simple footprint model (Hsieh et al., 2000). This model is a one-dimensional Lagrangian stochastic dis-persion model, based on Gaussian turbulence. The footprint area that accounted for 80 % of the measured aerosol flux ex-tended from approximately 0.8 to 1.9 km (Fig. 1). The foot-print of our measurements includes most of the major roads, highways, and intersections in the immediate area. Thus, our measurements appear to be representative of this heav-ily populated residential and commercial district of Mexico City.
3 Results and discussion
3.1 Meteorological conditions and aerosol concentrations
The dry season for central Mexico is from January until June. The MILAGRO field campaign was conducted during March to target dry, mostly sunny conditions representative of the dry season (Yokelson et al., 2007; Molina et al., 2010). Me-teorological conditions during the measurement period were averaged to 30 min and are presented in Fig. 2. Temperatures were in the range of 15 to 30◦C, except in the last week when
conditions cooled and several rainy days occurred. Wind speeds were low at night and in the range of 2 to 6 m s−1 during the daytime hours.
These meteorological conditions led to changes in wildfire intensity around Mexico City during March 2006. Aiken et al. (2010) divided the campaign into three distinct fire peri-ods: 11–15, 17–23 and 24–29 March. The number of fires was high during the first and second periods and low during the third period (Fig. S2). Aiken et al. (2010) showed that at theT0site, a MILAGRO urban supersite located about 10 km north of the SIMAT flux tower (see Fig. 1 for location), non-fire related gas and particle species showed little change be-tween the three periods, while levels of fire-related species were much lower during the 3rd period, compared with the first two periods. In general, the fire activity during March 2006 was about twice as high as the climatological average (Molina et al., 2010).
Time series of the 2.5-min average concentrations of chlo-ride, ammonium, nitrate, sulfate, and organic aerosols in non-refractory micron particles measured in the MS sub-mode are shown in Fig. 3 (for the statistics of the aerosol species, see Table 1). The time series of the aerosol con-centrations show some similarities among different aerosol species. For example, peak concentrations among ammo-nium, nitrate, total organic aerosol (OA), and OOA occurred during 16 March and again several times during the last week of the measurement period. In the latter period, these peaks were also reflected by peaks in the CO2and HOA concentra-tions.
Fig. 3.Time series of CO2mixing ratio (ξCO2) (right axis) and mass concentrations (χ) of AMS non-refractory inorganic and organic aerosols (OA) components (left axes). Total non-refractory PM1aerosols (black). Inorganic aerosols: chloride (Cl−) (pink), sulfate (SO24−) (red), ammonium (NH+4) (orange), and nitrate (NO−3) (blue). Organic aerosols (OA) (green), hydrocarbon-like (HOA) (grey), oxygenated (OOA) (dark green), and biomass-burning (BBOA) (brown).
nitrate and OOA suggest photochemical processing of the ur-ban air mass (Salcedo et al., 2006; Volkamer et al., 2006; Zheng et al., 2008; Paredes-Miranda et al., 2009). This is supported by the time lag in the diurnal peaks between NO at 07:00 and NO2at 10:00 followed by the nitrate aerosol con-centration peak at 13:30. Similarly, a 6-h time lag was present between the concentrations of olefins and OOA. We found a high correlation between the concentrations of nitrate and ammonium aerosols and OOA (R=0.86). Similarly, Aiken et al. (2009) reported a good correlation (R=0.71) between OOA and nitrate aerosol concentrations, following diurnal patterns of CO, CO2and NO and consistent with the simi-lar atmospheric processing and formation rates of both OOA and nitrate aerosol (Dzepina et al., 2009). The sharp peak for HOA, coinciding with rush hours, reflects fresh, local emis-sions which is similar to the pattern for CO2(R=0.90) as-sociated with mobile and other urban activities (Velasco et al., 2009). The more constant concentrations of sulfate and BBOA suggest broad urban or regional air mass impacts, al-though there is some indication of a morning peak for sulfate that occurs after the rush hour peak in HOA, but before the mid-day peak in nitrate.
Based on the knowledge of different fire activity during the measurement period, the diurnal averages of aerosol con-centration data for two week periods were calculated for: (1) high fire activity (12–17 March); and (2) low fire activity dur-ing the wetter cooler week (24–30 March). The diurnal
pro-Table 1.Concentration measurement statistics of urban aerosols. All the components in the table have µg m−3units and were com-puted from 2605 (2.5 min average) data points sampled during MS mode.
Concentration Average Minimum Maximum Standard deviation
Nitrate 13 0.4 101 15 Sulfate 10 2.6 33 4.2 Ammonium 6 1.4 31 4.3 Chloride 0.6 0 9.7 0.8 OA 46 7.9 142 25 HOA 13 0 102 13 OOA 24 4.3 91 14 BBOA 9 0 69 11 PM1 AMS 76 45 263 12
Fig. 4.Average diurnal patterns of ambient mixing ratios of trace gases and mass concentrations of AMS non-refractory submicron inorganic and organic aerosol components measured during the entire study. Bars indicate one standard deviation.(a)NO−3, NO, and NO2,(b)NH+4,
(c)Cl−,(d)SO42−(e)CO2and HOA,(f)OOA and olefins,(g)BBOA during the dry week 12–17 March (thin solid line), wet week 24–30 March (thin broken line), and both weeks (brown line), and(h)OA (green line) and total non-refractory PM1aerosols (black line).
night and during the very early morning, which could reflect nocturnal transport of biomass emissions into the central part of the city (Aiken et al., 2010). The overall elevated back-ground concentrations indicate the regional origin of most BBOA during 12–18 March, consistent with wildfires being the dominant sources.
For the broad mid-day maximum pattern, average diurnal cycles peaked at 38 µg m−3for nitrate, 12 µg m−3for ammo-nium, and 45 µg m−3for OOA. For HOA, the morning peak, presumably due to the morning rush hour, was 28 µg m−3and for Cl−, the peak was less than 2 µg m−3. Sulfate levels aver-aged 10 µg m−3with a late morning peak of 12 µg m−3, while BBOA averaged about 17 µg m−3 during the high fire pe-riod with nighttime maximum levels of 25 µg m−3and much lower average concentrations of 4.6 µg m−3and late morning peak of 8.5 µg m−3during the low fire activity week.
Inorganic aerosol concentrations were larger at the SIMAT flux tower site, but followed similar diurnal variations as ob-served at theT0site (Aiken et al., 2009). In particular, nitrate and ammonium aerosol concentrations were larger by a fac-tor of two at the tower site compared toT0. This is attributed to higher concentrations of precursors (NH3and NOx) at the
central urban tower location, and the very rapid production of HNO3observed in Mexico City (Zheng et al., 2008). The concentrations of sulfate aerosols were essentially constant and similar at both sites, consistent with the regional charac-ter of this species (Salcedo et al., 2006; DeCarlo et al., 2008). The average relative aerosol composition derived with the Q-AMS at SIMAT (Fig. S6) confirmed that submicron sulfate at SIMAT and PM2.5sulfate atT0were occupying the same fraction.
Overall, the OA components at the SIMAT flux tower cor-relate well with components obtained from a three-factor PMF solution of the High-Resolution Time-of-Flight AMS measurements atT0(Aiken et al., 2009, see their Fig. 3). Our findings can also be compared with Teflon filter samples col-lected during consecutive 8-hour periods and analyzed using a Fourier Transform Infrared (FTIR) spectroscopy technique (Gilardoni et al., 2009). Gilardoni et al. (2009) estimated a 33 % to 39 % BBOA contribution to the OA at the SIMAT site using total potassium (K+) concentrations as a tracer.
However, Aiken et al. (2010) showed that total K+ was
strongly influenced by sources other than biomass burn-ing durburn-ing MILAGRO, and estimated that BBOA estimates based on total K+ may be overestimated by about a factor
of two. This supports our findings, which indicate that 19 % of OA was BBOA. Gilardoni et al. (2009) observed organic matter (OM) concentrations of 3–35 µg m−3from filter sam-ples collected at roof level while we measured OA concen-trations in the range of 14-45 µg m−3via the AMS sampling at 25 m above the roof. Similar differences in concentration ranges between the two methods were also observed for sim-ilar measurements at the high altitude Altzomoni site, lo-cated 60 km southeast from Mexico City Metropolitan Area (MCMA). These differences may be due to differences in aerosol size cuts or other differences between the measure-ment methods and the sampling heights.
Wind rose time-of-day analyses showed that stronger winds were prevalent from the southeast during early after-noon and west-northwest during late afterafter-noon and evening hours (Fig. S7). Higher concentrations of nitrate and ammo-nium aerosols were associated with winds from the northeast. HOA concentrations were well distributed, but a few higher readings occurred during northerly winds. High BBOA con-centration events were associated with westerly flows in the direction of a few fires within 15 km (Fig. S2 in the Supple-ment) during the fire periods. Small increases in OOA and sulfate aerosol concentrations occurred during periods with winds from the northwest and northeast.
To summarize, nitrate aerosol concentrations averaged ap-proximately 13 µg m−3 and ammonium aerosol concentra-tions averaged 6 µg m−3and both exhibited strong mid-day maxima. Sulfate aerosol concentrations averaged approxi-mately 10 µg m−3, but showed little diurnal pattern compared to the other aerosol components. Organic aerosol concen-trations averaged approximately 46 µg m−3 and were com-prised of HOA (27 %), OOA (53 %), and BBOA (20 %). HOA aerosol concentrations showed a sharp maximum dur-ing morndur-ing rush hour, while OOA aerosol concentrations showed a mid-day maximum. BBOA displayed different di-urnal trends depending on wildfire activity. During the week of high fire activity the BBOA levels were four times higher, with elevated nighttime concentrations compared to concen-tration levels measured during the low fire period when the concentration followed anthropogenic activity patterns.
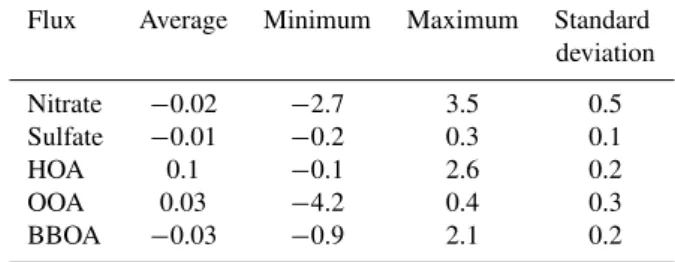
Table 2. Flux measurement statistics of urban aerosols. All the components in the table have µg m−2s−1units and were computed from 170 (30 min average) data points sampled during JMS and MS mode.
Flux Average Minimum Maximum Standard deviation
Nitrate −0.02 −2.7 3.5 0.5 Sulfate −0.01 −0.2 0.3 0.1
HOA 0.1 −0.1 2.6 0.2
OOA 0.03 −4.2 0.4 0.3
BBOA −0.03 −0.9 2.1 0.2
3.2 Aerosol fluxes
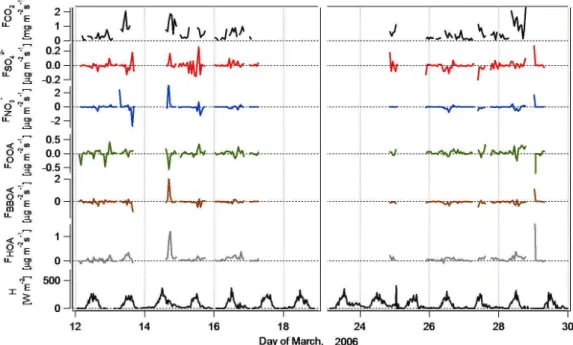
Fluxes of submicron aerosol chemical components were highly variable during the measurement period. Figure 5 shows the time series of fluxes of sulfate, nitrate, and OA components (OOA, HOA, and BBOA), along with the fluxes of CO2and sensible heat. Diurnal-averaged profiles of chem-ically resolved aerosol fluxes and CO2are presented in Fig. 6, with bars indicating the standard deviation (for the statistics of the aerosol species, see Table 2).
Fig. 5.Fluxes (F) of CO2, sulfate aerosols (SO24−), nitrate aerosols (NO−3), organic aerosol components (OOA, BBOA, and HOA), and sensible heat (H) fluxes during the campaign.
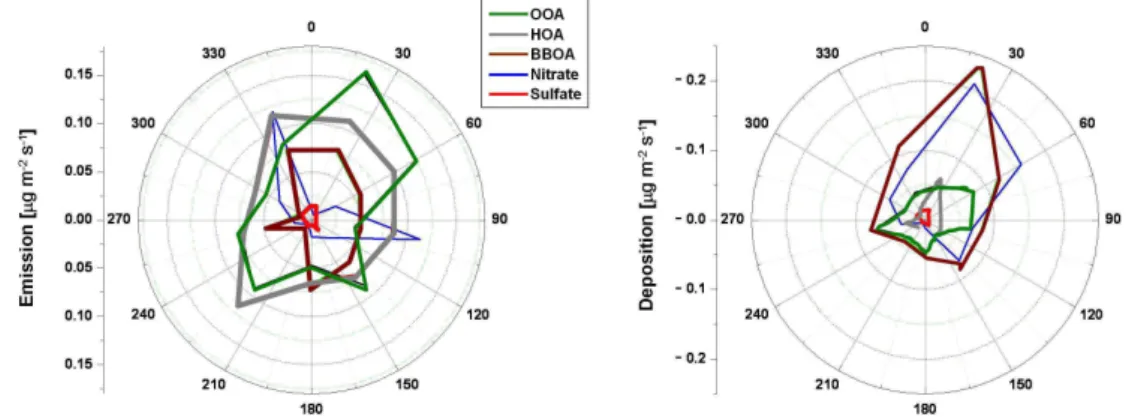
Fig. 7.Magnitude of nitrate, sulfate, and organic aerosol component fluxes as a function of the upwind direction.
of BBOA during this period was probably wildfires outside of Mexico City (Aiken et al., 2010; DeCarlo et al., 2010). Notably, while the trend and concentrations of BBOA were significantly different during the two high-fire activity pe-riods, the BBOA fluxes did not display much difference in diurnal trends between these two periods. During the field campaign, deposition of BBOA was observed during the day at about−0.16 µg m−2s−1. This is the first time that BBOA fluxes have been identified in isolation in an urban AMS flux study. Average nitrate fluxes were small over Edinburgh and Manchester, while significant upward fluxes were observed at the higher measurement heights in Gothenburg (in win-ter) and London (in autumn) with large day-to-day variability (Thomas, 2007). In contrast, above Mexico City, significant downward fluxes of nitrate were observed, with a maximum deposition in the average diurnal cycle of−0.3 µg m−2s−1. The causes of the observed deposition may be due to atmo-spheric dynamics associated with mixing of urban scale ni-trate downward into the warmer urban canopy where it can be volatilized or scavenged. The net drivers for volatiliza-tion are the gradients of the concentravolatiliza-tions of precursor gases in equilibrium with NH4NO3(i.e., NH3and HNO3) and the gradients in temperature and relative humidity, which deter-mine the equilibrium vapor pressures of the gas-phase pre-cursors. It appears that in Mexico City, NH4NO3evaporation below the measurement height contributed to the downward fluxes. This could be driven by temperature gradients associ-ated with sensible heat fluxes (Figs. 2 and 5) that were larger than those in the European cities. However, further gradient profile and flux measurements of NH3and HNO3would be required to confirm this.
Previous studies from MILAGRO have established that the urban area is the dominant source of nitrate, while the forest fires are a very minor source (DeCarlo et al., 2008). Both the BBOA and nitrate aerosols displayed a small positive emis-sion flux during late afternoon (indicative of formation below the measurement height being proportionally more important during those periods). However, due to the high day-to-day variability in the BBOA flux, it implies that these evening
emissions were likely isolated events, possibly attributed to cooking. Evening nitrate emissions were present during most of the evenings.
Approximately 80 % of HOA, 60 % of OOA, and 30 % of individual BBOA flux data points were positive (Fig. S8 in the Supplement). Overall, during the campaign, 47 % of the apparent organic emissions were HOA, 35 % were OOA, and 18 % were BBOA. The deposition of organic particulate ma-terial was strongly dominated by the BBOA (54 %).
Depending on their sign, fluxes were separated into emis-sions or deposition. Figure 7 shows the magnitude of sul-fate, nitrate and organic aerosol component fluxes as a func-tion of the upwind direcfunc-tion. This type of analysis must be interpreted with care, due to the strong correlation of wind direction with time of the day. Sulfate aerosol fluxes, both emission and deposition, were small and independent of wind direction. Spikes in nitrate emission were observed only with the flows from northwest and east directions, and these spikes occurred during instances of high wind speed during the campaign (Fig. 5). This could suggest that some spikes are storage/venting events associated with changes in concentrations related to changes in air mass. BBOA fluxes were evenly distributed for winds from the east, but showed more variability for west winds (night and early morning wind flows) (Fig. S9 in the Supplement). HOA emissions had the most uniform distribution independent of the wind direction, with peaks correlated with winds from the south-west, where the intersection of a few major highways was located. OOA emissions occurred in a spatial pattern similar to HOA emissions, while deposition of nitrate, BBOA and OOA aerosols were predominately associated with northeast-erly flows (Fig. 7).
3.3 Evaluation of the local gridded emissions inventory of PM2.5
is based on bottom-up methods and emission factors, which were either measured locally or taken from the literature. It covers the entire metropolitan area in cells of 1 km2, with hourly mass emissions of PM2.5 and other pollutants from mobile, area, and point sources, using 2006 base data (SMA-GDF, 2008). The inventory accounts for primary particles such as black carbon (BC), primary organic aerosol (POA), dust, and metals, but does not provide speciated information. Our comparison between the EC fluxes and the local emis-sion inventory is thus complicated by the imperfect overlap between the AMS measurements and the emission inven-tory with respect to particle size cut-off (PM1vs. PM2.5) and the chemical components tracked (HOA vs. total particulate mass). To make a comparison, we first estimated the fraction of the inventory due to PM1emissions (80 % of PM2.5) and second, we assumed the contribution of black carbon (BC) was 75 % of the measured HOA flux. Querol et al. (2008) estimated that about 80 % of PM2.5consists of PM1 atT0, while Moya et al. (2011) reached the same conclusion for the T1 suburban site during MILAGRO, as did Salcedo et al. (2006) for a different urban site in a previous study. Aiken et al. (2009) reported that BC was approximately 75 % of the HOA contribution (see their Figure 5a) and, thus, we esti-mate BC as 75 % of our measured HOA fluxes. With these two assumptions, we can compare our measured PM1fluxes of HOA plus the derived BC emission with the derived PM1 mass emissions from the inventory. The use of the measured fluxes may lead to an underestimate of the real emissions, as the deposition of some of the airborne material may partially cancel the local emissions, resulting in a smaller local net flux.
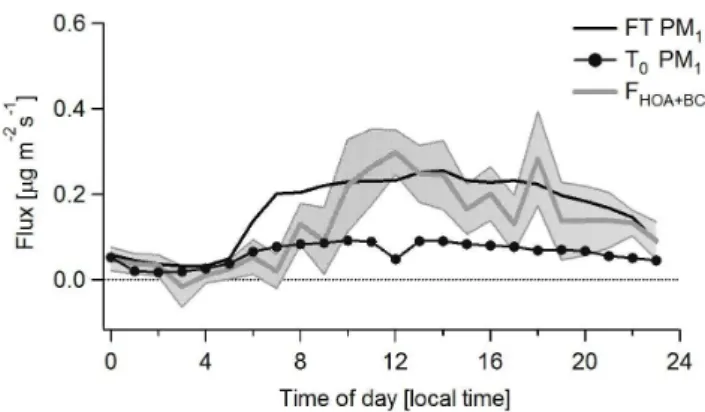
Figure 8 shows the daily averaged profiles of the sum of measured HOA fluxes and estimated BC fluxes, and com-pares those with the estimated PM1emissions from the emis-sions inventory for the grid cells corresponding to the ob-served footprint at the SIMAT flux tower andT0 sites. The gray-shaded area indicates the standard deviation-based up-per and lower limits for the measured data. Overall, the mass emission rates for the flux measurements (including esti-mated BC) are in good agreement with the emission rate for the area around the tower in the emission inventory. The estimated PM1 emissions from the emissions inven-tory for the monitored footprint yield an average emission of 0.16 µg m−2s−1, compared to the observed average PM
1 fluxes of 0.15 µg m−2s−1. However, it is important to recog-nize that the inventory emission rate includes dust and metal contributions, and thus it appears that the inventory underes-timates the emissions of organic and black carbon aerosols as derived from the flux measurements. The degree to which this underestimate occurs cannot be determined from this comparison. Further, the temporal pattern in the inventory shows a sharp increase in emissions early in the morning, missing in our flux measurements, which suggests that the temporal profile used in the inventory overestimates the tim-ing and magnitude of early morntim-ing emissions.
Fig. 8.Comparison of the diurnal profiles of non-refractory PM1 fluxes (HOA+BC) of primary aerosols (grey solid line, shaded area is±one standard deviation) with the diurnal profiles of PM1 emis-sions extracted and estimated from the 2006 official emisemis-sions in-ventory for the monitored footprint at the SIMAT flux tower site (black solid line) and theT0supersite (black solid line with mark-ers). PM1emissions were estimated as 80 % of PM2.5.
Aiken et al. (2009) using measured ratios of PM2.5to CO at the T0 site concluded that the inventory was low by as much as a factor of four, and Zavala et al. (2009) also found that the emission factors used for inventories were too low based on their on-road measurements. Our results also sug-gest that the inventory is low, although we cannot estimate the degree of this error from our results.
4 Conclusions
As part of the Megacity Initiative: Local and Global Re-search Observations (MILAGRO) 2006 field campaign, we measured the fluxes (positive emission fluxes and nega-tive deposition fluxes) of organic and inorganic submicron aerosol chemical components using an eddy-covariance sys-tem based on an Aerosol Mass Spectrometer (AMS). The findings were compared with the official emissions inventory for the year 2006. These results are the first measured aerosol component mass fluxes for an arid, subtropical megacity. With the increasing number of megacities throughout the world, it is becoming increasingly necessary to character-ize the particulate emissions in densely populated urban ar-eas. This work demonstrates a powerful approach to directly quantify the near-surface fluxes of an important subset of par-ticulate emissions- non-refractory PM1. While incomplete in terms of the range of PM species measured, this approach could provide a useful validation for the emissions invento-ries that are being implemented for these developing megac-ities.
hydrocarbon-like organic aerosol (HOA) in the center of Mexico City follows the diurnal patterns of CO2, suggest-ing vehicular traffic as the main emission source. Secondary organic aerosol, identified by the AMS as oxidized organic aerosol (OOA), also showed net emission, suggesting that OOA formation below the measurement height due to pho-tochemical processing exceeded the deposition from SOA formed aloft and the regional background. Overall, 47 % of organic emissions are HOA, 35 % are OOA, and 18 % are BBOA. BBOA deposition to the urban canopy occurs during the mid-day and the source of these aerosols was found to be associated with the wildfire activity surround-ing Mexico City, based on concentration trends dursurround-ing the high fire activity period. Recurring nitrate aerosol emissions were observed only during evening rush hours with peak lev-els of 0.4 µg m−2s−1. Otherwise, nitrate deposition was ob-served, possibly reflecting NH4NO3evaporation in the warm urban canopy. This has not been observed in more north-ern cities where similar flux measurements have been com-pleted. Comparison of the subset of the particulate Mexico City 2006 emissions inventory for the SIMAT flux tower site showed that the average fluxes of HOA and estimated BC were essentially the same as the estimated PM1 portion of the emission inventory. Since the inventory includes dust and metals while the observations do not, this quantitative match suggests that the inventory may in fact be underestimating the total PM emissions. These results may be biased due to the short length of the measurement period, and apply only for the measurement location.
Supplementary material related to this article is
available online at: http://www.atmos-chem-phys.net/12/ 7809/2012/acp-12-7809-2012-supplement.pdf.
Acknowledgements. The Quadrupole Aerosol Mass Spectrometer
was provided through a grant from the Environmental Molecular Sciences Laboratory (EMSL), a national scientific user facility sponsored by the Department of Energy’s Office of Biological and Environmental Research located at Pacific Northwest National Laboratory. Funding for the field program and data analysis was provided by the US National Science Foundation (ATM-0528227), including Research Experience for Undergraduate funds. Ingrid M. Ulbrich and Jose L. Jimenez (University of Colorado, Boulder, CO) were supported by DOE (BER/ASR Program DE-SC0006035). The contribution from Eiko Nemitz was funded by the UK Natural Environment Research Council (NERC) through the grants “CityFlux” and “DIASPORA”. The assistance and logistical support provided by the Atmospheric Monitoring System of the Federal District Government (SIMAT) was instrumental for the successful completion of this study.
Edited by: A. Baklanov
References
Aiken, A. C., Salcedo, D., Cubison, M. J., Huffman, J. A., DeCarlo, P. F., Ulbrich, I. M., Docherty, K. S., Sueper, D., Kimmel, J. R., Worsnop, D. R., Trimborn, A., Northway, M., Stone, E. A., Schauer, J. J., Volkamer, R. M., Fortner, E., de Foy, B., Wang, J., Laskin, A., Shutthanandan, V., Zheng, J., Zhang, R., Gaffney, J., Marley, N. A., Paredes-Miranda, G., Arnott, W. P., Molina, L. T., Sosa, G., and Jimenez, J. L.: Mexico City aerosol analysis during MILAGRO using high resolution aerosol mass spectrom-etry at the urban supersite (T0) – Part 1: Fine particle composi-tion and organic source apporcomposi-tionment, Atmos. Chem. Phys., 9, 6633–6653, doi:10.5194/acp-9-6633-2009, 2009.
Aiken, A. C., de Foy, B., Wiedinmyer, C., DeCarlo, P. F., Ulbrich, I. M., Wehrli, M. N., Szidat, S., Prevot, A. S. H., Noda, J., Wacker, L., Volkamer, R., Fortner, E., Wang, J., Laskin, A., Shutthanan-dan, V., Zheng, J., Zhang, R., Paredes-Miranda, G., Arnott, W. P., Molina, L. T., Sosa, G., Querol, X., and Jimenez, J. L.: Mex-ico city aerosol analysis during MILAGRO using high resolu-tion aerosol mass spectrometry at the urban supersite (T0) – Part 2: Analysis of the biomass burning contribution and the non-fossil carbon fraction, Atmos. Chem. Phys., 10, 5315–5341, doi:10.5194/acp-10-5315-2010, 2010.
Allan, J. D., Coe, H., Bower, K. N., Alfarra, M. R., Delia, A. E., Jimenez, J. L., Middlebrook, A. M., Drewnick, F., Onasch, T. B., Canagaratna, M. R., Jayne, J. T., and Worsnop, D. R.: Tech-nical note: Extraction of chemically resolved mass spectra from Aerodyne aerosol mass spectrometer data, J. Aerosol Sci., 35, 909–922, 2004.
Allan, J. D., Williams, P. I., Morgan, W. T., Martin, C. L., Flynn, M. J., Lee, J., Nemitz, E., Phillips, G. J., Gallagher, M. W., and Coe, H.: Contributions from transport, solid fuel burning and cook-ing to primary organic aerosols in two UK cities, Atmos. Chem. Phys., 10, 647–668, doi:10.5194/acp-10-647-2010, 2010. Aubinet, M., Grelle, A., Ibrom, A., Rannik, U., Moncrieff, J.,
Fo-ken, T., Kowalski, A. S., Martin, P. H., Berbigier, P., Bernhofer, C., Clement, R., Elbers, J., Granier, A., Grunwald, T., Morgen-stern, K., Pilegaard, K., Rebmann, C., Snijders, W., Valentini, R., and Vesala, T.: Estimates of the Annual Net Carbon and Wa-ter Exchange of Forests: The EUROFLUX Methodology, Adv. Ecol. Res., 30, 113–175, 2000.
Canagaratna, M. R., Jayne, J. T., Jimenez, J. L., Allan, J. D., Al-farra, M. R., Zhang, Q., Onasch, T. B., Drewnick, F., Coe, H., Middlebrook, A. M., Delia, A. E., Williams, L. R., Trimborn, A. M., Northway, M. J., DeCarlo, P. F., Kolb, C. E., Davidovits, P., and Worsnop, D. R.: Chemical and Microphysical Character-ization of Ambient Aerosols with the Aerodyne Aerosol Mass Spectrometer, Mass Spectrom. Rev., 26, 185–222, 2007. Cappa, C. D. and Jimenez, J. L.: Quantitative Estimates of the
Volatility of Ambient Organic Aerosol, Atmos. Chem. Phys., 10, 5409–5424, doi:10.5194/acp-10-5409-2010, 2010.
Crosier, J., Jimenez, J. L., Allan, J. D., Bower, K. N., Williams, P. I., Alfarra, M. R., Canagaratna, M. R., Jayne, J. T., Worsnop, D. R., and Coe, H.: Technical Note: Description and use of the new Jump Mass Spectrum mode of operation for the Aerodyne Quadrupole Aerosol Mass Spectrometers (Q-AMS), Aerosol Sci. Technol., 41, 865–872, 2007.
Wein-heimer, A., Campos, T., and Jimenez, J. L.: Fast airborne aerosol size and chemistry measurements above Mexico City and Central Mexico during the MILAGRO campaign, Atmos. Chem. Phys., 4027–4048, doi:10.5194/acp-8-4027-2008, 2008.
DeCarlo, P. F., Ulbrich, I. M., Crounse, J., de Foy, B., Dunlea, E. J., Aiken, A. C., Knapp, D., Weinheimer, A. J., Campos, T., Wennberg, P. O., and Jimenez, J. L.: Investigation of the sources and processing of organic aerosol over the Central Mex-ican Plateau from aircraft measurements during MILAGRO, At-mos. Chem. Phys., 10, 5257–5280, doi:10.5194/acp-10-5257-2010, 2010.
Dorsey, J. R., Nemitz, E. G., Gallagher, M. W., Fowler, D., Williams, P. I., Bower, K. N., and Beswick, K. M.: Direct mea-surements and parameterisation of aerosol flux, concentration and emission velocity above a city, Atmos. Environ., 36 791– 800, 2002.
Dzepina, K., Volkamer, R. M., Madronich, S., Tulet, P., Ulbrich, I. M., Zhang, Q., Cappa, C. D., Ziemann, P. J., and Jimenez, J. L.: Evaluation of recently-proposed secondary organic aerosol models for a case study in Mexico City, Atmos. Chem. Phys., 9, 5681–5709, doi:10.5194/acp-9-5681-2009, 2009.
Farmer, D. K., Matsunaga, A., Docherty, K. S., Surratt, J. D., Se-infeld, J. H., Ziemann, P. J., and Jimenez, J. L.: Response of an Aerosol Mass Spectrometer to Organonitrates and Organosul-fates and implications for Atmospheric Chemistry, Proc. Natl. Acad. Sci. USA, 107, 6670–6675, 2010.
Farmer, D. K., Kimmel, J. R., Phillips, G., Docherty, K. S., Worsnop, D. R., Sueper, D., Nemitz, E., and Jimenez, J. L.: Eddy covariance measurements with high-resolution time-of-flight aerosol mass spectrometry: a new approach to chemi-cally resolved aerosol fluxes, Atmos. Meas. Tech., 4, 1275–1289, doi:10.5194/amt-4-1275-2011, 2011.
Fast, J. D., de Foy, B., Acevedo Rosas, F., Caetano, E., Carmichael, G., Emmons, L., McKenna, D., Mena, M., Skamarock, W., Tie, X., Coulter, R. L., Barnard, J. C., Wiedinmyer, C., and Madronich, S.: A meteorological overview of the MILA-GRO field campaigns, Atmos. Chem. Phys., 7, 2233–2257, doi:10.5194/acp-7-2233-2007, 2007.
Forster, P., Ramaswamy, V., Artaxo, P., Berntsen, T., Betts, R., Fa-hey, D. W., Haywood, J., Lean, J., Lowe, D. C., Myhre, G., Nganga, J., Prinn, R., Raga, G., Schulz, M., and Van Dorland, R.: Changes in Atmospheric Constituents and in Radiative Forc-ing, in: “Climate Change 2007: The Physical Science Basis. Con-tribution of Working Group I to the Fourth Assessment Report of the Intergovernmental Panel on Climate Change”, Cambridge University Press, Cambridge, UK and New York, NY, USA, 2007.
Gilardoni, S., Liu, S., Takahama, S., Russell, L. M., Allan, J. D., Steinbrecher, R., Jimenez, J. L., De Carlo, P. F., Dunlea, E. J., and Baumgardner, D.: Characterization of organic ambient aerosol during MIRAGE 2006 on three platforms, Atmos. Chem. Phys., 9, 5417–5432, doi:10.5194/acp-9-5417-2009, 2009.
Heintzenberg, J.: Fine Particles in the Global Troposphere: A Re-view, Tellus B, 41, 149–160, 1989.
Højstrup, J.: A statistical data screening procedure, Meas. Sci. Tech-nol., 4, 153–157, 1993.
Hsieh, C. I., Katul, G., and Chi, T.: An approximate analytical model for footprint estimation of scalar fluxes in thermally strat-ified atmospheric flows, Adv. Water Resour., 23, 765–772, 2000.
Jayne, J. T., Leard, D. C., Zhang, X. F., Davidovits, P., Smith, K. A., Kolb, C. E., and Worsnop, D. R.: Development of an aerosol mass spectrometer for size and composition analysis of submi-cron particles, Aerosol Sci. Technol., 33, 49–70, 2000.
Jimenez, J. L., Jayne, J. T., Shi, Q., Kolb, C. E., Worsnop, D. R., Yourshaw, I., Seinfeld, J. H., Flagan, R. C., Zhang, X., Smith, K. A., Morris, J., and Davidovits, P.: Ambient Aerosol Sampling with an Aerosol Mass Spectrometer, J. Geophys. Res.-Atmos., 108, 8425, doi:10.1029/2001JD001213, 2003.
Jimenez, J. L., Canagaratna, M. R., Donahue, N. M., Prevot, A. S., Zhang, Q., Kroll, J. H., DeCarlo, P. F., Allan, J. D., Coe, H., Ng, N. L., Aiken, A. C., Docherty, K. S., Ulbrich, I. M., Grieshop, A. P., Robinson, A. L., Duplissy, J., Smith, J. D., Wilson, K. R., Lanz, V. A., Hueglin, C., Sun, Y. L., Tian, J., Laaksonen, A., Raatikainen, T., Rautiainen, J., Vaattovaara, P., Ehn, M., Kul-mala, M., Tomlinson, J. M., Collins, D. R., Cubison, M. J., Dun-lea, E. J., Huffman, J. A., Onasch, T. B., Alfarra, M. R., Williams, P. I., Bower, K., Kondo, Y., Schneider, J., Drewnick, F., Bor-rmann, S., Weimer, S., Demerjian, K., Salcedo, D., Cottrell, L., Griffin, R., Takami, A., Miyoshi, T., Hatakeyama, S., Shimono, A., Sun, J. Y., Zhang, Y. M., Dzepina, K., Kimmel, J. R., Sueper, D., Jayne, J. T., Herndon, S. C., Trimborn, A. M., Williams, L. R., Wood, E. C., Middlebrook, A. M., Kolb, C. E., Baltensperger, U., and Worsnop, D. R.: Evolution of organic aerosols in the at-mosphere, Science, 326, 1525–1529, 2009.
Lawrence, M. G., Butler, T. M., Steinkamp, J., Gurjar, B. R., and Lelieveld, J.: Regional pollution potentials of megacities and other major population centers, Atmos. Chem. Phys., 7, 3969– 3987, doi:10.5194/acp-7-3969-2007, 2007.
Massman, W. J. and Lee, X.: Eddy covariance flux corrections and uncertainties in long-term studies of carbon and energy ex-changes, Agr. Forest Meteorol., 113, 121–144, 2002.
McMillen, R.: An eddy correlation technique with extended appli-cability to non-simple terrain, Bound.-Layer Meteorol., 43, 231– 245, 1988.
Molina, L. T., Madronich, S., Gaffney, J. S., Apel, E., de Foy, B., Fast, J., Ferrare, R., Herndon, S., Jimenez, J. L., Lamb, B., Osornio-Vargas, A. R., Russell, P., Schauer, J. J., Stevens, P. S., Volkamer, R., and Zavala, M.: An overview of the MILA-GRO 2006 Campaign: Mexico City emissions and their trans-port and transformation, Atmos. Chem. Phys., 10, 8697–8760, doi:10.5194/acp-10-8697-2010, 2010.
Moya, M., Madronich, S., Retama, A., Weber, R., Baumann, K., Nenes, A., Castillejos, M., and Ponce de Le´on, C.: Identification of chemistry-dependent artifacts on gravimetric PM fine read-ings at the T1 site during the MILAGRO field campaign, Atmos. Environ., 45, 244–252, 2011.
Nemitz, E., Jimenez, J. L., Huffman, J. A., Canagaratna, M. R., Worsnop, D. R., and Guenther, A. B.: An eddy-covariance sys-tem for the measurement of surface/atmosphere exchange fluxes of submicron aerosol chemical species – first application above an urban area, Aerosol Sci. Technol., 42, 636–657, 2008. Ng, N. L., Canagaratna, M. R., Zhang, Q., Jimenez, J. L., Tian,
4641, doi:10.5194/acp-10-4625-2010, 2010.
Ng, N. L., Canagaratna, M. R., Jimenez, J. L., Zhang, Q., Ulbrich, I. M., and Worsnop, D. R.: Real-Time Methods for Estimating Organic Component Mass Concentrations from Aerosol Mass Spectrometer Data, Environ. Sci. Technol., 45, 910–916, 2011. Paatero, P.: Least squares formulation of robust non-negative factor
analysis, Chemometr. Int. Lab. Syst., 37, 23–35, 1997.
Paatero, P.: User’s guide for positive matrix factorization programs PMF2.EXE and PMF3.EXE. University of Helsinki, Finland, 2007.
Paatero, P. and Tapper, U.: Positive matrix factorization – a nonneg-ative factor model with optimal utilization of error-estimates of data values, Environmetrics, 5, 111–126, 1994.
Paredes-Miranda, G., Arnott, W. P., Jimenez, J. L., Aiken, A. C., Gaffney, J. S., and Marley, N. A.: Primary and secondary contri-butions to aerosol light scattering and absorption in Mexico City during the MILAGRO 2006 campaign, Atmos. Chem. Phys., 9, 3721–3730, doi:10.5194/acp-9-3721-2009, 2009.
Pope III, C. A. and Dockery, D. W.: Health effects of fine particulate air pollution: lines that connect, J. Air Waste Manage. Assoc., 56, 709–742, 2006.
Querol, X., Pey, J., Minguill´on, M. C., P´erez, N., Alastuey, A., Viana, M., Moreno, T., Bernab´e, R. M., Blanco, S., C´ardenas, B., Vega, E., Sosa, G., Escalona, S., Ruiz, H., and Art´ı˜nano, B.: PM speciation and sources in Mexico during the MILAGRO-2006 Campaign, Atmos. Chem. Phys., 8, 111–128, doi:10.5194/acp-8-111-2008, 2008.
Salcedo, D., Onasch, T. B., Dzepina, K., Canagaratna, M. R., Zhang, Q., Huffman, J. A., DeCarlo, P. F., Jayne, J. T., Mor-timer, P., Worsnop, D. R., Kolb, C. E., Johnson, K. S., Zuberi, B., Marr, L. C., Volkamer, R., Molina, L. T., Molina, M. J., Car-denas, B., Bernab´e, R. M., M´arquez, C., Gaffney, J. S., Marley, N. A., Laskin, A., Shutthanandan, V., Xie, Y., Brune, W., Lesher, R., Shirley, T., and Jimenez, J. L.: Characterization of ambient aerosols in Mexico City during the MCMA-2003 campaign with Aerosol Mass Spectrometry: results from the CENICA Supersite, Atmos. Chem. Phys., 6, 925–946, doi:10.5194/acp-6-925-2006, 2006.
Schmid, H. P., Grimmond, C. S. B., Cropley, F., Offerle, B., and Su, H. B.: Measurements of CO2 and energy fluxes over a mixed hardwood forest in the mid-western United States, Agr. Forest Meteorol., 103, 357–3774, 2000.
SMA-GDF: (Secretar´ıa del Medio Ambiente, Gobierno del Distrito Federal). Programa de Acci´on Clim´atica de la Ciudad de M´exico 2008–2012, 2008.
Stewart, I. D. and Oke, T. R.: Thermal differentiation of local cli-mate zones using temperature observations from urban and rural field sites, Symposium on Urban Environment, Keystone, CO, USA, 2010,
Thomas, R. M.: Measurement of speciated aerosol fluxes, Ph.D. the-sis, Ph.D., University of Manchester, Manchester, UK, 2007. Ulbrich, I. M., Canagaratna, M. R., Cubison, M. J., Zhang, Q., Ng,
N. L., Aiken, A. C., and Jimenez, J. L.: Three-dimensional factor-ization of size-resolved organic aerosol mass spectra from Mex-ico City, Atmos. Meas. Tech., 5, 195–224, doi:10.5194/amt-5-195-2012, 2012.
Ulbrich, I. M., Canagaratna, M. R., Zhang, Q., Worsnop, D. R., and Jimenez, J. L.: Interpretation of organic components from Posi-tive Matrix Factorization of aerosol mass spectrometric data,
At-mos. Chem. Phys., 9, 2891–2918, doi:10.5194/acp-9-2891-2009, 2009.
United Nations, Department of Economic and Social Affairs, Pop-ulation Division: World Urbanization Prospects, the 2009 Revi-sion: Press Release, New York, USA, 2010.
Velasco, E., Lamb, B., Pressley, S., Allwine, E., Westberg, H., Jobson, B. T., Alexander, M., Prazeller, P., Molina, L. T., and Molina, M.: Flux measurements of volatile organic compounds from an urban landscape, Geophys. Res. Lett., 32, L20802,, doi:10.1029/2005GL023356, 2005a.
Velasco, E., Pressley, S., Allwine, E., Westberg, H., and Lamb, B.: Measurements of CO2fluxes from the Mexico City urban land-scape, Atmos. Environ., 39, 7433–7446, 2005b.
Velasco, E., Pressley, S., Grivicke, R., Allwine, E., Coons, T., Fos-ter, W., Jobson, B. T., Westberg, H., Ramos, R., Hern´andez, F., Molina, L. T., and Lamb, B.: Eddy covariance flux measurements of pollutant gases in urban Mexico City, Atmos. Chem. Phys., 9, 7325–7342, doi:10.5194/acp-9-7325-2009, 2009.
Velasco, E., Pressley, S., Allwine, E., Grivicke, R., Molina, L. T., and Lamb, B.: Energy balance in urban Mexico City: ob-servation and parameterization during the MILAGRO/MCMA-2006 field campaign, Theor. Appl. Climatol., 103, 501–517, doi:10.1007/s00704-010-0314-7, 2011.
Vickers, D., and Mahrt, L.: Quality control and flux sampling prob-lems for tower and aircraft data., J. Atmos. Ocean. Technol., 14, 512–526, 1997.
Vogt, M., Nilsson, E. D., Ahlm, L., M˚artensson, E. M., and Jo-hansson, C.: The relationship between 0.25–2.5 µm aerosol and CO2emissions over a city, Atmos. Chem. Phys., 11, 4851–4859, doi:10.5194/acp-11-4851-2011, 2011.
Volkamer, R., Jimenez, J. L., San Martini, F., Dzepina, K., Zhang, Q., Salcedo, D., Molina, L. T., Worsnop, D. R., and Molina, M. J.: Secondary Organic Aerosol Formation from Anthropogenic Air Pollution: Rapid and Higher than Expected, Geophys. Res. Lett., 33, L17811, doi:10.1029/2006GL026899, 2006.
Webb, E. K., Pearman, G. I., and Leuning, R.: Correction of the Flux Measurements for Density Effects Due to Heat and Water Vapour Transfer, Q. J. Roy. Meteorol. Soc., 106, 85–100, 1980. Yokelson, R. J., Urbanski, S. P., Atlas, E. L., Toohey, D. W.,
Al-varado, E. C., Crounse, J. D., Wennberg, P. O., Fisher, M. E., Wold, C. E., Campos, T. L., Adachi, K., Buseck, P. R., and Hao, W. M.: Emissions from forest fires near Mexico City, At-mos. Chem. Phys., 7, 5569–5584, doi:10.5194/acp-7-5569-2007, 2007.
Zhang, Q., Alfarra, M. R., Worsnop, D. R., Allan, J. D., Coe, H., Canagaratna, M. R., and Jimenez, J. L.: Deconvolution and quan-tification of hydrocarbon-like and oxygenated organic aerosols based on aerosol mass spectrometry, Environ. Sci. Technol., 39, 4938–4952, 2005.