www.atmos-chem-phys.net/16/7043/2016/ doi:10.5194/acp-16-7043-2016
© Author(s) 2016. CC Attribution 3.0 License.
Profiling of aerosol microphysical properties at several
EARLINET/AERONET sites during the July 2012
ChArMEx/EMEP campaign
María José Granados-Muñoz1,2,a, Francisco Navas-Guzmán3, Juan Luis Guerrero-Rascado1,2, Juan Antonio Bravo-Aranda1,2, Ioannis Binietoglou4, Sergio Nepomuceno Pereira5, Sara Basart6, José María Baldasano6, Livio Belegante4, Anatoli Chaikovsky7, Adolfo Comerón8, Giuseppe D’Amico9,
Oleg Dubovik10, Luka Ilic11, Panos Kokkalis12, Constantino Muñoz-Porcar8, Slobodan Nickovic11,13, Doina Nicolae4, Francisco José Olmo1,2, Alexander Papayannis12, Gelsomina Pappalardo9, Alejandro Rodríguez8,
Kerstin Schepanski14, Michaël Sicard8,15, Ana Vukovic16,13, Ulla Wandinger14, François Dulac17, and Lucas Alados-Arboledas1,2
1Dpt. Applied Physics, Faculty of Sciences, University of Granada, Fuentenueva s/n, 18071, Granada, Spain
2Andalusian Institute for Earth System Research (IISTA-CEAMA), Avda. del Mediterráneo s/n, 18006, Granada, Spain 3Institute of Applied Physics (IAP), University of Bern, Bern, Switzerland
4National Institute of R&D for Optoelectronics, Magurele, Ilfov, Romania
5Departamento de Física, ECT, Instituto de Ciências da Terra, IIFA, Universidade de Évora, Évora, Portugal 6Earth Sciences Department, Barcelona Supercomputing Center-Centro Nacional de Supercomputación, BSC-CNS, Barcelona, Spain
7Institute of Physics, National Academy of Sciences of Belarus, Minsk, Belarus
8Dept. of Signal Theory and Communications, Remote Sensing Lab. (RSLab), Universitat Politècnica de Catalunya, Barcelona, Spain
9Consiglio Nazionale delle Ricerche – Istituto di Metodologie per l Analisi Ambientale (CNR-IMAA), Potenza, Italy 10Laboratoire d’Optique Atmospherique, CNRS Universite de Lille 1, Bat P5 Cite scientifique, 59655,
Villeneuve d’Ascq Cedex, France
11Institute of Physics, University of Belgrade, Belgrade, Serbia
12National Technical University of Athens, Physics Department, Laser Remote Sensing Laboratory, Zografou, Greece 13South East European Virtual Climate Change Center, Republic Hydrometeorological Service, Belgrade, Serbia 14Leibniz Institute for Tropospheric Research Leipzig, Leipzig, Germany
15Ciències i Tecnologies de l’Espai – Centre de Recerca de l’Aeronàutica i de l’Espai/Institut d’Estudis Espacials de Catalunya (CTE-CRAE/IEEC), Universitat Politècnica de Catalunya, Barcelona, Spain
16Faculty of Agriculture, University of Belgrade, Belgrade, Serbia
17Laboratoire des Sciences du Climat et de l’Environnement (IPSL-LSCE), CEA-CNRS-UVSQ, CEA Saclay, Gif-sur-Yvette, France
acurrently at: Table Mountain Facility, NASA/Jet Propulsion Laboratory, California Institute of Technology, Wrightwood, California, USA
Correspondence to:María José Granados Muñoz ([email protected])
Abstract.The simultaneous analysis of aerosol microphysi-cal properties profiles at different European stations is made in the framework of the ChArMEx/EMEP 2012 field paign (9–11 July 2012). During and in support of this cam-paign, five lidar ground-based stations (Athens, Barcelona, Bucharest, Évora, and Granada) performed 72 h of continu-ous lidar measurements and collocated and coincident sun-photometer measurements. Therefore it was possible to re-trieve volume concentration profiles with the Lidar Radiome-ter Inversion Code (LIRIC). Results indicated the presence of a mineral dust plume affecting the western Mediterranean region (mainly the Granada station), whereas a different aerosol plume was observed over the Balkans area. LIRIC profiles showed a predominance of coarse spheroid parti-cles above Granada, as expected for mineral dust, and an aerosol plume composed mainly of fine and coarse spheri-cal particles above Athens and Bucharest. Due to the excep-tional characteristics of the ChArMEx database, the analy-sis of the microphysical properties profiles’ temporal evolu-tion was also possible. An in-depth analysis was performed mainly at the Granada station because of the availability of continuous lidar measurements and frequent AERONET version retrievals. The analysis at Granada was of special in-terest since the station was affected by mineral dust during the complete analyzed period. LIRIC was found to be a very useful tool for performing continuous monitoring of min-eral dust, allowing for the analysis of the dynamics of the dust event in the vertical and temporal coordinates. Results obtained here illustrate the importance of having collocated and simultaneous advanced lidar and sun-photometer mea-surements in order to characterize the aerosol microphysical properties in both the vertical and temporal coordinates at a regional scale. In addition, this study revealed that the use of the depolarization information as input in LIRIC in the sta-tions of Bucharest, Évora, and Granada was crucial for the characterization of the aerosol types and their distribution in the vertical column, whereas in stations lacking depolariza-tion lidar channels, ancillary informadepolariza-tion was needed. Re-sults obtained were also used for the validation of different mineral dust models. In general, the models better forecast the vertical distribution of the mineral dust than the column-integrated mass concentration, which was underestimated in most of the cases.
1 Introduction
The influence of the atmospheric aerosol particles on the Earth’s radiative forcing is still affected by a large uncer-tainty, as indicated in the AR5 report from the Intergovern-mental Panel for Climate Change (IPCC, 2013). During past years, this uncertainty has been reduced from high to medium with respect to the data in the Fourth Assessment Report (AR4) of the IPCC (2007). However, atmospheric aerosol
still contribute to the largest uncertainty to the total radiative forcing estimate, even though the level of confidence in the effects of atmospheric aerosols has increased from low and medium to medium and high (for indirect and direct effects, respectively) (IPCC, 2013).
The difficulty in accurately determining atmospheric aerosol properties and their influence on the Earth’s radia-tive forcing lies in their large spatial and temporal variabil-ity. Ground-based (active and passive) remote sensing tech-niques have proven to be quite robust and provide accurate results for atmospheric aerosol characterization (e.g., Naka-jima et al., 1996; Dubovik and King, 2000; Mattis et al., 2004; Olmo et al., 2006). Nonetheless, they provide infor-mation about atmospheric aerosol properties on a local scale. Since regional analyses are highly important when analyz-ing the aerosol variability, several observational networks have been developed, namely, the GALION (Global Atmo-spheric Watch Aerosol Lidar Observation Network) lidar net-work, which includes EARLINET (European Aerosol Re-search Lidar Network, www.earlinet.org) (Bösenberg et al., 2001; Pappalardo et al., 2014), MPLNET (Micro Pulse Li-dar Network) (Welton et al., 2005), LALINET (Latin Ameri-can Lidar Network, www.lalinet.org) (Guerrero-Rascado et al., 2014), and ADNET (Asian Dust Network) (Shimizu et al., 2004) among others, and sun-photometer networks SKYNET (Skyradiometer network) (Takamura and Naka-jima, 2004) and AERONET (Aerosol Robotic Network, http: //aeronet.gsfc.nasa.gov/) (Holben et al., 1998).
In addition to the regional coverage, these networks can provide useful information on the vertical and temporal coor-dinates, if adequate measurement protocols are established. Information on the vertical structure of the aerosol is of high importance, since the atmospheric aerosol effects can be very different near the surface, within the boundary layer, and in the free troposphere. Estimates of radiative forcing are sen-sitive to the vertical distribution of aerosols (Claquin et al., 1998; Huang et al., 2009; Sicard et al., 2015) and the ver-tical information is required for accounting for the indirect effect (McCormick et al., 1993; Bréon, 2006). In addition, atmospheric aerosol can change the vertical profile of tem-perature and atmospheric stability, which in turn influences the wind speed profile within the lower atmosphere (Pérez et al., 2006a, b; Guerrero-Rascado et al., 2009; Choobari et al., 2014). Furthermore, continuous and/or regular mea-surements provided by the networks would allow us to ana-lyze the temporal evolution and dynamics of the atmospheric aerosol particles, which will be very useful not only for accu-rately determining the radiative forcing, but also for improv-ing the performance of numerical weather prediction (NWP) (e.g., Pérez et al., 2006a) and climatological models (Nabat et al., 2014, 2015).
How-ever, the characterization of the microphysical properties profiles is still not so straightforward, due to the complexity of the retrievals. Algorithms designed to combine lidar and sun-photometer measurements have been developed in order to overcome this difficulty, e.g., the LIdar Radiometer Inver-sion Code, LIRIC (Chaikovsky et al., 2008, 2012, 2016), and Generalized Aerosol Retrieval from Radiometer and Lidar Combined data, GARRLIC (Lopatin et al., 2013). The com-bination of simultaneous information about the aerosol ver-tical structure provided by the lidar system and the colum-nar properties provided by the sun photometer has proven to be a promising synergetic tool for this purpose. LIRIC, which is used in this study, has already provided interesting results about vertically resolved aerosol microphysical prop-erties for selected case studies (Tsekeri et al., 2013; Wagner et al., 2013; Granados-Muñoz et al., 2014, 2016; Papayannis et al., 2014; Binietoglou et al., 2015). The increasing num-ber of stations performing these simultaneous measurements foreshadows an optimistic future concerning the increasing spatial coverage.
Regional studies in the Mediterranean region are of huge scientific interest since multiple studies indicate that aerosol radiative forcing over the Mediterranean region is one of the largest in the world (Lelieveld et al., 2002; IPCC, 2013). In this context, the ChArMEx (the Chemistry-Aerosol Mediterranean Experiment, http://charmex.lsce.ipsl.fr/) (Du-lac, 2014) international project involving several Mediter-ranean countries aims at developing and coordinating re-gional research actions for a scientific assessment of the present and future state of the atmospheric environment in the Mediterranean basin, and of its impacts on the re-gional climate, air quality, and marine biogeochemistry. The ChArMEx project organized a field campaign between 25 June and 12 July 2012, in order to address interactions such as long-range transport and air quality, and aerosol vertical structure and sources. The period of the campaign falls within the ACTRIS (Aerosols, Clouds, and Trace Gases Research Infrastructure Network) summer 2012 campaign (8 June–17 July 2012) that aimed at giving support to both the ChArMEx and EMEP (European Monitoring and Evalu-ation Programme) (Espen Yttri et al., 2012) field campaigns. Within the ACTRIS summer 2012 campaign, the European lidar network (EARLINET) (Pappalardo et al., 2014) per-formed a controlled exercise of feasibility to demonstrate its potential to perform operational, coordinated measurements (Sicard et al., 2015). The exercise consisted of continuous li-dar measurements during a 72 h period in July 2012 at dif-ferent European sites. Most of those lidar data have been successfully assimilated by a regional particulate air quality model to improve 36 h operational aerosol forecasts in terms of both surface PM and aerosol optical depth (Wang et al., 2014).
Our study takes advantage of those continuous lidar mea-surements combined with simultaneous sun-photometer data to perform a characterization of the vertical distribution of
the aerosol microphysical properties at different European stations with LIRIC. The temporal evolution of the aerosol microphysical properties is also analyzed when the continu-ity of the inverted data is available. To our knowledge, it is the first time that the LIRIC algorithm has been applied in a continuous and automated way to retrieve simultaneous and continuous data acquired at different stations, proving the al-gorithm’s ability to provide reliable information about micro-physical properties with high spatial and temporal resolution. In addition, this exceptional aerosol observational database is used for the spatio-temporal evaluation of different regional mineral dust models.
2 Measurement strategy
During the summer of 2012, an intensive measurement cam-paign was performed in the framework of ChArMEx and EMEP in the Mediterranean basin at 12 ground-based li-dar stations throughout Europe. The main aim of these mea-surements was to obtain an experimental vertically resolved database for investigating aerosol radiative impacts over the Mediterranean basin using 3-D regional climate models. The extensive lidar database acquired during this campaign com-bined with AERONET regular measurements represents a unique opportunity to evaluate the performance of LIRIC mi-crophysical inversion retrieval during the event in both tem-poral and spatial (horizontal and vertical) coordinates, prov-ing the utility of combined measurements and the potential of the LIRIC algorithm for routine aerosol microphysical prop-erties measurements.
The measurement campaign consisted in 72 h of continu-ous and simultanecontinu-ous lidar measurements performed at 12 European stations, with 11 of them participating in AC-TRIS/EARLINET (Sicard et al., 2015). The measurement period started on 9 July at 06:00 UTC and lasted until 12 July 2012 at 06:00 UTC, coinciding with a forecast min-eral dust event over the Mediterranean basin according to dust transport models.
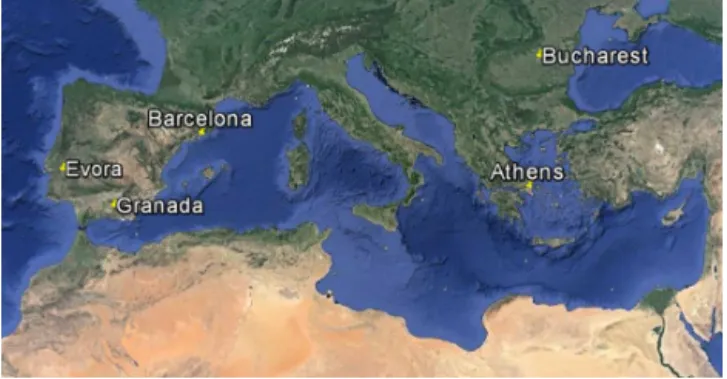
The LIRIC algorithm requires lidar data in at least three different wavelengths and simultaneous AERONET re-trievals in order to obtain the aerosol microphysical proper-ties profiles. Therefore, to evaluate the performance of the LIRIC algorithm and characterize the distribution and tem-poral evolution of the aerosol microphysical properties dur-ing the event, only those stations where multiwavelength lidar data at three wavelengths and AERONET data were available for the period 9–11 July were selected. Those sta-tions were Athens (AT), Barcelona (BA), Bucharest (BU), Évora (EV), and Granada (GR) (Fig. 1). The main character-istics of each station are included in Table 1.
Table 1.Lidar and sun-photometer characteristics for the five stations considered in this study and depicted in Fig. 1. A more detailed description of the experimental sites and the lidar systems in every station can be found in the references included in the “Reference” column of the table.
Lidar characteristics
Site Latitude, longitude
Altitude (m a.s.l.)
Elastic channels (nm) Raman channels (nm)
System name Sun-photometer characteristics channels (nm)
Reference
AT (Athens)
37.97◦N, 23.77◦E
200 355, 532, 1064 387, 407, 607 EOLE 340, 380, 440, 500,
675, 870, 1020, 1640
Kokkalis et al. (2012)
BA (Barcelona)
41.39◦N, 2.17◦E
115 355, 532, 1064 387, 407, 607 UPCLidar 440, 675, 870, 1020 Kumar et al. (2011) BU
(Bucharest)
44.35◦N, 26.03◦E
93 355, 532 parallel, 532 cross, 1064
387, 407, 607 RALI (LR313– D400)
340, 380, 440, 500, 675, 870, 1020
Nemuc et al. (2013) EV (Évora) 38.57◦N,
7.91◦W
293 355, 532, 532 cross, 1064
387, 407, 607 PAOLI 340, 380, 440, 500, 675, 870, 1020, 1640
Preißler et al. (2011)
GR (Granada)
37.16◦N, 3.61◦W
680 355, 532 parallel, 532 cross, 1064
387, 407, 607 MULHACEN (LR321-D400)
340, 380, 440, 500, 675, 870, 1020
Guerrero-Rascado et al. (2009)
Figure 1. Stations where the LIRIC algorithm was applied dur-ing the ChArMEx/EMEP 2012 intensive measurement period on 9–11 July. Source: Google Earth.
least at three different wavelengths (355, 532, and 1064 nm), with the systems in Granada, Bucharest, and Évora including depolarization capabilities at 532 nm (Table 1). Depolariza-tion informaDepolariza-tion can be used in the retrieval of the aerosol microphysical properties profiles with LIRIC to distinguish between coarse spherical and coarse spheroid mode.
Stations are also equipped with collocated standard sun photometers CIMEL CE-318-4, used in the AERONET net-work. The AERONET retrieval algorithm provides atmo-spheric aerosol properties integrated into the atmoatmo-spheric vertical column (Dubovik and King, 2000; Dubovik et al., 2006). The automatic tracking sun and sky scanning ra-diometer makes sun direct measurements with a 1.2◦ full
field of view every 15 min at different nominal wavelengths, depending on the station (Table 1). These solar extinction measurements are used to compute aerosol optical depth (τλ)
at each wavelength except for the 940 nm channel, which is
used to retrieve total column water vapor (or precipitable wa-ter) (Estellés et al., 2006; Pérez-Ramírez et al., 2012). The estimated uncertainty in computedτλ, due primarily to
cali-bration uncertainty, is around 0.01–0.02 for field instruments (which is spectrally dependent, with the larger errors in the UV) (Eck et al., 1999; Estellés et al., 2006).
3 Methodology
3.1 Retrieval of aerosol properties from remote sensing measurements
The analysis of aerosol microphysical properties profiles is performed with the LIRIC algorithm. Details about the LIRIC retrieval algorithm and its physical basics can be found in previous studies (Chaikovsky et al., 2012, 2016; Kokkalis et al., 2013; Wagner et al., 2013; Granados-Muñoz et al., 2014; 2016; Perrone et al., 2014; Binietoglou et al., 2015), but a brief description is included here for complete-ness. LIRIC provides profiles of atmospheric aerosol micro-physical properties from atmospheric aerosol columnar op-tical and microphysical properties retrieved from direct sun and sky radiance measurements from the sun photometer us-ing the AERONET code (version 2, level 1.5) (Dubovik and King, 2000; Dubovik et al., 2006) and measured lidar elastic backscatter signals at three different wavelengths (355, 532, and 1064 nm). If available, the 532 nm cross-polarized sig-nal is also used. Raw lidar data used for this asig-nalysis have been prepared according to the EARLINET Single Calculus Chain (SCC), described in detail in D’Amico et al. (2015). From the combination of all these data, volume concentra-tion profilesCv(zn)are obtained for fine and coarse aerosol
use of the 532 nm cross-polarized lidar channel allows one to distinguish between spherical and non-spherical particles within the coarse fraction of the aerosol. The uncertainty in LIRIC retrievals associated with the input data is not yet well described, but the algorithm has proven to be very stable, and the variations in the output profiles associated with the user-defined input parameters are below 20 % (Granados-Muñoz et al., 2014).
3.2 Model description and validation strategy
Models of dust emission, transport, and deposition are used as a tool to understand the various aspects that control distri-butions and impacts of dust. While global models of the dust cycle are used to investigate dust at large scales and long-term changes, regional dust models are the ideal tool to study in detail the processes that influence dust distribution as well as individual dust events. The analysis of the aerosol micro-physical properties with LIRIC using the ChArMEx compre-hensive database was used here for the evaluation of a set of four regional mineral dust models. This model evaluation was performed for both the vertical and horizontal coordi-nates and the temporal evolution.
Firstly, the spatial distribution of the mineral dust was examined by using the experimental data from the five EARLINET/AERONET sites considered in the present study. Dust optical depth (at 550 nm) provided by four different regional mineral dust models (BSC-DREAM8b, NMMB/BSC-Dust, DREAM8-NMME, and the regional ver-sion of COSMO-MUSCAT) was used at this stage. Experi-mental data were used here just to corroborate the presence or non-presence of mineral dust at the different regions and periods indicated by the models.
The BSC-DREAM8b and DREAM8-NMME models are based on the Dust Regional Atmospheric Model (DREAM) originally developed by Nickovic et al. (2001). The main fea-ture of the updated version of the model, BSC-DREAM8b (version 2), includes an eight-bin size distribution within the 0.1–10 µm radius range according to Tegen and Lacis (1996), radiative feedbacks (Pérez et al., 2006a, b), and upgrades in its source mask (Basart et al., 2012). The BSC-DREAM8b model provides daily dust forecasts at the Barcelona Su-percomputing Center-Centro Nacional de Supercomputación (BSC-CNS, 2016). The model has been extensively evalu-ated against observations (see, e.g., Basart et al., 2012). Re-cently, the DREAM8-NMME model (Vukovic et al., 2014), driven by the NCEP Nonhydrostatic Mesoscale Model on E-grid (Janjic et al., 2001), has provided daily dust forecasts available at the South East European Virtual Climate Change Center (SEEVCCC; http://www.seevccc.rs/).
The NMMB/BSC-Dust model (Pérez et al., 2011; Haustein et al., 2012) is a regional to global dust forecast operational system developed and maintained at BSC-CNS. It is an online multi-scale atmospheric dust model designed and developed at BSC-CNS in collaboration with
NOAA-NCEP, the NASA Goddard Institute for Space Studies, and the International Research Institute for Climate and Soci-ety (IRI). The NMMB/BSC-Dust model includes a phys-ically based dust emission scheme, which explicitly takes into account saltation and sandblasting processes. It includes an eight-bin size distribution and radiative interactions. The NMMB/BSC-Dust model has been evaluated at regional and global scales (Pérez et al., 2011; Haustein et al., 2012; Gama et al., 2015).
The BSC-DREAM8b, NMMB/BSC-DDUST, and DREAM8-NMME models are participating in the World Meteorological Organization Sand and Dust Storm Warning Advisory and Assessment System (WMO SDS-WAS) North-ern Africa-Middle East-Europe (NAMEE) Regional Center (http://sds-was.aemet.es/). Additionally, NMMB/BSC-Dust is the model that provides operational dust forecast in the first Regional Specialized Meteorological Center with activity specialization on Atmospheric Sand and Dust Forecast, the Barcelona Dust Forecast Center (BDFC; http://dust.aemet.es/).
On the other hand, COSMO-MUSCAT is an online cou-pled model system based on a different philosophy: COSMO is a non-hydrostatic and compressible meteorological model that solves the governing equations on the basis of a terrain-following grid (Schättler et al., 2008; Baldauf et al., 2011), whereas MUSCAT is a chemistry transport model that treats the atmospheric transport as well as chemical transforma-tions for several gas-phase species and particle populatransforma-tions using COSMO output data (Knoth and Wolke, 1998; Wolke et al., 2012). More details about the COSMO-MUSCAT model can be found elsewhere (Schepanski et al., 2007, 2009; Heinold et al., 2009; Laurent et al., 2010; Tegen et al., 2013).
The spatial resolution, domain size, and initial and bound-ary conditions differ, in addition to the different physical pa-rameterizations implemented in the models. Details on the individual mineral dust models and their respective model configurations evaluated here are summarized in Table 2.
Table 2.Summary of the main parameters of the mineral dust transport models used in this study.
BSC-DREAM8b NMMB/BSC-Dust
COSMO-MUSCAT
DREAM8-NMME
Institution BSC-CNS BSC-CNS TROPOS SEEVCCC/IPB
Meteorological driver Eta/NCEP NMMB/NCEP COSMO NMME/NCEP
Initial and boundary conditions NCEP/FNL NCEP/FNL GME ECMWF analysis data
in 6 h intervals
Domain 30◦W to 65◦E and
0 to 65◦N
30◦W to 65◦E and 0 to 65◦N
30◦W to 35◦E and 0 to 60◦N
221×251 points,
26◦W, 62◦E, 7, 57◦N
Resolution 0.33◦×0.33◦ 0.33◦×0.33◦ 0.25◦×0.25◦ 0.2◦×0.2◦
Vertical resolution 24 Eta layers 40σ-hybrid layers 41σ-hybrid layers 28 σ-hybrid pressure
levels
Radiation interaction Yes Not activated Yes, online No
Data assimilation No No No No
After this processing, mineral dust mass concentration profiles provided by the BSC-DREAM8b, NMMB/BSC-DUST, DREAM8-NMME, and COSMO-MUSCAT models were evaluated against LIRIC results in those cases when mineral dust was detected. For the comparison, the fine mode was assumed to be fine mineral dust since it is not possible to distinguish which part of the fine mode corresponds to dust or non-dust particles with LIRIC. This assumption may cause an overestimation of the mineral dust concentration that be-comes more important in those cases with high concentra-tions of the fine mode (which was not the case in our study). Alternative methods, such as the POLIPHON (Polarization-lidar photometer networking) method, could be applied to overcome this difficulty (Mamouri and Ansmann, 2014), but this is beyond the scope of our study.
In our study, model output profiles were retrieved every 3 h and compared to LIRIC retrievals during the 3 analyzed days. Only daytime data are presented here (from 06:00 to 18:00 UTC) because of the limitations of LIRIC retrieval dur-ing night-time. Due to the difficulties of the models in cor-rectly representing the convective processes occurring within the planetary boundary layer and PBL-free troposphere in-teractions and the photochemical reactions producing sec-ondary aerosols at the considered resolution, the lowermost parts of LIRIC profiles (affected by these processes) were not considered in the comparison presented here. Only data between 2000 m a.s.l., which is the mean value of the PBL height during summer at Granada (Granados-Muñoz et al., 2012), and the highest value (up to between 5 and 6 km) pro-vided by LIRIC were included in the comparisons.
In order to quantify the model agreement with the total dust load observed in the profiles, the integrated dust mass concentration from the different profiles was obtained by in-tegrating the profiles between 2 km a.s.l. and the highest alti-tude value provided by LIRIC profiles.
The altitude of the center of mass of the dust column (Cm) was also calculated according to Eq. (1), wherezminandzmax are 2 km and the highest altitude value provided by LIRIC,
respectively,
Cm=
Rzmax
zminznCmass(zn)·dzn Rzmax
zmin Cmass(zn)·dzn
. (1)
Additional parameters used in the comparison between LIRIC and the model dust mass concentration profiles are the root mean square error (RMSE), the correlation coeffi-cient (R), the normalized mean bias (NMB), and the normal-ized mean standard deviation (NMSD), defined in Eqs. (2) to (5):
RMSE= r
1 n
X
n
CmassLIRIC(zn)−Cmassmodel(zn) 2
, (2)
R= (3)
P
n(Cmassmodel(zn)−Cmassmodel)(CmassLIRIC(zn)−CmassLIRIC)
q P
n(Cmassmodel(zn)−Cmassmodel)2
q P
n(CmassLIRIC(zn)−CmassLIRIC)2
,
NMB=C model
mass −CmassLIRIC CmassLIRIC
, (4)
NMSD=σmodel−σLIRIC
σLIRIC , (5)
wherenis the number of height levels;Cmass(zn)is the dust
mass concentration at each height levelzn, either for LIRIC
or the models;Cmass are mean values; and σ indicates the standard deviation.
the mass concentration profile temporal evolution of a spe-cific mineral dust event is presented for the first time.
4 Results
During the 72 h intensive measurement period, informa-tion from different models, platforms, and instrumentainforma-tion was available. A detailed characterization of the situation above the Mediterranean basin during the campaign focus-ing on aerosol microphysical properties usfocus-ing the different resources available is presented in Sect. 4.1, followed by the model evaluation in Sect. 4.2.
4.1 Spatial–temporal characterization of aerosol microphysical properties during ChArMEx/EMEP 2012
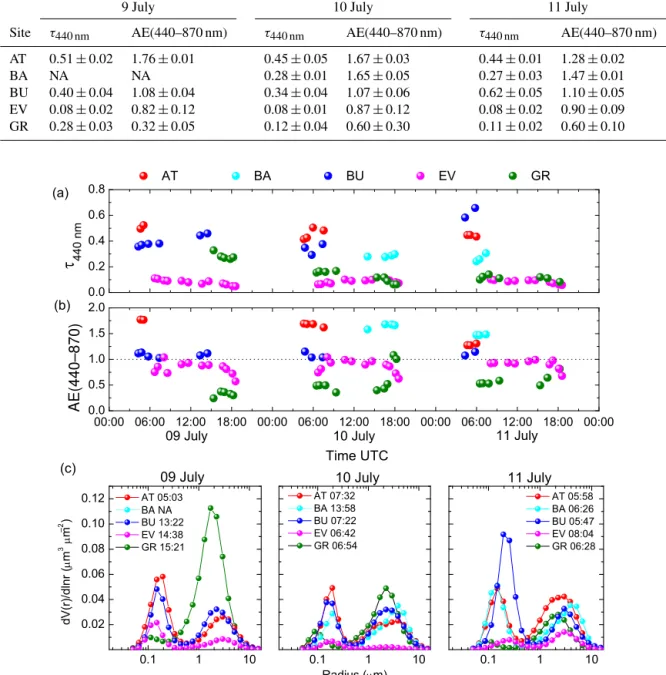
4.1.1 Ground-based column-integrated measurements Column-integrated properties retrieved from the AERONET sun photometer are presented in Fig. 2. Figure 2a and b shows the time series of the τ440 nm and AE(440–880 nm) for the selected five stations during the analyzed period, and mean values for each day and station are indicated in Table 3.
According to these data, the lowest values ofτ440 nmwere measured at the Évora station during the whole period, with values below 0.18. The AE(440–880 nm) was close to 1, ex-cept in the early morning and late evening, when it decreased down to∼0.5. These values, together with the columnar
vol-ume size distributions observed in Fig. 2c, indicate a very low aerosol load, mostly related to aerosol from local sources, and no impact of the northern African aerosol plume fore-cast to arrive at the Iberian Peninsula. A decrease in the τ440 nm value with time was observed at the Granada sta-tion, with maximum values reaching up to 0.40 on 9 July around 16:00 UTC. During 10 and 11 July, τ440 nm values were between 0.10 and 0.20, except for the late afternoon of 10 July from 17:00 UTC, when the aerosol load decreased and τ440 nm below 0.10 were observed. By contrast, values of the AE(440–870 nm) increased from 0.3 on 9 July up to 0.7 on 11 July, with maximum values on the late evening on 10 July (AE(440–870 nm)>1). It is worth noting that the AE(440–870 nm) was below 0.5 during the whole pe-riod except for the late afternoon on 10 July, coinciding with the decrease in τ440 nm, indicating a clear predominance of coarse particles (e.g., Pérez et al., 2006a; Basart et al., 2009; Valenzuela et al., 2014). The columnar volume size distribu-tions for the different days agreed with these data. Data from 9 July show a very large coarse mode and a small contribu-tion of fine particles. The contribucontribu-tion of fine particles was almost constant during the 3 days, whereas the coarse mode was decreasing with time. There was a predominance of the coarse mode during the whole period, with maximum values of 0.13 µm3µm−2during the first day. All these data are usu-ally related to the presence of mineral dust in the station and
the temporal evolution of the analyzed properties clearly sug-gests a decrease in the mineral dust event intensity through-out the analyzed period and a possible mixing or aging of the mineral dust. At the Barcelona station no AERONET data were available on 9 July. During 10 and 11 July,τ440 nm val-ues were relatively high and quite constant (around 0.30) and the AE(440–870 nm) values were larger than 1.5, indicating a strong contribution of fine aerosol particles. In the colum-nar volume size distributions, similar values for the fine and coarse modes were observed on 10 July, but larger values of the fine mode were obtained on 11 July. Therefore, it can be inferred from these data that the impact of the northern African aerosol plume was almost negligible at this station.
In Athens and Bucharest the aerosol plume presented very different characteristics to those observed in the western re-gion (Table 3). In this rere-gion, largeτ440 nm values (>0.35) and large values of the AE(440–870 nm) suggested a situ-ation with high aerosol load mainly composed of fine par-ticles. At Athens bothτ440 nm and AE(440–870 nm) values were very constant during the 3 analyzed days, except for a slight decrease in the AE(440–870 nm) on 11 July (from
∼1.70 to∼1.30). This is in agreement with the columnar
volume size distributions (Fig. 3c), where a slight increase in the coarse mode was observed on 11 July when compared to 9 and 10 July. In the case of Bucharest,τ440 nm was almost constant on 9 and 10 July (around 0.37), but increased on 11 July (over 0.60). The AE(440–870 nm) was almost con-stant around 1.10 during the 3 days, indicating a balanced presence of coarse and fine particles despite the increase in the aerosol load during 11 July. The columnar volume size distributions were very similar to those of Athens on 9 and 10 July, but a larger presence of fine particles was observed here on 11 July. According to these sun-photometer data, the aerosol plume over this region was not composed of min-eral dust particles, even though low concentrations of minmin-eral dust might have been advected over Athens on 11 July.
4.1.2 Aerosol vertical distribution
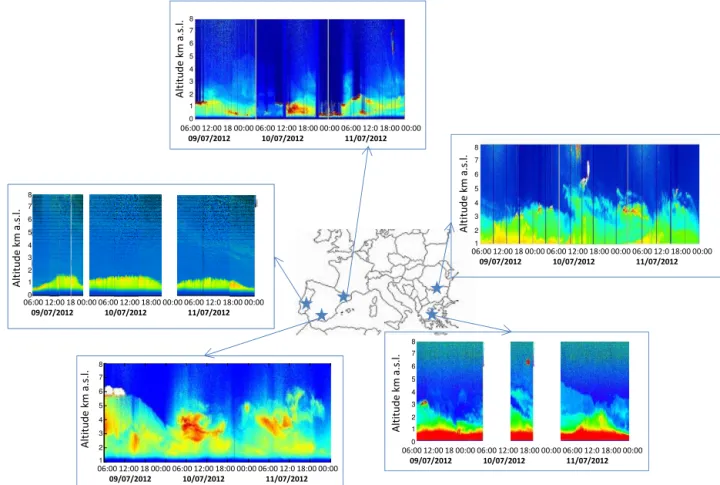
Figure 3 shows the time series of the lidar range-corrected signal (RCS) in arbitrary units at 532 nm (at 1064 nm in Athens) for the 72 h period at the different stations. From these plots, it is clearly observed that at Barcelona and Évora the aerosol load was mainly confined within the planetary boundary layer, and the time series reveal the evolution of the planetary boundary layer height, even though at Barcelona some aerosol layers are observed in the free troposphere. Therefore, it is expected that most of the aerosol particles are of local origin. However, at the rest of the stations a more complex vertical structure was observed and the presence of a lofted aerosol layer reaching up to 6 km a.s.l. at some peri-ods indicated the advection of different aerosol types.
Table 3.τ440 nmand AE(440–870 nm) daily mean values (±standard deviation) at the five stations on 9, 10, and 11 July 2012.
9 July 10 July 11 July
Site τ440 nm AE(440–870 nm) τ440 nm AE(440–870 nm) τ440 nm AE(440–870 nm)
AT 0.51±0.02 1.76±0.01 0.45±0.05 1.67±0.03 0.44±0.01 1.28±0.02
BA NA NA 0.28±0.01 1.65±0.05 0.27±0.03 1.47±0.01
BU 0.40±0.04 1.08±0.04 0.34±0.04 1.07±0.06 0.62±0.05 1.10±0.05
EV 0.08±0.02 0.82±0.12 0.08±0.01 0.87±0.12 0.08±0.02 0.90±0.09
GR 0.28±0.03 0.32±0.05 0.12±0.04 0.60±0.30 0.11±0.02 0.60±0.10
0.0 0.2 0.4 0.6 0.8
00:00 06:00 12:00 18:00 00:00 06:00 12:00 18:00 00:00 06:00 12:00 18:00 00:00 0.0
0.5 1.0 1.5 2.0 (a)
11 July 10 July
440
n
m
(b)
Time UTC
AT BA BU EV GR
AE(440–870)
09 July
0.1 1 10
0.02 0.04 0.06 0.08 0.10 0.12
0.1 1 10 0.1 1 10
d
V
(r
)/
d
ln
r
(
m
3
m
)
2
09 July 10 July 11 July (c))
AT 07:32 BA 13:58 BU 07:22 EV 06:42 GR 06:54
Radius (m) AT 05:03
BU 13:22 EV 14:38 GR 15:21
AT 05:58 BA 06:26 BU 05:47 EV 08:04 GR 06:28
–
BA NA
Figure 2. (a)AERONET level 1.5 retrievedτ440 nmand(b)AE(440–870 nm) during the ChArMEx 2012 campaign at the five stations (see Table 1 for station descriptions).(c)AERONET version 2 level 1.5 size distributions retrieved for 9, 10, and 11 July. NA indicates no data availability.
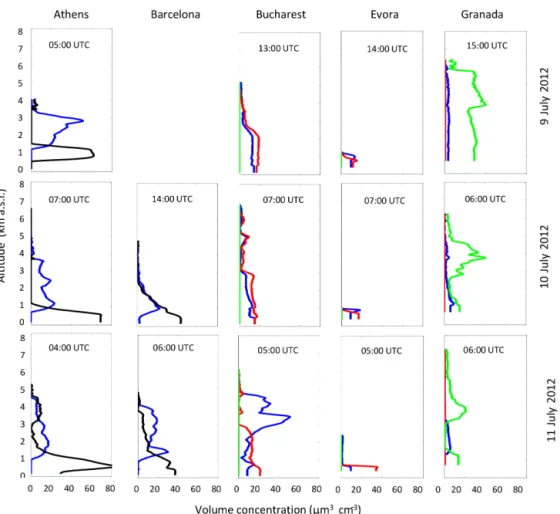
of the total coarse mode and the fine mode were retrieved at Barcelona and Athens, whereas the volume concentration profiles of fine, coarse spherical, and coarse spheroid modes were retrieved at Évora, Bucharest, and Granada because of the availability of depolarization information.
At Évora it was clearly observed that the aerosol was located below 1000 m a.s.l., within the planetary boundary layer, and concentrations were very low, ranging from 25 to 46 µm3cm−3. No advected aerosol layers were observed for
the analyzed period.
At Granada a clear predominance of coarse spheroid parti-cles reaching altitudes around 6000 m a.s.l. was observed on 9 July, related to the mineral dust event. A small contribution of fine particles was also observed during the 3 days. Val-ues of the volume concentration (below 50 µm3cm−3for the
total concentration) indicate a medium intensity dust event, which was considerably decreasing with time. Concentration values around 30 µm3cm−3on 9 July for the coarse spheroid
06:00 12:00 18 00:00 06:00 12:00 18:00 00:00 06:00 12:0 18:00 00:00
09/07/2012 10/07/2012 11/07/2012
06:00 12:00 18 00:00 06:00 12:00 18:00 00:00 06:00 12:0 18:00 00:00
09/07/2012 10/07/2012 11/07/2012
06:00 12:00 18 00:00 06:00 12:00 18:00 00:00 06:00 12:0 18:00 00:00
09/07/2012 10/07/2012 11/07/2012
06:00 12:00 18 00:00 06:00 12:00 18:00 00:00 06:00 12:0 18:00 00:00
09/07/2012 10/07/2012 11/07/2012
Al tit ud e km a.s .l. Al tit ud e km a.s .l. Al tit ud e km a.s .l. Al tit ud e km a. s.l . Altitude km a.s.l. 1 2 3 4 5 6 7 8 1 2 3 4 5 6 7 8 0 1 2 3 4 5 6 7 8 0 1 2 3 4 5 6 7 8 0 1 2 3 4 5 6 7 8
06:00 12:00 18 00:00 06:00 12:00 18:00 00:00 06:00 12:0 18:00 00:00
09/07/2012 10/07/2012 11/07/2012
Figure 3.RCS at 532 nm (1064 nm at Athens) in arbitrary units for the five stations during the ChArMEx 2012 measurement campaign.
of the mineral dust layers was also decreasing from 6000 to 4000 m a.s.l. for the highest layers.
At the Barcelona site, an aerosol layer dominated by fine particles with a slight presence of coarse particles was ob-served between 2000 and 4000 m a.s.l. on 11 July, these coarse particles being possibly related to a faint presence of mineral dust. The 5-day backward trajectory analysis per-formed with the HYSPLIT model (Draxler and Rolph, 2003) (not shown) indicates that air masses arriving at this altitude came from the north of Africa through the Iberian Peninsula. This information, together with previous studies (e.g., Wang et al., 2014), suggests that the mineral dust plume was mov-ing from the north of Africa towards the northeast, bemov-ing de-tected at Granada and later on at Barcelona. However, the possibility of these coarse particles being linked to the pres-ence of biomass burning from the eastern Iberian Peninsula (see Fig. 5) cannot be dismissed. Depolarization information would be crucial here to discriminate the origin of the aerosol particles arriving at this height above Barcelona and would provide very valuable information for the aerosol typing at the station.
At the Athens station the aerosol reached up to 5000 m a.s.l. and total concentration values of up to 55 µm3cm−3in the free troposphere. The coarse mode was
located below 2000 m a.s.l., whereas a predominance of fine particles was observed at higher altitudes. The top of the aerosol layer was increasing with time from 3800 to almost 5000 m a.s.l. This temporal evolution of the microphysical properties is coherent with the optical properties shown in Sicard et al. (2015) for the same period. It is worth point-ing out that on 11 July, coarse particles were detected be-tween 3000 and 4800 m a.s.l. at this station, probably related to the arrival of mineral dust as indicated by the column-integrated values. Backward trajectory analysis with HYS-PLIT (not shown) revealed a change in the trajectory of the air masses arriving at 3500 m a.s.l., coming from northern Africa, which would explain the presence of mineral dust on 11 July. However, according to the trajectories and the different characteristics, the mineral dust observed at Athens corresponds to a different plume than the one observed above Granada and faintly above Barcelona.
Figure 4.Volume concentration profiles of the total coarse mode and the fine mode at Barcelona and Athens, and volume concentration profiles of fine, coarse spherical, and coarse spheroid modes at Évora, Bucharest, and Granada (from left to right) for different periods of 9, 10, and 11 July 2012 (from top to bottom).
Figure 5. MODIS FIRMS image indicating the active fires dur-ing the five previous days to the 11 July 2012. The red line corre-spond to the air-mass 5-day back-trajectory arriving over Bucharest at 3000 m a.s.l. on 11 July 2012.
5000 m a.s.l., with values reaching up to 55 µm3cm−3, sug-gesting the advection of an aerosol plume dominated by fine particles at this altitude. Again, this is in agreement with the optical properties presented in Sicard et al. (2015), where a larger spectral dependence (related to finer particles) is ob-served at Bucharest station in the height range between 3 and 4 km a.s.l. As suggested in the study by Sicard et al. (2015), this large spectral dependence of the backscatter coefficient could have originated in the presence of fine particles related to the advection of smoke. The combined information pro-vided by backward trajectory analysis and MODIS FIRMS comes to confirm the presence of active fires along the air mass paths arriving at Bucharest on 11 July (Fig. 5).
coor--30 -20 -10 0 10 20 20
30 40 50 60 70
-30 -20 -10 0 10 20
20 30 40 50 60 70
-30 -20 -10 0 10 20 20
30 40 50 60 70
-30 -20 -10 0 10 20
20 30 40 50 60 70
1000m 2000m 3000m 4000m 5000m 6000m
09/07/2012 12h
a) b)
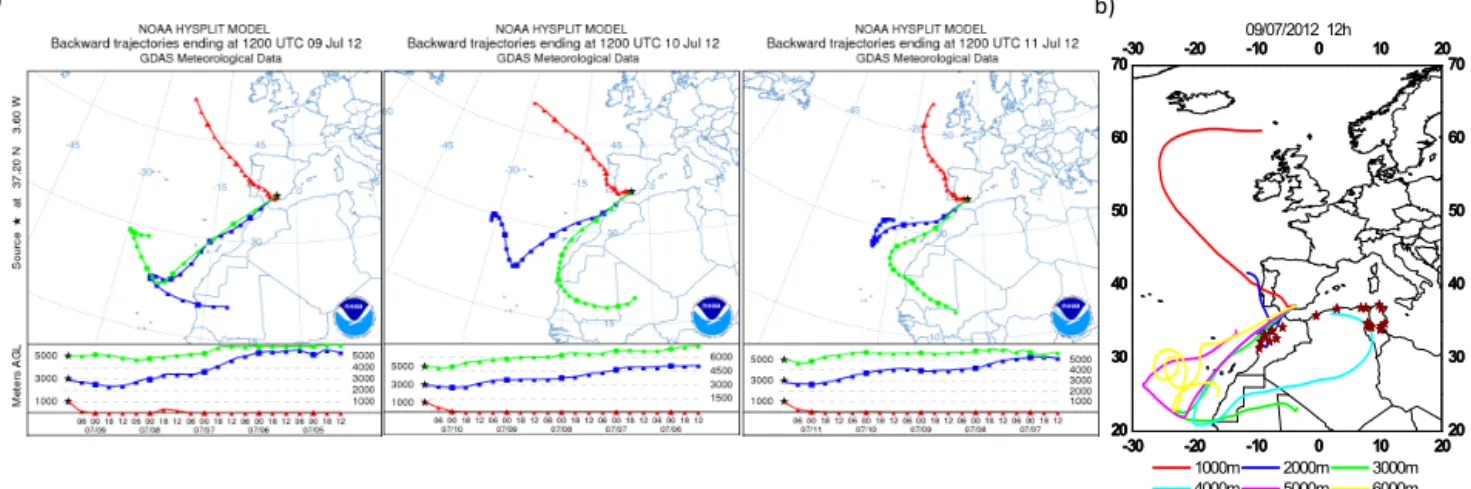
Figure 6. (a)Five-day backward trajectories arriving over Granada on 9, 10, and 11 July 2012 at 12:00 UTC (from left to right) computed by the HYSPLIT model.(b)Locations of the main industrial activity in the north of Africa (brown stars) taken from Rodríguez et al. (2011) together with the 5-day backward trajectories arriving at the Granada experimental site on 9 July 2012 at 12:00 UTC.
dinates. The differences in the aerosol type were already ev-idenced in the columnar volume size distributions retrieved by the AERONET code (Fig. 2), and here LIRIC confirmed that these two stations presented really different situations. The volume concentration profiles retrieved with LIRIC indi-cated a predominance of the spheroid mode in Granada and a predominance of spherical particles in Bucharest, highlight-ing very different aerosol composition in the coarse mode. However, at stations such as Barcelona or Athens where li-dar depolarization was not measured, ancillary information, e.g., backward trajectories or sun-photometer-derived opti-cal properties, was needed to discriminate whether the coarse mode was related to non-spherical particles, usually associ-ated with mineral dust, or with spherical particles, mostly present in cases of anthropogenic pollution or aged smoke. Therefore, here we have a clear example of the impor-tance and the potential of the depolarization measurements in the vertical characterization of the aerosol particles and for aerosol typing.
4.1.3 Temporal evolution of the aerosol microphysical property profiles
The continuous analysis of the aerosol microphysical prop-erties profiles during the 3 days provided very valuable in-formation about the dynamics of the aerosol layers and re-vealed LIRIC’s potential to retrieve information with a high temporal resolution. Because of the uninterrupted lidar mea-surements at Granada from 12:00 UTC on 9 July 2012 to 00:00 UTC on 12 July and the frequent AERONET retrievals due to good weather conditions, a more detailed analysis was performed at this station. A total of 60 different LIRIC re-trievals were performed based on 60 lidar data sets and 21 AERONET inversion products. The retrieval of microphys-ical properties was performed using 30 min averaged lidar
data (in order to reduce noise on the lidar profiles) and the closest in time AERONET retrieval, considering only those data with time differences lower than 3 h.
In addition, the Granada station was affected by a mineral dust event during the whole period as already shown in previ-ous sections. This fact is of special interest since the retrieval of the mineral dust microphysical is not so straightforward, and they are not so well characterized. Up to our knowl-edge not many comprehensive studies on dust microphysical properties vertical profiles have been performed (Tsekeri et al., 2013; Wagner et al., 2013; Granados-Muñoz et al., 2014; Noh, 2014) because of the difficulty of the retrievals due to different factors, e.g., the high temporal variation and non-uniform distribution of dust aerosol concentration around the globe (Sokolik and Toon, 1999; Formenti et al., 2011), min-eral dust’s highly irregular shape, and the chemical and phys-ical transformations dust suffers during its transport (Soko-lik and Toon, 1999; Chen and Penner, 2005; Formenti et al., 2011).
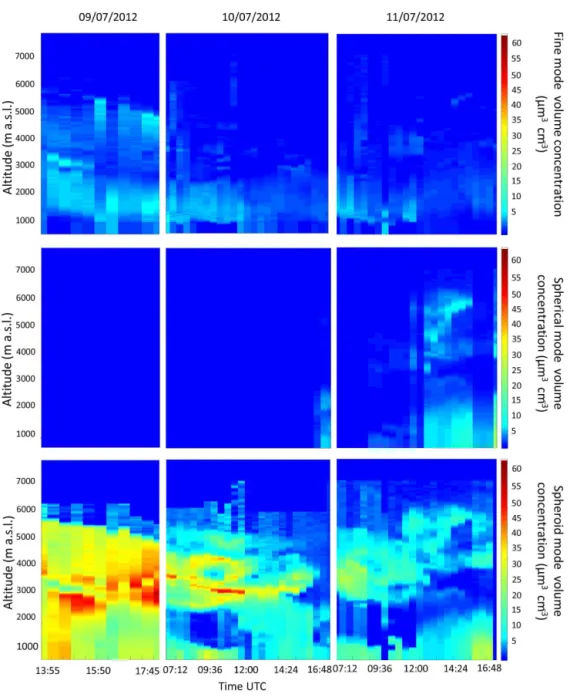
Figure 7.Time series of the volume concentration profiles (in µm3cm−3) for the fine mode (upper part), coarse spherical mode (middle part), and coarse spheroid mode (lower part) for days 9, 10, and 11 July 2012 (from left to right).
Figure 7 shows the time series of the volume concentration profiles retrieved with LIRIC. It is clearly observed that the dust event was decreasing its intensity along the whole study period, with the largest aerosol concentrations for the coarse spheroid mode retrieved on 9 July (∼35 µm3cm−3) and the
lowest concentrations on 11 July (∼15 µm3cm−3), in
agree-ment with AERONET data. Maximum values of total volume concentration were around 60 µm3cm−3 on 9 July. There
was a strong predominance of the coarse spheroid mode dur-ing the whole period, with maximum values on 9 July in the afternoon, reaching values of up to 55 µm3cm−3. Some fine
particles were also observed, with larger volume concentra-tions during the first day (∼10 µm3cm−3). For this first day
and Gomes, 2001). Depolarization lidar observations over the Mediterranean have illustrated that irregularly shaped fine dust particles significantly contribute to aerosol extinc-tion over the boundary layer during dust transport events (Mamouri and Ansmann, 2014). A more detailed analysis with additional data (e.g., chemical components measure-ments, single scattering albedo profiles) would be needed in order to come to a quantitative attribution of soil dust and anthropogenic particles to the fine mode.
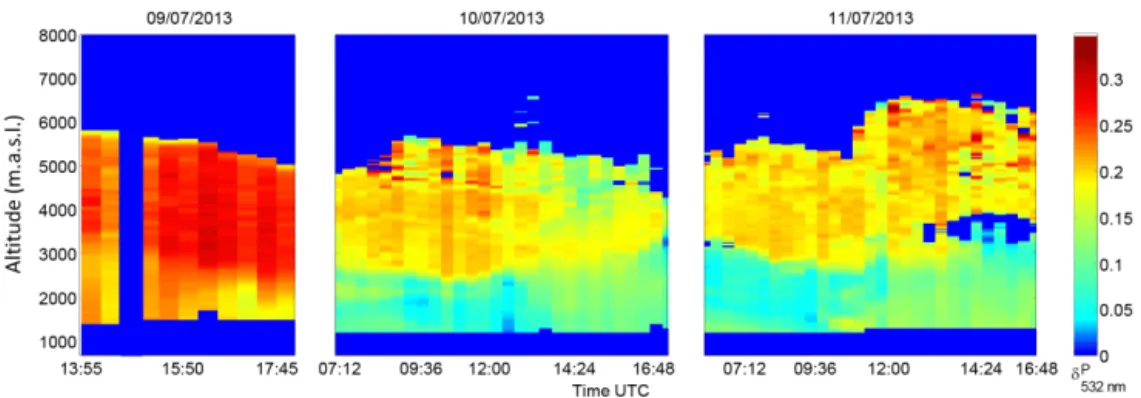
The contribution of the fine mode in the lowermost part may be due mainly to anthropogenic sources of local origin. From 11 July around 12:00 UTC up to the end of the study period, an increase in the coarse spherical mode concentra-tion was observed. This increase in the coarse spherical mode was associated with a decrease in the particle linear depolar-ization profilesδp532 nmobtained from the lidar data according to Bravo-Aranda et al. (2013) as shown in Fig. 8. On 9 July the values ofδ532 nmp were around 0.30 in the layer between 3 and 5 km a.s.l. These values are representative of pure Sa-haran dust (Freudenthaler et al., 2009). However, they de-creased down to 0.25 during the following days, indicating either a possible mixing of dust particles with anthropogenic aerosols or aging processes affecting the mineral dust. Dur-ing 10 July in the late afternoon and 11 July, a decrease in the fine mode coinciding with an increase in the coarse spheri-cal mode was observed. The simultaneous decrease in the fine mode and increase in the coarse spherical particles to-gether with the decrease inδ532 nmp point to processes such as mineral dust aging and/or aggregation processes. However, additional analysis would be necessary to confirm this hy-pothesis.
According to δp532 nm profiles, a mineral dust layer was clearly located above 2500 m a.s.l. or even at higher altitudes depending on the analyzed period (see Fig. 10). Below this altitude, values were lower indicating a mixing of the mineral dust with anthropogenic particles from local origin. In the case of LIRIC, these vertical structures were not so clearly defined, and a more homogeneous structure was detected. Values of the fine and coarse mode volume concentration presented very low variations with height when compared to δp532 nm profiles. This vertical homogeneity is related to the assumption of height independence of properties such as the refractive index, size distribution of the modes, or the sphericity, which according to the results presented in pre-vious studies (Wagner et al., 2013; Granados-Muñoz et al., 2014), is an issue that needs to be carefully considered in the analysis of the results retrieved with the LIRIC algorithm.
Despite the limitations in the use of LIRIC, the analysis presented here shows that LIRIC can reliably provide mi-crophysical property profiles with high vertical and temporal resolution even in cases of mineral dust. The LIRIC algo-rithm can be a useful tool to detect changes in the aerosol composition possibly associated with processes affecting the mineral dust particles such as aging or nucleation, even
though additional information is needed for more in-depth analysis.
4.2 Evaluation of the mineral dust models
In order to obtain a general overview of the dust hori-zontal extension, Fig. 9 shows the standard aerosol optical depth product retrieved using the dark-target approach from MODIS/Terra (Remer et al., 2005, and references therein) and the AERUS-GEO from MSG/SEVIRI (Carrer et al., 2014) for the three analyzed days (9–11 July 2012).
Satellite data showed the presence of an aerosol plume ex-tending from the northern African coast towards the east with a higher aerosol load, asτλvalues from MODIS sensor
indi-cate, mainly affecting the southeast of the Iberian Peninsula and the south of Italy (Fig. 9). As indicated by the data pre-sented in the previous section, this plume corresponds to the mineral dust event, whereas a different plume is observed above the Balkans area. The pathways of the aerosol plumes suggested by satellite data are in agreement with both the meteorological analyses of ECMWF and HYSPLIT air mass trajectories based on GDAS analyzed meteorological fields at 2 km a.g.l. presented in the study by Wang et al. (2014). The air masses were moving from Spain and Portugal to the east, whereas in the Balkans region they were moving south-wards.
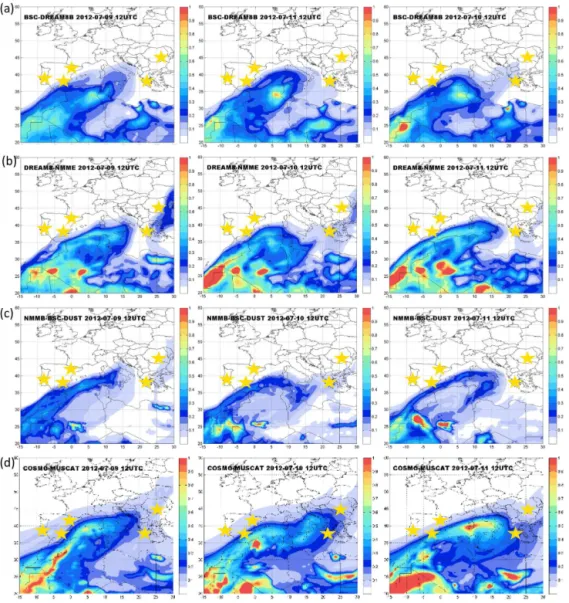
τ550 nm data simulated by BSC-DREAM8b, DREAM8-NMME, NMMB/BSC-Dust, and COSMO-MUSCAT are shown in Fig. 10. In general, when comparing to the satellite data in Fig. 9, the aerosol plume located above the Balkans region is not captured by the models. This is not surprising, since it is not composed of mineral dust particles, as indi-cated by our aerosol volume concentration profiles, shown in the previous section, and suggested in previous studies (e.g., Sicard et al., 2015). The different models correctly forecast the dust plume leaving the north of Africa and moving to-wards the east and the dust plume reaching Athens, as also indicated by satellite data. However, the decrease inτ550 nm values with time observed with satellite data and in LIRIC profiles is not well captured by any of the different mod-els. Regarding the extension of the dust event, in general it is better captured by BSC-DREAM8b and NMMB/BSC-Dust, whereas COSMO-MUSCAT and DREAM8-NMME tend to overestimate the mineral dust horizontal extension when compared to the satellite data.
Figure 8.Time series of theδ532 nmp profiles retrieved from the Granada lidar system at different time intervals during the ChArMEx July 2012 intensive measurement period. The dark blue color represents regions and time periods where no data were retrieved.
Figure 9.τ550 nmfrom MODIS/Terra (top) andτ675 nmdaytime mean from MSG-SEVIRI (bottom) on 9, 10, and 11 July.
As in the case of Évora, almost negligible values were fore-cast above the station by COSMO-MUSCAT. This would be in agreement with the previous data except for the possible dust layer observed on 11 July.
In the eastern region, the station of Athens was affected by mineral dust during the 3 days according to the DREAM8-NMME model and COSMO-MUSCAT, only on 10 July ac-cording to NMMB/BSC-Dust, and on 10 and 11 July accord-ing to BSC-DREAM8b. As indicated by the analysis in the previous section, mineral dust was observed only on 11 July and the models seem to not completely capture the event at Athens. However, in this case the situation is quite more complex than at the western stations. Athens is located at the edge of the mineral dust plume during the 3 analyzed days. Slight changes in the horizontal distribution of the dust related to the model uncertainty and the relatively coarse horizontal resolution may highly influence the results. In the case of Bucharest, BSC-DREAM8b, DREAM8-NMME, and NNMB/BSC-DUST foresaw no influence of the mineral dust. Conversely, COSMO-MUSCAT forecast mineral dust
during the 3 days, with larger loads on 10 and 11 July, over-estimating the extension of the mineral dust plumes as previ-ously stated.
Due to the relatively coarse horizontal resolution of the model data presented in Fig. 10 compared to the single-site measurements at the five analyzed stations, it is worth evaluating in more detail the mineral dust mass concen-tration profiles provided by the models at the specific lo-cations of our interest. To perform this evaluation, min-eral dust mass concentration profiles provided by the BSC-DREAM8b, NMMB/BSC-Dust, DREAM8-NMME, and COSMO-MUSCAT models are evaluated against LIRIC re-sults. The main focus is at the Granada station since this site presents a larger number of mineral dust profiles due to the characteristics of the mineral dust event and allows evalua-tion of the temporal evoluevalua-tion of the dust microphysical prop-erties.
Figure 10.τ550 nmforecast by the(a)BSC-DREAM8b,(b)DREAM8-NMME,(c)NMMB/BSC-Dust, and(d)COSMO-MUSCAT models for 9, 10, and 11 July 2012 at 12:00 UTC over Europe and northern Africa. The yellow stars represent the location of the stations where microphysical properties profiles are retrieved with LIRIC.
Fig. 11,Cm, the integrated mass concentration for each pro-file and the correlation coefficient,R, between LIRIC and the different models are calculated and presented in Fig. 12. Fig-ure 13 shows the profiles of statistical parameters such asR obtained for LIRIC and the model time series, RMSE, NMB, and NMSD, calculated as described in Sect. 3 for every alti-tude level. These three figures need to be analyzed and dis-cussed as a whole in order to cover all aspects of the model performance regarding the temporal and vertical coordinates. An independent interpretation of each of the presented statis-tical parameters might be misleading at some points and lead to erroneous conclusions.
According to Figs. 11, 12, and 13, BSC-DREAM8b shows a good temporal correlation with LIRIC, providing larger values on 9 July than on 10 and 11 July, as observed in the ex-perimental data. The correlation coefficientRbetween
BSC-DREAM8b and LIRIC time series is larger than 0.5 for most of the altitudes (Fig. 13a). However, the model strongly un-derestimates the aerosol load during the 3 studied days, as indicated by the NMB in Fig. 13c. Positive and larger than 0.5 values ofRand the small difference between LIRIC and BSC-DREAM8b values ofCm during most of the analyzed period in Fig. 12 indicate that BSC-DREAM8b provides a good estimation of the mineral dust vertical distribution.
un-Figure 11.Dust mass concentration profiles obtained with LIRIC (dotted line) and BSC-DREAM8b-v2, DREAM8-NMME, DREAMABOL, and NMMB/BSC-Dust for Granada station every 3 h on 9, 10, and 11 July 2012.
derestimation of the aerosol load below 5000 m a.s.l., where it is higher, and overestimation above 5000 m a.s.l., where concentration values are lower according to LIRIC. From 3500 m a.s.l., good temporal correlation is observed between LIRIC and DREAM8-NMME, butRgoes close to 0 below this altitude (Fig. 13a). Regarding the vertical distribution of the load,Cmvalues in Fig. 12 present very small differences with LIRIC before 10 July at 06:00, but this difference in-creased afterwards. Absolute values ofR in Fig. 12 are usu-ally larger than 0.5 and larger than those retrieved for the other models, indicating good correlation. However, they os-cillate from negative to positive values, indicating a vertical shift in the location of the dust layers during some of the an-alyzed periods.
NMMB/BSC-Dust shows a better performance on 9 July, with τ440 nm values around 0.3, especially in the layer be-tween 2500 and 6000 m a.s.l. The difference bebe-tween LIRIC and the model-integrated mass concentration is also lower during 9 July. However, in general the model tends to un-derestimate the aerosol load below 4.5 km a.s.l. (Fig. 13c). Overestimation of the mass concentration is observed above this altitude though. NMMB/BSC-Dust correctly follows the aerosol load decrease with time as indicated by positive cor-relation values in Fig. 13a, but it presents a lower
1 2 3 4 5 6 7 8 9 10 11 12 0
100 200 300 400
In
te
g
ra
te
d
m
a
ss
c
o
n
c
e
n
tr
a
ti
o
n
(
m
g
m
)
2
–
BSC-DREAM8B DREAM8-NMME NMMB/BSC-DUST COSMO-MUSCAT LIRIC
1 2 3 4 5 6 7 8 9 10 11 1212
-1 -0.5 0 0.5 1
R
15:00 18:00 06:00 09:00 12:00 15:00 18:00 06:00 09:00 12:00 15:00 18:00
3 4 5 6
C
(
k
m
a
m
.s
.l
.)
July 9 July 10 July 11
Figure 12.(From top to bottom) Time series of the integrated mass concentration values (above 2 km in altitude) retrieved from LIRIC and the four evaluated model vertical profiles for the period between 15:00 UTC on 9 July 2012 and 18:00 UTC on 11 July 2012. Time series of the correlation coefficientR, between LIRIC-derived mass concentration profiles, and each one of the four evaluated models for the same period. Time series of the dust center of mass,Cm, obtained from LIRIC and the model profiles.
here in order to further explore and improve the possible ex-istence of delays between the model forecast and experimen-tal data.
COSMO-MUSCAT shows an increase in the mineral dust load during the analyzed period, with an increasing maxi-mum approximately located between 4 and 5 km. This be-havior is totally opposite to the one observed in LIRIC pro-files that shows a decrease in the volume concentration with time, as indicated by the negative values of R in Fig. 13a. According to the integrated mass concentration values in Fig. 12, COSMO-MUSCAT underestimates the dust load during the first half of the analyzed period, whereas an over-estimation of the dust load occurs in the second half. These two opposite behaviors seem to cancel and, as a result, NMB values in Fig. 13c are closer to zero below 4 km than for the other models, leading to erroneous conclusions. The loca-tions ofCmandRvalues in Fig. 12 indicate a good perfor-mance of the model regarding vertical distribution on 9 and 11 July and the afternoon of 10 July. Again, negativeR val-ues indicate a vertical shift in the location of the maximum concentration values during some periods, as also observed in Fig. 11.
The four models have been shown to have advantages and disadvantages, but a clear superior performance of any of the four has not been observed. As a general result, the four models tend to underestimate LIRIC values during the whole period, except for COSMO-MUSCAT, which clearly over-estimates the dust mass concentration from the afternoon of 10 July onwards. DREAM8-NMME and NMMB/BSC-Dust show a better performance, both regarding the dust load and
the temporal evolution of the event when the aerosol load observed with the ground-based instrumentation is higher. The temporal evolution of the event is mostly followed by the BSC models (namely the BSC-DREAM8b, DREAM8-NMME, and NMMB/BSC-Dust models) as indicated by the positive correlation with LIRIC time series, whereas COSMO-MUSCAT shows and opposite behavior (Fig. 13a). BSC-DREAM8b shows the minimum values of the RMSE below 4 km, where most of the aerosol load is located, and maximum values are obtained for DREAM8-NMME. However, no statistically significant difference between the models is clearly observed. BSC-DREAM8b, DREAM8-NMME, and COSMO-MUSCAT are not able to capture the high temporal variability observed with LIRIC, as indicated by the large absolute values of NMSD in Fig. 13d. They range between−0.5 and−1 below 6 km a.s.l. for
COSMO-MUSCAT and BSC-DREAM8b and between−1 at the lower
altitudes and 2 at the upper levels for DREAM8-NMME. NMMB/BSC-Dust shows a good performance in this case, with values close to 0 from 3 km upwards.
COSMO-20 40 60
RMSE (g m )– 3
-1 0 1
NMB
-1 0 1 2
NMSD
-1 0 1
2000 2500 3000 3500 4000 4500 5000 5500 6000
Correlation coefficient R
A
lti
tu
d
e
(
m
a
.s
.l.
)
BSC-DREAM8B DREAM8-NMME NMMB/BSC-DUST COSMO-MUSCAT
(a) (b) (c) (d)
Figure 13.Vertical profiles of the correlation coefficient between LIRIC and the model time series for every altitude level, the root mean square error RMSE, the normalized mean bias NMB, and the normalized mean standard deviation NMSD.
MUSCAT and NMMB/BSC-Dust presented the lower dis-crepancies on 11 July. These results are comparable to those in the study by Binietoglou et al. (2015).
Even though they forecast theCmfairly well, the analyzed models provided much smoother profiles than the ones re-trieved with LIRIC, with usually a single-broad maximum located at different altitudes depending on the model. This result is not surprising due to the coarser vertical resolution of the models compared to lidar profiles, which can pro-vide more detailed information about the vertical structures of mineral dust. The vertical correlation between the mod-els, shown in Fig. 12b, oscillates between positive and nega-tive values, indicating a shift in the location of the maximum peaks in those cases when it is negative.Rvalues range be-tween 0.01 and 0.85 in absolute value. The correlation ob-tained in the present analysis is lower than the ones pre-sented in Binietoglou et al. (2015), where most of the data presented determination coefficient (R2) values above 0.5. This is related to the fact that in the study by Binietoglou et al. (2015) selected mineral dust events with higher aerosol loads (τ440>0.15) were presented, whereas in this study the continuous evolution of the dust event was analyzed withτ440 ranging between 0.07 and 0.40. Therefore, according to the present study models seem to show a better performance in cases of higher aerosol load.
Model profiles were also obtained at the stations of Athens, Barcelona, Bucharest, and Évora in order to eval-uate their performance at stations where there is a slight or no presence of mineral dust. At Athens (Fig. S1 in the Supplement) almost negligible mass concentration values were forecast by the different models, with the exception
of DREAM8-NMME. This model indicated the presence of mineral dust in mass concentrations up to 100 µg m−3, reaching 4000 m a.s.l. on 10 July and up to 65 µg m−3 on 11 July, which is not in agreement with LIRIC results. In spite of the disagreement, it is worth pointing out that the dust layer observed at Athens between 3000 and 5000 m a.s.l. on 11 July according to LIRIC data was correctly forecast by the different models. At the Barcelona station (Fig. S2), DREAM8-NMME was not in agreement with the exper-imental results since it forecast dust mass concentrations of up to 100 µg m−3 and located below 2000 m a.s.l. At
Bucharest (Fig. S3), large dust concentrations were fore-cast between 3000 and 7000 m a.s.l. by BSC-DREAM8b, DREAM8-NMME, and NMMB/BSC-Dust on 9 July. On 10 and 11 July the dust load forecast by the models was much lower, even though it reached up to 50 µg m−3. This is not in agreement with our experimental results since only coarse spherical and fine particles and no mineral dust should be forecast here. Finally, at the Évora station (Fig. S4), DREAM8-NMME forecast dust mass concentration lower than 10 µg m−3below 2000 m a.s.l. COSMO-MUSCAT fore-cast similar concentrations above 2000 m a.s.l. These mass concentration values are almost negligible and therefore good agreement can be considered. In general, good results were provided by the different models at the five stations. However, DREAM8-NMME seems to be overestimating the dust mass concentrations at those stations affected by aerosol types different to mineral dust.
sim-ilar performance here, with none of them proving to be more accurate than the others. In general we observed that the BSC models showed a similar behavior between them. Dif-ferences were clearly observed when they were compared to COSMO-MUSCAT, based on a different philosophy. How-ever, none of them showed a statistically significant better performance. Differences between the obtained results lie in the different approaches used in the different models, the different meteorological fields used, dust sources, horizon-tal and vertical transport schemes, different resolutions, etc., as already pointed out in Binietoglou et al. (2015). Robust conclusions in this respect cannot be drawn from this study and would require wider databases with higher temporal and spatial coverage in order to cover the different aspects of the model calculations, and more dedicated studies. Nonethe-less, the comparison presented here provided valuable re-sults since it addresses the points of discrepancy and proves LIRIC’s potential as a tool for future model evaluations. In-formation inferred from the results obtained here could be used for the planning of future validation strategies and cam-paign management.
5 Summary and conclusions
In this study, the characterization of aerosol microphysical properties at different stations throughout Europe was per-formed in the framework of the ChArMEx/EMEP 2012 field campaign, in support of which EARLINET lidar stations per-formed continuous measurements during 72 h. LIRIC pro-files were obtained at five different stations in Europe (i.e., Athens, Barcelona, Bucharest, Évora, and Granada) in order to characterize atmospheric aerosol particles both in the ver-tical and horizontal coordinates and also their temporal evo-lution during this period. From the analysis of the aerosol microphysical properties at the different stations, two dif-ferent aerosol plumes were clearly observed: one affecting the western Mediterranean region, loaded with mineral dust, and another one over the Balkans area, mainly composed of fine particles and coarse spherical particles. The Granada sta-tion was clearly affected by the mineral dust outbreak during these 72 h, whereas mainly aerosol of local origin affected Évora and Barcelona. The dust plume was also observed above Barcelona on 11 July. A mixture of fine and coarse spherical particles was observed over Bucharest, likely re-lated to the presence of smoke from European fires, whereas at Athens mainly fine particles were observed, except on 11 July, when mineral dust of a different origin from the one in Granada and Barcelona was observed at 3.5 km a.s.l., as indicated by the backward trajectory analysis.
A thorough evaluation of the temporal evolution and the aerosol layer dynamics was possible at the Granada sta-tion, where a total of 60 lidar profiles every 30 min and 21 AERONET inversion retrievals were available. The anal-ysis of the microphysical properties profiles retrieved with
LIRIC indicated that the dust event was decreasing in inten-sity, with larger concentrations on 9 July (∼35 µm3cm−3) decreasing towards 11 July (∼15 µm3cm−3), in agreement
with AERONET and satellite data. On 9 July there was a strong predominance of the coarse spheroid mode with max-imum values in the afternoon, while an increase in the con-centration of the coarse spheroid mode up to 15 µm3cm−3 was observed during the afternoon of 11 July. This tempo-ral evolution of the microphysical properties reveals possible aging processes of the mineral dust above the station or even mixing processes with different aerosol types.
These results provide a good overview of the aerosol mi-crophysical properties in the Mediterranean region during the ChArMEx campaign. They also highlight the importance of having combined regular AERONET/EARLINET measure-ments for the characterization of aerosol microphysical prop-erties in the vertical, horizontal, and spatial coordinates with high resolution by means of algorithms such as LIRIC and suggest the importance of extending this kind of measure-ment. Our study remarks on the capability of LIRIC to be implemented in a simple, automated, and robust way within a network such as EARLINET and during special measure-ment campaigns obtaining reliable results. In addition, the advantages of the use of depolarization measurements with lidar systems are also emphasized here, since the stations with depolarization capabilities (namely Bucharest, Évora, and Granada) provided much more complete information about the microphysical properties profiles.
The availability of LIRIC output profiles at the five different stations provided regional coverage and made possible a comparison with the modeled dust fields pro-vided by BSC-DREAM8b, NMMB/BSC-Dust, DREAM8-NMME, and COSMO-MUSCAT. The regional comparison revealed quite good agreement with the horizontal distribu-tion of the dust plume forecast by the BSC models (based on a similar philosophy), but lower agreement for COSMO-MUSCAT over the Balkans region.