ACPD
15, 7837–7893, 2015Composition, microstructure, and
hygroscopic properties of
aerosols
E. F. Mikhailov et al.
Title Page
Abstract Introduction
Conclusions References
Tables Figures
◭ ◮
◭ ◮
Back Close
Full Screen / Esc
Printer-friendly Version Interactive Discussion
Discussion
P
a
per
|
Discussion
P
a
per
|
Discussion
P
a
per
|
Discussion
P
a
per
|
Atmos. Chem. Phys. Discuss., 15, 7837–7893, 2015 www.atmos-chem-phys-discuss.net/15/7837/2015/ doi:10.5194/acpd-15-7837-2015
© Author(s) 2015. CC Attribution 3.0 License.
This discussion paper is/has been under review for the journal Atmospheric Chemistry and Physics (ACP). Please refer to the corresponding final paper in ACP if available.
Chemical composition, microstructure,
and hygroscopic properties of aerosol
particles at the Zotino Tall Tower
Observatory (ZOTTO), Siberia, during
a summer campaign
E. F. Mikhailov1,2, G. N. Mironov2, C. Pöhlker1, X. Chi1, M. L. Krüger1,
M. Shiraiwa1, J.-D. Förster1, U. Pöschl1, S. S. Vlasenko2, T. I. Ryshkevich2,
M. Weigand3, A. L. D. Kilcoyne4, and M. O. Andreae1
1
Biogeochemistry and Multiphase Chemistry Departments, Max Planck Institute for Chemistry, Mainz, Germany
2
Atmospheric Physics Department, Institute of Physics, St. Petersburg State University, St. Petersburg, Russia
3
Modern Magnetic Systems Department, Max Planck Institute for Intelligent Systems, Stuttgart, Germany
4
Lawrence Berkeley National Laboratory, Berkeley, CA, USA
ACPD
15, 7837–7893, 2015Composition, microstructure, and
hygroscopic properties of
aerosols
E. F. Mikhailov et al.
Title Page
Abstract Introduction
Conclusions References
Tables Figures
◭ ◮
◭ ◮
Back Close
Full Screen / Esc
Printer-friendly Version Interactive Discussion
Discussion
P
a
per
|
Discussion
P
a
per
|
Discussion
P
a
per
|
Discussion
P
a
per
Received: 3 February 2015 – Accepted: 28 February 2015 – Published: 16 March 2015
Correspondence to: E. F. Mikhailov ([email protected])
ACPD
15, 7837–7893, 2015Composition, microstructure, and
hygroscopic properties of
aerosols
E. F. Mikhailov et al.
Title Page
Abstract Introduction
Conclusions References
Tables Figures
◭ ◮
◭ ◮
Back Close
Full Screen / Esc
Printer-friendly Version Interactive Discussion
Discussion
P
a
per
|
Discussion
P
a
per
|
Discussion
P
a
per
|
Discussion
P
a
per
|
Abstract
In this study we describe the hygroscopic properties of accumulation- and coarse-mode aerosol particles sampled at the Zotino Tall Tower Observatory (ZOTTO) in Central Siberia (61◦N; 89◦E) from 16 to 21 June 2013. The hygroscopic growth measurements were supplemented with chemical analyses of the samples, including inorganic ions
5
and organic/elemental carbon. In addition, the microstructure and chemical composi-tion of aerosol particles were analyzed by X-ray micro-spectroscopy (STXM-NEXAFS) and transmission electron microscopy (TEM). A mass closure analysis indicates that organic carbon accounted for 61 and 38 % of PM in the accumulation mode and coarse mode, respectively. The water soluble fraction of organic matter was estimated to be
10
52 and 8 % of PM in these modes. Sulfate, predominantly in the form of ammoniated sulfate, was the dominant inorganic component in both size modes:∼34 % in the ac-cumulation vs.∼47 % in the coarse mode.
The hygroscopic growth measurements were conducted with a filter-based diff
eren-tial hygroscopicity analyzer (FDHA) over the range of 5–99.4 % RH in the hydration and
15
dehydration operation modes. The FDHA study indicates that both accumulation and coarse modes exhibit pronounced water uptake approximately at the same RH, start-ing at∼70 %, while efflorescence occurred at different humidities, i.e., at ∼35 % RH for submicron particles vs.∼50 % RH for supermicron particles. This ∼15 % RH
dif-ference was attributed to higher content of organic material in the submicron particles,
20
which suppresses water release in the dehydration experiments.
The kappa mass interaction model (KIM) was applied to characterize and parame-terize non-ideal solution behavior and concentration-dependent water uptake by atmo-spheric aerosol samples in the 5–99.4 % RH range. Based on KIM, the volume-based hygroscopicity parameter,κv, was calculated. Theκv, ws value related to the water
sol-25
uble (ws) fraction was estimated to be∼0.15 for the accumulation mode and ∼0.36
for the coarse mode, respectively. The obtainedκv, ws for the accumulation mode is in
ACPD
15, 7837–7893, 2015Composition, microstructure, and
hygroscopic properties of
aerosols
E. F. Mikhailov et al.
Title Page
Abstract Introduction
Conclusions References
Tables Figures
◭ ◮
◭ ◮
Back Close
Full Screen / Esc
Printer-friendly Version Interactive Discussion
Discussion
P
a
per
|
Discussion
P
a
per
|
Discussion
P
a
per
|
Discussion
P
a
per
good agreement with earlier data reported for remote sites in the Amazon rain forest (κv≈0.15) and a Colorado boreal forest (κv≈0.16).
We used the Zdanovskii–Stokes–Robinson (ZSR) mixing rule to predict the chemical composition dependent hygroscopicity,κv, p. The obtainedκv, pvalues overestimate the
experimental FDHA-KIM-derived κv, ws by factors of 1.8 and 1.5 for the accumulation
5
and coarse modes, respectively. This divergence can be partly explained by incom-plete dissolution of the hygroscopic inorganic compounds resulting from kinetic limita-tions due to a sparingly soluble organic coating. The TEM and STXM-NEXAFS results indicate that aged submicron (>300 nm) and supermicron aerosol particles possess core-shell structures with an inorganic core, and are enriched in organic carbon at the
10
mixed particle surface. The direct FDHA kinetic studies provide a bulk diffusion
co-efficient of water of ∼10−12cm2s−1 indicating a semi-solid state of the organic-rich phase leading to kinetic limitations of water uptake and release during hydration and dehydration cycles.
Overall the present ZOTTO data set, obtained in the growing season, has revealed
15
a strong influence of organic carbon on the hygroscopic properties of the ambient aerosols. The sparingly soluble organic coating controls hygroscopic growth, phase transitions, and microstructural rearrangement processes. The observed kinetic limi-tations can strongly influence the outcome of experiments performed on multi-second time scales, such as the commonly applied HTDMA (Hygroscopicity Tandem Diff
er-20
ential Mobility Analyzer) and CCNC (Cloud Condensation Nuclei Counter) measure-ments.
1 Introduction
Siberia, a vast region in Central Eurasia, has been gaining growing attention from at-mospheric aerosol researchers in the last few decades. The atat-mospheric aerosol over
25
ACPD
15, 7837–7893, 2015Composition, microstructure, and
hygroscopic properties of
aerosols
E. F. Mikhailov et al.
Title Page
Abstract Introduction
Conclusions References
Tables Figures
◭ ◮
◭ ◮
Back Close
Full Screen / Esc
Printer-friendly Version Interactive Discussion
Discussion
P
a
per
|
Discussion
P
a
per
|
Discussion
P
a
per
|
Discussion
P
a
per
|
formation of secondary organic aerosol (SOA) (Tunved et al., 2006). Secondly, Siberia has been documented to be an important source region of biomass-burning aerosol particles that are distributed around the globe in the free troposphere (Conard and Ivanova, 1997; Müller et al., 2005; Warneke et al., 2009). Thirdly, Siberia is one of the few possible background regions in the Northern Hemisphere where near-pristine
5
conditions prevail for certain periods of the year (Chi et al., 2013). Such atmospheric observations in remote areas are very important for providing a reference for evaluating anthropogenic impacts in this and other regions (Andreae, 2007; Carslaw et al., 2013; Spracklen and Rap, 2013).
Aerosols influence the radiative budget of the Earth’s atmosphere in two different
10
ways. The first is the direct effect, whereby aerosols scatter and absorb solar and
ther-mal infrared radiation, and thus alter the radiative balance of the Earth–atmosphere system. Aerosol particles with a diameter that is comparable to the wavelength of so-lar radiation (0.2–2 µm) are the most effective light scatterers (Waggoner et al., 1981),
which makes organic carbon and some inorganic species (e.g., sulfate, nitrate,
am-15
monium) in the sub-micrometer size range typically the most effective chemical
com-ponents of aerosol light scattering. The second is the indirect effect, whereby aerosols
modify the microphysical and hence the radiative properties and lifetime of clouds (Hay-wood and Boucher, 2000; Rastak et al., 2014). These indirect effects of aerosols result
from their CCN (cloud condensation nuclei) and IN (ice nuclei) activity (Twomey, 1997;
20
Ogren and Charlson, 1992).
The hygroscopic properties of atmospheric aerosol particles are vital for a proper de-scription of these effects, since they describe how the particles interact with water
va-por both at sub- and supersaturated conditions (e.g., McFiggans et al., 2006; Swietlicki et al., 2008; Rastak et al., 2014). They are thus of major importance for describing the
25
life cycle of the aerosol and the related direct and indirect effects on climate.
The hygroscopic properties of aerosol particles in the northern European boreal forests under sub- and supersaturated conditions have been studied extensively using the Hygroscopicity Tandem Differential Mobility Analyzer (HTDMA) and size-resolved
ACPD
15, 7837–7893, 2015Composition, microstructure, and
hygroscopic properties of
aerosols
E. F. Mikhailov et al.
Title Page
Abstract Introduction
Conclusions References
Tables Figures
◭ ◮
◭ ◮
Back Close
Full Screen / Esc
Printer-friendly Version Interactive Discussion
Discussion
P
a
per
|
Discussion
P
a
per
|
Discussion
P
a
per
|
Discussion
P
a
per
CCN counter (Hämeri et al., 2001; Ehn et al., 2007; Birmili et al., 2009; Sihto et al., 2011; Cerully et al., 2011; Kerminen et al., 2012; Paramonov et al., 2013; Jaatinen at al., 2014). These results specifically show that in summer the aerosol particles are en-riched in organic species produced by biomass burning and biogenic emissions, which overall decrease their hygroscopicity and CCN activity when compared to other
loca-5
tions in Europe. In addition, due to aerosol aging (coagulation, condensation, aerosol-cloud interactions, and chemical reactions on the surface and in the aqueous phase) the growth in aerosol size from Aitken to accumulation mode leads to an increase of their hygroscopicity (Paramonov et al., 2013).
An important limitation of the commonly used HTDMA and CCN instruments is that
10
they are only applicable to small particles due to the restriction of their particle size range (typically dry diameter<300 nm). To our knowledge, no experimental data for the hygroscopic properties of the accumulation mode in the size range 0.3–1.0 µm and of the coarse (>1 µm) mode in the boreal environment have been presented up to now. Therefore, we have set out to investigate and characterize the hygroscopic
prop-15
erties of boreal aerosol particles in the growing season covering the sub- and super-micron size ranges. The hygroscopic growth measurements of aerosol particles have been performed by a filter-based differential analyzer supplemented by chemical and
microstructural studies. The instrumentation and measurement procedures applied in this study are described below. To characterize the hygroscopic behavior of the aerosol
20
particles in the 5–99.4 % RH range, we used the mass-based hygroscopicity parameter interaction model (Mikhailov et al., 2013).
2 Measurements and methods
2.1 Sampling site and meteorological conditions
The aerosol samples were collected from 16 to 21 June 2013 at the Zotino Tall Tower
25
ACPD
15, 7837–7893, 2015Composition, microstructure, and
hygroscopic properties of
aerosols
E. F. Mikhailov et al.
Title Page
Abstract Introduction
Conclusions References
Tables Figures
◭ ◮
◭ ◮
Back Close
Full Screen / Esc
Printer-friendly Version Interactive Discussion
Discussion
P
a
per
|
Discussion
P
a
per
|
Discussion
P
a
per
|
Discussion
P
a
per
|
of the West Siberia Lowland in the boreal zone (60.8◦N, 89.4◦E, 114 m a.s.l.), about 600 km north of the closest large city, Krasnoyarsk (950 000 inhabitants). The nearest village (Zotino) is about 20 km in an eastern direction from the site. The heart of the station is a 301 m high tower, which has been designed for long-term atmospheric observations. Because of the high intake elevation, the air masses sampled at the
5
tower are fairly representative for a very large spatial area. A more detailed description of ZOTTO is given elsewhere (Birmili et al., 2007; Heintzenberg et al., 2008; Winderlich et al., 2010).
During our sampling campaign the weather was warm and dry and did not change significantly. The average temperature and relative humidity (RH) at nighttime and
10
at daytime were 15.2±3.2◦C and (84±10 %), and 21.8±2.8◦C and (61±19 %),
re-spectively. Backward trajectories computed with the NOAA HYSPLIT model (Draxler and Rolph, 2003) were used to trace the air history (Fig. 1). The air mass ori-gins had essentially a continental character and they were stagnant (showed a re-circulation pattern), except in the period of 16–17 June when they came from the
15
north. Fire maps from the Moderate Resolution Imaging Spectroradiometer (MODIS) (http://rapidfire.sci.gsfc.nasa.gov) showed several fires to the east of the ZOTTO site, therefore air masses arriving at the station from 19 to 21 June could contain accumu-lated combustion products.
Carbon monoxide (CO) is used as transport tracer for pollutant plumes. CO mixing
20
ratios in air sampled from 300 m were measured by UV resonance fluorescence, using a Fast-CO-Monitor (Model AL 5002, Aerolaser GmbH, Germany). Details of the experi-mental setup and calibration are described elsewhere (Chi et al., 2013). The CO mixing ratios observed during the sampling campaign are shown in Table 1. The daily aver-age CO values correlate well with the backward trajectories and MODIS AOD product.
25
Thus the elevated CO observed from 19 to 20 June can be attributed to air masses that passed over wildfires located to the east of the site (Fig. 1). Overall, during the sampling campaign the average CO mixing ratio was∼113 ppb, which corresponds to
“background” conditions in June at the ZOTTO site (Chi et al., 2013). Using the
ACPD
15, 7837–7893, 2015Composition, microstructure, and
hygroscopic properties of
aerosols
E. F. Mikhailov et al.
Title Page
Abstract Introduction
Conclusions References
Tables Figures
◭ ◮
◭ ◮
Back Close
Full Screen / Esc
Printer-friendly Version Interactive Discussion
Discussion
P
a
per
|
Discussion
P
a
per
|
Discussion
P
a
per
|
Discussion
P
a
per
inition of Andreae (2007) and Chi et al. (2013) we refer to “background” conditions as an atmospheric state without the detectable influence of local or regional pollution sources, but affected by emissions from natural origin as well as pollution transported
from very distant sources.
2.2 Sampling
5
Ambient air was sampled through a stainless steel inlet pipe reaching to the top of the tower at 300 m above ground with an internal diameter of about 2.9 cm, which was designed for a laminar nominal sampling flow of 40 L min−1 (Birmili et al., 2007). Pre-installation calibration showed that particles with diameterDp>50 nm are nearly perfectly transmitted through this pipe (Heintzenberg et al., 2008). Additional test
mea-10
surements with supermicron aerosol particles have shown that the upper transmission size limit for the inlet system was∼10 µm.
Aerosols were collected on quartz fiber filters (2500QAT-UP, Pallflex) and Teflon-coated fiber glass filters (T60A20, Pallflex). The 47 mm quartz filters were used for organic carbon (OC) and elemental carbon (EC) analysis, while the 13 mm T60A20
15
filters were used for ion analysis and hygroscopic study. The 13 mm Teflon filters were loaded by passing an air flow of 10 L min−1 through a rotating Micro-Orifice Uniform Deposit Impactor (MOUDI, model 125R). Each filter was placed under an Al substrate having a 12 mm central hole. Two impactor stages (I) and (II) (original numeration – 5 and 9) were used to collect the coarse (>1 µm) and accumulation (0.1–1 µm) aerosol
20
size modes. On the quartz filters, aerosol particles were collected directly from the inlet line using a home-made sampler at a flow rate of 20 L min−1. The MOUDI and OC/EC
filter sampling were conducted for a period of 130 h.
The exposed filters were sealed in aluminum foil and then placed in Ziploc bags. The samples were stored at 4◦
C before being analyzed, excluding the travel time from the
25
station to the laboratory (∼48 h). The aerosol mass concentrations were determined
ACPD
15, 7837–7893, 2015Composition, microstructure, and
hygroscopic properties of
aerosols
E. F. Mikhailov et al.
Title Page
Abstract Introduction
Conclusions References
Tables Figures
◭ ◮
◭ ◮
Back Close
Full Screen / Esc
Printer-friendly Version Interactive Discussion
Discussion
P
a
per
|
Discussion
P
a
per
|
Discussion
P
a
per
|
Discussion
P
a
per
|
of 23◦C and a relative humidity between 35 and 45 %. Each filter was weighed at least three times before and after sampling. An anti-static U-Electrode (Mettler-Toledo) was used to discharge samples before weighing. The uncertainty (1 SD) for PM determina-tion is estimated to be 3.5 and 1 µg, for 47 mm quartz filters and 13 mm T60A20 filters, respectively.
5
Aerosol samples for x-ray microspectroscopy were collected using a homemade sin-gle stage impactor, which was operated at a flow rate of 1 L min−1and a corresponding 50 % size cut-offof about 550 nm. Particles below this nominal cut-offare not deposited
quantitatively, however a certain fraction is still collected via diffusive deposition and
therefore available for the STXM analysis. Aerosol particles were collected onto width
10
silicon nitride substrates (Si4N3, membrane 500 µm, membrane thickness 100 nm, Sil-son Ltd., Northhampton, UK) for short sampling periods (∼20 min), which ensures an appropriately thin particle coverage on the substrate for single particle analysis. Samples were stored in airtight containers at 4◦C and 20–30 % RH. Table 1 lists the impactor samples analyzed and discussed in the context of this study.
15
The MOUDI stages were initially calibrated using flat Al foil (Marple et al., 1991). However, the relatively high thickness (∼0.3 mm) of the fiber filter and unequal
sam-pling surface could modify the impaction characteristics. To estimate the retention efficiency of the filter in question, test experiments were conducted. Procedure and
schematic diagrams of the test system are presented in Supplement S1. Figure 2a
20
shows the collection characteristics of the MOUDI – I and II stages that were used to sample the coarse mode (CM;>1 µm) and accumulation mode (AM; 0.1–1 µm) of the aerosol size distribution. The results show that for stage II the collection efficiency
reaches only∼0.9. Generally, fiber substrates combine impaction and filtration mech-anisms and the resulting collection efficiency is higher than for a flat surface (Rao and
25
Whitby, 1978). In our experiment only 13 mm filter disks were used for aerosol sam-pling, while the active impaction surface is∼17 mm. Therefore, some of the particles could have bounced offthe surface of the Al substrate, as illustrated in Fig. S1.
ACPD
15, 7837–7893, 2015Composition, microstructure, and
hygroscopic properties of
aerosols
E. F. Mikhailov et al.
Title Page
Abstract Introduction
Conclusions References
Tables Figures
◭ ◮
◭ ◮
Back Close
Full Screen / Esc
Printer-friendly Version Interactive Discussion
Discussion
P
a
per
|
Discussion
P
a
per
|
Discussion
P
a
per
|
Discussion
P
a
per
Figure 2b shows the initial volume distributions (black symbols) of the atmospheric aerosol particles averaged during the sampling period and those that deposited on the impactor stages I and II. The volume distributions of the deposited particles were obtained by in series multiplying the initial distribution with the collection efficiency of
stages I and II. The distributions obtained indicate that the aerosol loading on stage I
5
represents the CM, whereas stage II represents the AM.
2.3 Instrumentation
2.3.1 Organic carbon and elemental carbon analysis
Organic carbon (OC), elemental carbon (EC), and total carbon (TC=OC+EC) were
measured by a thermal-optical transmission (TOT) technique (Birch and Cary, 1996),
10
using a thermal-optical carbon analyzer from Sunset Laboratory (OR, USA). The tem-perature protocol used was the NIOSH5040 with a preset maximum of 870◦C (Birch, 1998). The uncertainty in the OC, EC, and TC measurement is provided for every in-dividual filter sample by the calculation program. The uncertainty is made up of a con-stant part (which is 0.2 µg C cm−2 for OC and EC and 0.3 µg C cm−2 for TC) and of
15
a variable part which amounts to 5 % of the OC, EC or TC mass loading. To correct for the positive artifact in the OC determination, two quartz filters in series were used (Maenhaut and Claeys, 2007). Both filters were pre-baked at 850◦C. The carbon load-ing on the second filter was subtracted from that on the first filter. Water soluble organic carbon (WSOC) was determined by soaking part of the filter in water (18.2 MΩcm,
20
Direct-Q3 UV, Millipore) for 12 h, and after drying the remaining carbon in the filter was measured using the Sunset instrument.
2.3.2 Ion chromatography analysis
The aerosol-loaded filters were placed in 15-mL polystyrene tubes; 4 mL Millipore Sim-plicity water was added and the tubes were then placed typically in an ultrasonic
ACPD
15, 7837–7893, 2015Composition, microstructure, and
hygroscopic properties of
aerosols
E. F. Mikhailov et al.
Title Page
Abstract Introduction
Conclusions References
Tables Figures
◭ ◮
◭ ◮
Back Close
Full Screen / Esc
Printer-friendly Version Interactive Discussion
Discussion
P
a
per
|
Discussion
P
a
per
|
Discussion
P
a
per
|
Discussion
P
a
per
|
water bath for 30 min, after which they were allowed to stand for 30 min. The sam-ple extract was then filtered through a PVDF syringe filter (pore size 0.2 µm) and the filtrate was subjected to IC analysis. A Dionex DX-500 instrument with a AG-22 guard, a AS-AG-22 analytical column, and a ASRS-300 self-regenerating suppressor was used for the analysis of major inorganic anions (Cl−, Br−, NO−2, NO−3, PO34− and
5
SO2−
4 ); the same instrument with a CG-12 A guard, a CS-12 A analytical column, and
a CSRS self-regenerating suppressor was used for the measurement of major cations (Na+, NH+4, K+, Mg2+, and Ca2+). All columns had a 4 mm inner diameter. The an-ion analysis was done with a buffer eluent solution of 4.5 mM Na
2CO3 and 1.4 mM
NaHCO3 (0.5 mL min−1) and a duration of 21 min; the cation analysis was performed
10
using a standard Dionex method, with 20 mM methanesulfonic acid (isocratic) as eluent (1.3 mL min−1) and a duration of 12 min. All IC analyses were made with manual injec-tions, the injection loop for the anion analysis is 200 µL, while it is 25 µL for the cation analysis. The ion analysis was conducted on the same MOUDI samples that were pre-viously used for the hygroscopic growth experiment. The blank value was subtracted
15
from the measured concentrations on each impactor stage. The total instrumental un-certainty of ion analysis (1 SD) was approximately 10 % for anions and cations (Leiva et al., 2012).
2.3.3 X-ray micro-spectroscopy – STXM-NEXAFS and TEM
X-ray micro-spectroscopy was used to analyze aerosol samples on single particle
20
basis. We applied scanning transmission x-ray microscopy with near-edge x-ray ab-sorption fine structure analysis (STXM-NEXAFS) to determine the microstructure and chemical composition of aerosol particles with a volume equivalent diameter in the range of 0.3–3 µm. The STXM-NEXAFS analysis was conducted at two x-ray micro-scopes: (I) the MAXYMUS microscope at beamline UE46-PGM-2 (energy range 270–
25
1900 eV) at the synchrotron BESSY II (1.7 GeV, 100 mA stored current in low alpha decay mode), Helmholtz-Zentrum Berlin, Germany, and (II) the X-ray microscope at
ACPD
15, 7837–7893, 2015Composition, microstructure, and
hygroscopic properties of
aerosols
E. F. Mikhailov et al.
Title Page
Abstract Introduction
Conclusions References
Tables Figures
◭ ◮
◭ ◮
Back Close
Full Screen / Esc
Printer-friendly Version Interactive Discussion
Discussion
P
a
per
|
Discussion
P
a
per
|
Discussion
P
a
per
|
Discussion
P
a
per
beamline 5.3.2.2 (energy range 250–800 eV) at the Advanced Light Source (1.9 GeV, 500 mA stored current in top-off mode), Berkeley, CA, USA. Both STXM instruments
are equipped with a high energy resolving grating (resolving power at the carbon K-edge: ALS E/∆E≤5000; BESSY II: E/∆E≤8000), a Fresnel zone plate, providing
a spatial resolution of about 30 nm, and a phosphor-coated Lucite photomultiplier tube
5
for detection of transmitted photons. Further information about the x-ray microscopes can be found elsewhere (Follath et al., 2010; Kilcoyne et al., 2003).
X-ray microscopy was performed by raster-scanning the aerosol samples in the fo-cused x-ray beam and measuring the intensity of the transmitted monochromatic light. Spectroscopic information is obtained by scanning the energy of the incident photons
10
across the x-ray absorption edges of several elements of interest. A detailed descrip-tion of STXM-NEXAFS analysis in aerosol science can be found in Moffet et al. (2010).
The obtained STXM data were pre-processed using the software aXis 2000 (analysis of X-ray microscopy images and spectra), whereas final analysis was conducted using IGOR Pro (Wavemetrics) routines. Four aspects of the STXM analysis are presented in
15
this study: (i) x-ray microscopy images at defined energies, (ii) elemental maps provid-ing information about the spatial distribution of certain elements of interest, (iii) elemen-tal ratios in individual aerosol particles based on x-ray absorption spectra covering the absorption edges of multiple elements, such as carbon (C), nitrogen (N), and oxygen (O), and (iv) NEXAFS spectra characterizing the chemical environment of the elements
20
C, N, and O. A detailed description of the analysis can be found in Pöhlker et al. (2012). The x-ray study of the particle morphology was supplemented by transmission elec-tron microscopy (TEM) analysis. The samples were collected on 3 mm carbon-coated TEM grids, which were fixed in the center of 47 mm aluminum substrates and placed in the same MOUDI impactor stages as the Teflon-coated fiber glass filters. The
sam-25
ACPD
15, 7837–7893, 2015Composition, microstructure, and
hygroscopic properties of
aerosols
E. F. Mikhailov et al.
Title Page
Abstract Introduction
Conclusions References
Tables Figures
◭ ◮
◭ ◮
Back Close
Full Screen / Esc
Printer-friendly Version Interactive Discussion
Discussion
P
a
per
|
Discussion
P
a
per
|
Discussion
P
a
per
|
Discussion
P
a
per
|
2.3.4 Size distribution measurements
Particle size distributions at ZOTTO are measured with a Differential Mobility Particle
Sizer (DMPS) (15–835 nm) and an Aerodynamic Particle Sizer (APS 3321, TSI. Inc.) (0.5–20 µm). Detailed information about the ZOTTO DMPS system is given in Heintzen-berg et al. (2011). For consistency with the chemical analysis and hygroscopic
mea-5
surements that were conducted on the collected particles, no size correction for trans-mission losses in the inlet pipe line was made.
2.3.5 Water uptake measurements
Mass-based water uptake measurements were performed with a filter-based differential
hygroscopicity analyzer (FDHA) using the atmospheric aerosol filter samples collected
10
as described above (Sect. 2.2). The 13 mm filters loaded with the MOUDI impactor were mounted in the FDHA system. The particulate matter mass (PM) concentrations deposited on the filters in stages I and II is listed in Table 2. Details of the experi-mental setup and calibration are described elsewhere (Mikhailov et al., 2011, 2013). The measurement uncertainties depend on the weighing accuracy of dry particle mass
15
(aerosol loading), the absorbed water mass (aerosol hygroscopicity), and the water va-por measurement precision of the katharometer (Mikhailov et al., 2011). In this study, the uncertainties in the determination of mass growth factors,Gm(Eq. 2) were:∼2 % at
30 % RH and∼10 % at 99 % RH. The relative humidity of the FDHA water uptake mea-surement is determined from the temperature ratio between the water vapor saturator
20
and the measurement cells. The accuracy at 99 % RH was±0.06 % RH, resulting from
accurate temperature control using a double-wall copper housing with forced thermal insulation and precise temperature measurements (±0.01 K, 42095-Pt100; KELVIMAT
4306, Burster).
The water uptake experiments were performed in two modes: hydration=increasing
25
RH; dehydration = decreasing RH. In both operational modes the RH was changed
stepwise at a rate of∼0.4 % min−1. The potential particle mass lost due to
ACPD
15, 7837–7893, 2015Composition, microstructure, and
hygroscopic properties of
aerosols
E. F. Mikhailov et al.
Title Page
Abstract Introduction
Conclusions References
Tables Figures
◭ ◮
◭ ◮
Back Close
Full Screen / Esc
Printer-friendly Version Interactive Discussion
Discussion
P
a
per
|
Discussion
P
a
per
|
Discussion
P
a
per
|
Discussion
P
a
per
tion was monitored by weighing the loaded filters before and after water uptake mea-surements. These measurements as well as subsequent hygroscopic data obtained in repetitive drying/humidifying cycles showed that the effect of particle evaporation was
negligibly small. The experimental conditions in the measurement cells were close to ambient temperature and pressure (∼295 K,∼1000 hPa).
5
3 Water uptake modeling and parameterization
Theκ-mass interaction model (KIM) was used to describe and parameterize different
regimes of hygroscopicity observed in our FDHA measurements. Details of the KIM are given elsewhere (Mikhailov et al., 2013). Briefly, in analogy with the volume-based hygroscopicity parameter (Petters et al., 2007) we define a mass-based hygroscopicity
10
parameter,κm:
1
aw =1+κm md
mw, (1)
whereawis the activity of water,md is the total mass of the dry particle material, and
mw is the mass of water in the wet particle (aqueous droplet). By defining the mass growth factor,Gm, as:
15
Gm=mw +m
d
md (2)
and combining Eqs. (1) and (2) we obtain
aw=
κ
m
Gm−1
+1
−1
ACPD
15, 7837–7893, 2015Composition, microstructure, and
hygroscopic properties of
aerosols
E. F. Mikhailov et al.
Title Page
Abstract Introduction
Conclusions References
Tables Figures
◭ ◮
◭ ◮
Back Close
Full Screen / Esc
Printer-friendly Version Interactive Discussion
Discussion
P
a
per
|
Discussion
P
a
per
|
Discussion
P
a
per
|
Discussion
P
a
per
|
Based on Eq. (3) an approximate mass-basedκm-Köhler equation can be written as
follows:
RH
100 % =sw≈
κ
m
Gm−1
+1
−1
exp 4σwMw
RT ρwDd
ρ
w
ρdGm
1/3!
, (4)
whereMw,σw, andρware the molar mass, surface tension, and density of pure water,
R is the universal gas constant,T is the temperature, and Dd and ρd are the volume
5
equivalent diameter and density of the dry particle. The concentration dependence of
κm in the KIM is expressed as follows:
κm=X
i
κm,0icm,i+
X
i <
X
j
αi jcm,icm,j+
X
i
αi ic2m,i. (5)
Here κm,0i is the dilute hygroscopicity, αi j and αi i are the cross- and self-interaction coefficients, respectively;c
m,i andcm,j are the mass concentrations of individual
com-10
ponents (i,j) in the aqueous solution. The mass concentration of each component in the aqueous solution,cm,i, can be calculated either from the solubility (if componentiis only partially dissolved) or from the dry mass fraction (if componenti is fully dissolved). For mixed organic–inorganic particles KIM describes three distinctly different regimes
of hygroscopicity: (I) a quasi-eutonic deliquescence and efflorescence regime at
low-15
humidity, where substances are just partly dissolved and exist also in a non-dissolved phase, (II) a gradual deliquescence and efflorescence regime at intermediate
humid-ity, where different solutes undergo gradual dissolution or solidification in the aqueous
phase; and (III) a dilute regime at high humidity, where the solutes are fully dissolved approaching their dilute hygroscopicity. In each of these regimes, the concentration
20
dependence ofκmcan be described by simplified model equations:
– Regime I:
κm=k
1(Gm−1) (6)
ACPD
15, 7837–7893, 2015Composition, microstructure, and
hygroscopic properties of
aerosols
E. F. Mikhailov et al.
Title Page
Abstract Introduction
Conclusions References
Tables Figures
◭ ◮
◭ ◮
Back Close
Full Screen / Esc
Printer-friendly Version Interactive Discussion
Discussion
P
a
per
|
Discussion
P
a
per
|
Discussion
P
a
per
|
Discussion
P
a
per
– Regime II:
κm=k
2+k3(Gm−1)+k4(Gm−1)
−1+k
5(Gm−1)
−2 (7)
– Regime III:
κm=k
5(Gm−1)
−2+k
6. (8)
Herek1 tok6are fit parameters related to the solubility and interaction coefficients of
5
all involved chemical components (Mikhailov et al., 2013; Eqs. 39–44). In Eq. (8) the fit parameter k6=κ0
m can be regarded as the dilute hygroscopicity parameter of the
investigated sample of particulate matter (Fig. 2b). Its physical meaning is equivalent to the volume-based parameter,κv, proposed by Petters and Kreidenweis (2007).
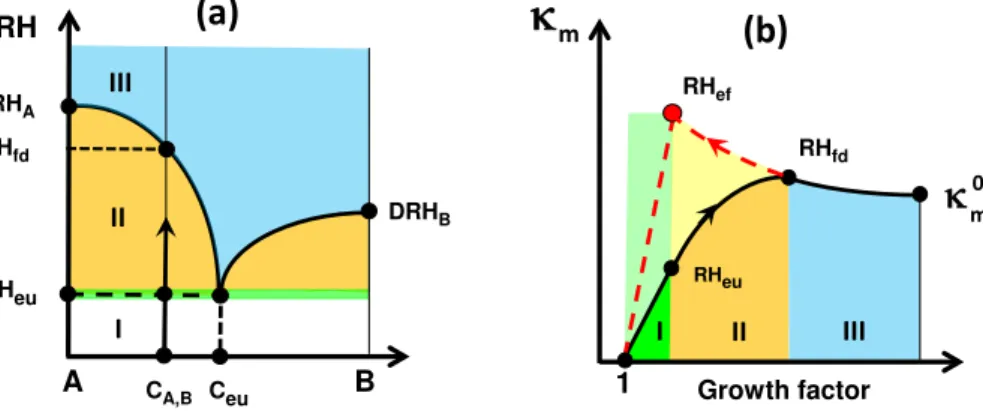
Figure 3a shows an illustrative example of KIM assuming a two-component
mix-10
ture (A and B) having deliquescence relative humidities DRHAand DRHB, respectively (Wexler and Seinfeld, 1991). At RHeumixed particles partially deliquesce (I, green line) and the concentration of each component is given by the eutonic (eu) solubility,Ceu; as the RH increases further, gradual dissolution of the solid component A occurs (mode II, yellow area). At the relative humidity of RHfd both components are fully dissolved (fd)
15
with a composition equal to the initial particle composition, CA, B. The subsequent in-crease in RH leads to dilution of the aqueous solution (III, blue area). This simplified two component diagram can be extended to a multicomponent mixture. Figure 3b il-lustrates the respective changes of theκm, which are captured by Eqs. (6)–(8). Note that these equations can be also used to describe and parameterize mixed particles
20
that are in a metastable state (Fig. 3b, red dashed line). Specifically, in KIM the “quasi-eutonic deliquescence and efflorescence” states are considered to characterize partly
dissolved solutes that may co-exist in metastable equilibrium with amorphous phases (Mikhailov et al., 2013) that undergo quasi-eutonic deliquescence (RHeu) and quasi-eutonic efflorescence (RH
ef), respectively (Fig. 3b).
ACPD
15, 7837–7893, 2015Composition, microstructure, and
hygroscopic properties of
aerosols
E. F. Mikhailov et al.
Title Page
Abstract Introduction
Conclusions References
Tables Figures
◭ ◮
◭ ◮
Back Close
Full Screen / Esc
Printer-friendly Version Interactive Discussion
Discussion
P
a
per
|
Discussion
P
a
per
|
Discussion
P
a
per
|
Discussion
P
a
per
|
4 Results and discussion
4.1 Chemical composition
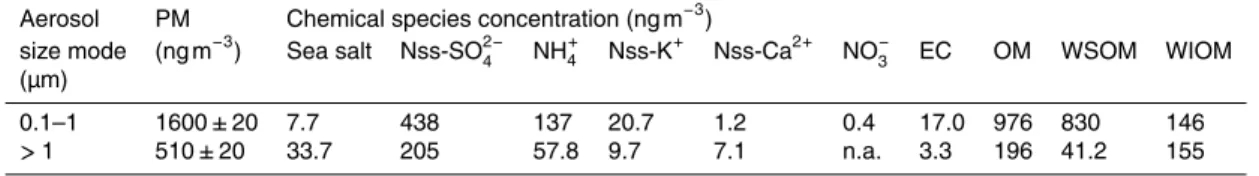
The aerosol chemical mass closure calculations were made in a similar way as done by Maenhaut et al. (2002). The reconstructed PM mass for accumulation and coarse mode was obtained as the sum of 8 aerosol species, which were calculated as follows:
5
(1) ammonium (NH+4); (2) nitrate (NO−3); (3) sea salt estimated as 1.4486[Na+]+[Cl−],
where 1.4486 is the ratio of the concentration of all elements except Cl−
in sea water to the Na+ concentration; (4) non-sea-salt (nss)-sulfate is obtained as total sulfate minus sea-salt sulfate, whereby the latter was obtained as 0.252 [Na+], with 0.252 the mass ratio of SO2−
4 to Na
+
in sea water (Riley and Chester, 1971); (5) nss-K+−as total K+
10
minus 0.0376[Na+]; (6) nss-Ca2+−as total Ca2+−0.0382[Na+]; (7) elemental carbon
(EC); and (8) organic matter (OM) was estimated as PM−(EC+P
inorganic_species). The measured OC data could not be used for this purpose, since the OC measurement was done on total PM filters, without size fractionation.
Mineral dust was not considered in the mass closure since the STXM-NEXAFS
15
results indicate the absence of significant dust-like components in the samples (Fig. S2.2). Elemental carbon and organic carbon were measured for total PM, there-fore several simplifying assumptions were used to estimate EC, water soluble (WSOM), and water insoluble (WIOM) organic matter in the coarse and accumulation mode frac-tions of the ZOTTO samples. First, EC was divided between AM and CM as 5 : 1, which
20
is a typical ratio for smoke particles (Jaffrezo et al., 2005; Soto-García et al., 2011; Liu
et al., 2013). Second, we assume that the WSOM/OM ratio is equal to 0.85 for AM and 0.21 for the CM. Details of the calculation are presented in the Supplement S3. Reconstructed contents of the inorganic and organic species for AM and CM are re-ported in Table 2 and shown in Fig. 4. In both size fractions, SO24− and NH+4 are the
25
dominant ions, with sulfate ions accounting for 27 and 40 % of particulate matter in AM and CM, respectively (Fig. 4). Some of the sulfates could have come from forest fires
ACPD
15, 7837–7893, 2015Composition, microstructure, and
hygroscopic properties of
aerosols
E. F. Mikhailov et al.
Title Page
Abstract Introduction
Conclusions References
Tables Figures
◭ ◮
◭ ◮
Back Close
Full Screen / Esc
Printer-friendly Version Interactive Discussion
Discussion
P
a
per
|
Discussion
P
a
per
|
Discussion
P
a
per
|
Discussion
P
a
per
located to the east of the ZOTTO site, but these must be a minor source, because the typical sulfate content in aged biomass smoke is only about 5 %. Additionally, sulfates could also have natural sources, namely the oxidation of marine emitted dimethylsulfide (Levasseur, 2013). Again, this can only account for a minor fraction because biogenic sulfate aerosol concentrations in the Arctic are typically less than 100 ng m−3 even in
5
summer, when this source is strongest (Li and Barrie, 1993; Norman et al., 1999; Quinn et al., 2002; Ström et al., 2003; Gong et al., 2010; Chang et al., 2011). Most of the sul-fate must thus be of anthropogenic origin, arriving from the north with the Arctic airflow, which passed at∼400 km by Norilsk (Fig. 1) a powerful source of SO2(Walter et al., 2002). This is consistent with the back trajectory analysis (Fig. 1) and CO levels
(Ta-10
ble 1), which indicate a significant influence of Arctic and eastern air masses at the ZOTTO site.
Sea salt is the next important inorganic component in CM (6.6 %), suggesting a pre-dominant origin by long-range transport from the Arctic Ocean (Fig. 1). Nss-K+ was the second most abundant cation and accounted for 1.3 and 1.9 % of PM in the
ac-15
cumulation and coarse modes. Generally, K+ is a good indicator for biomass burning and could have come with eastern air masses from the biomass burning area (Fig. 1). However, given the lack of intense forest fires (EC/TC∼2 %) the primary emission of
nss-K+ from biogenic sources should not be neglected. Active biota, such as plants and fungi are known to be an additional source for atmospheric K-rich salts in the
20
air (Pöhlker et al., 2012). A small amount of nss-Ca2+ was observed in both accu-mulation (<0.1 %) and coarse (1.4 %) mode. Coarse ash particles emitted from wood combustion generally contain significant amounts of Ca along with Mg, Si, Al, Fe, and K (Pitman, 2010). Enriched Ca2+ may be also produced by processes within clouds, which bring sea salt and mineral particles together, or by the reaction of atmospheric
25
ACPD
15, 7837–7893, 2015Composition, microstructure, and
hygroscopic properties of
aerosols
E. F. Mikhailov et al.
Title Page
Abstract Introduction
Conclusions References
Tables Figures
◭ ◮
◭ ◮
Back Close
Full Screen / Esc
Printer-friendly Version Interactive Discussion
Discussion
P
a
per
|
Discussion
P
a
per
|
Discussion
P
a
per
|
Discussion
P
a
per
|
Organic compounds account for a large fraction of air particulate mass (Table 2): OM PM−1 ratios in AM and CM are as high as 61 and 38 %, and the WSOM fraction was estimated to be∼52 % in AM and∼8 % in CM, respectively (Fig. 4). The measured concentrations of OC and EC in total PM were 1000±60 ng m−3and 20.3±5.6 ng m−3,
respectively, in reasonable agreement with the sum of the reconstructed OM values
5
(1170 ng m−3). These concentrations are a factor of 2.4 lower for OC and a factor of 8 lower for EC than those measured by Maenhaut et al. (2011) in the summer season at the background boreal station SMEAR II (Hyytiälä, Finland). The low content of el-emental carbon (EC/TC∼2 %) suggests that during our field campaign the effect of
forest fires and fossil fuel combustion on the carbonaceous aerosol fraction was
mod-10
est. The most likely sources of the particulate organic carbon are atmospheric oxida-tion processes, which convert biogenic volatile organic compounds (BVOCs), such as monoterpenes and sesquiterpenes emitted by the boreal ecosystem, to secondary or-ganic aerosol (Kanakidou et al., 2005; Corrigan et al., 2013; Chi et al., 2013; Mikhailov et al., 2015).
15
The WSOC/OC ratio was estimated at 0.67±0.06. Such a high water-soluble fraction
suggests that the atmospheric conditions in summer may favor the further oxidation of the secondary organic compounds towards higher water solubility. Our results are comparable with earlier data reported for forest environments in the summer season: WSOC/OC=0.70±0.09 (Timonen et al., 2008) and 0.71±0.05 (Kiss et al., 2002).
20
The high level of WIOM (∼30 %) in CM can be explained by the presence of
pri-mary biogenic particles, e.g., plant debris, spores, bacteria and pollen (Pöschl et al., 2010). Internally mixed particles of sea salt and organic matter also can be produced via aerosol-cloud processing and fragmentation of organic-rich surface film layers dur-ing the burstdur-ing of air bubbles at the sea surface (Andreae et al., 2008). In general, the
25
mass closure analysis is in agreement with the results of single particle elemental com-position as observed by STXM-NEXAFS, which also showed a dominant abundance of organic particulate matter and ammoniated sulfates (see next section).
ACPD
15, 7837–7893, 2015Composition, microstructure, and
hygroscopic properties of
aerosols
E. F. Mikhailov et al.
Title Page
Abstract Introduction
Conclusions References
Tables Figures
◭ ◮
◭ ◮
Back Close
Full Screen / Esc
Printer-friendly Version Interactive Discussion
Discussion
P
a
per
|
Discussion
P
a
per
|
Discussion
P
a
per
|
Discussion
P
a
per
4.2 Aerosol microstructure – STXM-NEXAFS and TEM analysis
The microscopic analyses (light, x-ray, and electron microscopy) showed that the size range of the particles collected on the sampling substrates (Si4N3 membranes and TEM grids) is consistent with the aerosol size distribution in Fig. 2b. The majority of particles is present in the AM size range (0.3–1 µm), with a small number of larger CM
5
particles (>1 µm) (Fig. S2.1). Given that this collected particle ensemble adequately reflects the overall aerosol population during the focus period of this study, the purpose of the x-ray and electron microscopic analysis is to obtain a representative investigation of the microstructure and mixing state of individual aerosol particles.
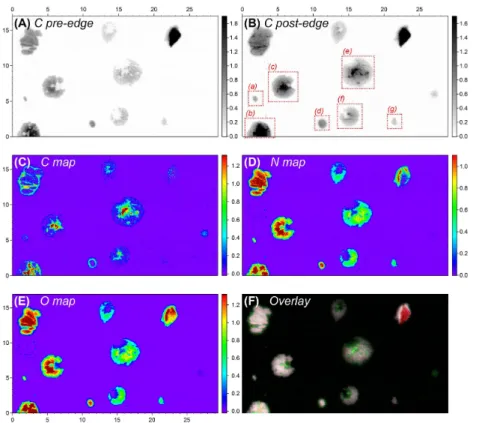
To characterize the overall elemental abundance in the collected particles, multiple
10
STXM maps of relatively large areas have been recorded from all samples and con-firm the bulk chemical analysis, showing that SO24−, NH+4, and OM are the predominant constituents of the aerosol (example shown in Fig. S2.2). X-ray spectroscopic evidence for the dominance of SO24−, NH+4, and OM in the particles is shown in Fig. S2.3. Based on the x-ray absorption spectra, the elemental ratio N/Osulfate=0.54±0.12 was
calcu-15
lated (ion chromatography results in Fig. 4 gave N/Osulfate=0.41±0.16). This suggests
a sulfate salt composition close to ammonium sulfate [(NH4)2SO4; N/O=0.5] and/or
letovicite [(NH4)3H(SO4)2; N/O=0.38]. The individual particles comprise highly
vari-able amounts of OM with OM/(NH4)2−xHx(SO4) mass ratios in the range of 0–0.9.
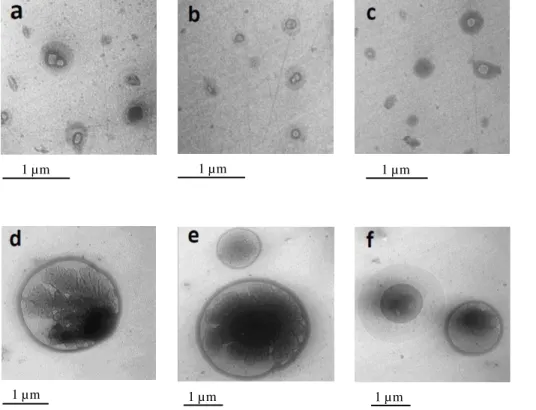
Elemental maps of typical particles are shown in Figs. 5 and 6. Figure 5 displays
par-20
ticles in the AM size range, which exhibit spherical or elliptical morphologies with vari-able OM contents and core-shell structure for a certain fraction of particles. In contrast, Fig. 6 shows comparably large particles (CM size range) with conspicuous internal structures and comparably high OM contents. The difference in OM content can also
be seen in Fig. 6. All internally mixed (NH4)2−xHx(SO4)/OM
−1
particles reveal a clear
25
ACPD
15, 7837–7893, 2015Composition, microstructure, and
hygroscopic properties of
aerosols
E. F. Mikhailov et al.
Title Page
Abstract Introduction
Conclusions References
Tables Figures
◭ ◮
◭ ◮
Back Close
Full Screen / Esc
Printer-friendly Version Interactive Discussion
Discussion
P
a
per
|
Discussion
P
a
per
|
Discussion
P
a
per
|
Discussion
P
a
per
|
in the STXM image, Fig. 6 (i.e., particles b, c, e, and f). Moreover, the TEM images also display OM shells of different thickness around the particles (Fig. 7).
4.3 Hygroscopic properties and KIM results
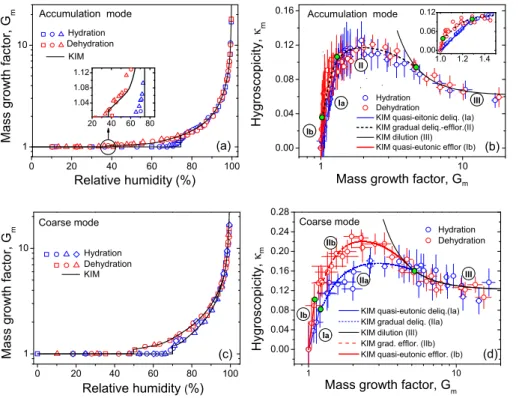
Figure 8a and c shows the mass growth factors, determined as a function of relative humidity upon hydration and dehydration for accumulation and coarse size modes as
5
detailed in Sect. 2.3.5. The onset of deliquescence at∼70 % RH is evident for the
ac-cumulation (Fig. 8a) and coarse (Fig. 8c) modes. Upon dehydration these size modes also exhibit an efflorescence transition at 37 % RH (insert in Fig. 8a) and at 49 % RH,
respectively. Figure 8c indicates a hysteresis for the CM mode starting at∼95 % RH,
i.e., well before the particles deliquescence. The kinetics and morphology effects of
10
the supermicron size particles might be responsible for this effect, as will be discussed
below.
From the measurement of theGm (RH) data we derived mass-based hygroscopicity parameters using Eqs. (3) and (4) and the Kelvin correction algorithm for submicron particles as described by Mikhailov et al. (2013, Appendix C). The corresponding plots
15
ofκmvs.Gmare shown in Fig. 8b and d for AM and CM, respectively. In all size modes the observed dependence of κm on Gm exhibits three distinctly different sections or
regimes of hygroscopicity as outlined in Sect. 3 and in Fig. 3. The model lines were obtained by inserting the fit parameters from Table 3 into Eqs. (6)–(8). For the quasi-eutonic regime (I), the combination of Eqs. (3) and (6) yields a constant water activity
20
value given byaw=(k
1+1)
−1
. This relation yields the following quasi-eutonic RH values characterizing the deliquescence (Ia) and (efflorescence (Ib)) phase transitions: 74.6 %
(36.7 %) for AM, and 70.0 % (49.8 %) for CM, respectively (Fig. 8b and d). The gradual deliquescence mode (II) extended up to 96 % RH for the coarse mode and even further up to 97 % for the accumulation mode, indicating the presence of sparingly soluble OC
25
in both fractions. In the dilution regime (III) (Eq. 8), the values of the fit parameterk5(III) obtained for submicron and supermicron samples are comparable: 0.45±0.05 for AM
and 0.50±0.08 for CM (Table 3). This is by a factor of 5 more than the value obtained
ACPD
15, 7837–7893, 2015Composition, microstructure, and
hygroscopic properties of
aerosols
E. F. Mikhailov et al.
Title Page
Abstract Introduction
Conclusions References
Tables Figures
◭ ◮
◭ ◮
Back Close
Full Screen / Esc
Printer-friendly Version Interactive Discussion
Discussion
P
a
per
|
Discussion
P
a
per
|
Discussion
P
a
per
|
Discussion
P
a
per
for an Amazon sample (k5(III)=0.09) in our previous study (Mikhailov et al., 2013).
The observed difference in the values can be explained by the high content of water
soluble species in the ZOTTO samples (Table 2) and the strong interaction between inorganic ions and organic molecules as a consequence.
Overall, the observed hygroscopicity behavior of the sub- and supermicron samples
5
is consistent with their chemical composition. The high fraction of organic carbon in the accumulation mode compared to the coarse mode results in a twofold decrease in the dilute hygroscopicity parameter,k6=κ0
m (Table 3) and a reduction of theκm top value
from ∼0.22 (Fig. 8d) to ∼0.12 (Fig. 8b). Moreover, the quasi-eutonic efflorescence
transition in the dehydration mode is decreased by the organic species at 15 % RH,
10
i.e., 35 % RH for AM vs. 50 % RH for CM (Fig. 5a and c). In the internally mixed or-ganic/inorganic particles the organic coating was found to decrease or even suppress the efflorescence of the inorganic salts (Choi et al., 2002; Brooks et al., 2003; Pant
et al., 2004; Braban et al., 2004; Mikhailov et al., 2004; Zardini et al., 2008), which can be explained by kinetic limitations caused by an ultra-viscous or gel-like or
semi-15
solid organic matrix with low molecular diffusivity (Mikhailov et al., 2009; Shiraiwa et al.,
2010) as will be discussed below.
4.4 Dilute kappa composition closure
Under the volume additivity assumption the dilute hygroscopicity parameter k6=κ0
m
can be converted to the Petters and Kreidenweis (2007) volume-based parameter,κv,
20
by the relation (Mikhailov et al., 2013):
κv=κ0
m
ρd
ρw (9)
Based on the ion balance from IC analysis (Table 2) and assuming that AS is repre-sentative for ammoniated sulfates, we estimated the mass of neutral compounds in the accumulation and coarse size modes, which are shown in Table 4 with their mass
25
ACPD
15, 7837–7893, 2015Composition, microstructure, and
hygroscopic properties of
aerosols
E. F. Mikhailov et al.
Title Page
Abstract Introduction
Conclusions References
Tables Figures
◭ ◮
◭ ◮
Back Close
Full Screen / Esc
Printer-friendly Version Interactive Discussion
Discussion
P
a
per
|
Discussion
P
a
per
|
Discussion
P
a
per
|
Discussion
P
a
per
|
parameters, the effective values ofρ
dandκv,pfor the ZOTTO samples have been
com-puted by weighted averaging of the properties of individual components:
ρd= X
i
fi ρi
!−1
(10)
κv,p=X
i
εiκv,i (11)
Equation (11) is the Zdanovskii, Stokes, and Robinson (ZSR) mixing rule (Petters and
5
Kreidenweis, 2007) whereκv,p denotes the predicted (p) hygroscopicity based on the volume fraction, εi, and the hygroscopicity,κv,i, of the ith component in the sample. From Eq. (10) and the ρi, fi pairs (Table 4) it follows that for submicron and
super-micron particles the average weighted bulk densities are 1.54 g cm−3and 1.66 g cm−3, respectively (Table 5). Inserting these values and the KIM-derived hygroscopicity
pa-10
rameters,k6=κm0 (Table 3), into Eq. (9) yieldsκv,t=0.094 for the accumulation mode
andκv,t=0.21 for the coarse mode (Table 5), where the subscript (t) denotes the
hy-groscopicity related to the total dry particle mass.
As water soluble compounds are the major contributors to hygroscopic growth, it is useful to further transcribe the original Eq. (2) as follows:
15
Gm, ws=mw +m
d, ws
md, ws , (12)
whereGm, ws is the mass growth factor normalized to the mass of the neutral water soluble (ws) compounds. Accordingly, theGm, ws can be calculated from
Gm, ws=
1
fws(Gm−1)+1, (13)
wherefws=m
d, ws/mdis the mass fraction of the water soluble compounds in the PM,
20
ACPD
15, 7837–7893, 2015Composition, microstructure, and
hygroscopic properties of
aerosols
E. F. Mikhailov et al.
Title Page
Abstract Introduction
Conclusions References
Tables Figures
◭ ◮
◭ ◮
Back Close
Full Screen / Esc
Printer-friendly Version Interactive Discussion
Discussion
P
a
per
|
Discussion
P
a
per
|
Discussion
P
a
per
|
Discussion
P
a
per
Kelvin correction algorithm (Mikhailov et al., 2013), we converted theGm, ws, RH pairs
into κm, ws. The obtained dependencies ofκm, ws on Gm, ws in the dilution regime and KIM fit lines (Eq. 8) are shown in Fig. 9. The corresponding best fit parameter (dilute hygroscopicity) κm, ws0 =k6 for AM and CM and its volume-based derivative κv, ws are
given in Table 5. The volume-based hygroscopicityκv, ws was calculated from Eq. (9)
5
as follows
κv, ws=κ0
m, ws×ρd, ws/ρw, (14)
whereρd, wsis the average density of the water soluble compounds in the dry particles, which was determined by inserting into Eq. (10) the mass fractions of water soluble solutes,fws,i andρd,i (Table 4).
10
As expected, the obtained κv, ws is higher than κv, t: the ratio κv, ws/κv, t is
approxi-mately 1.6 for both size modes (Table 5). Since the hygroscopicityκv, wsaccounts only for water soluble species, the obtained values of 0.15 for AM and 0.36 for CM (Table 5) can be regarded as an upper limit characteristic for boreal aerosol particles in Siberia during the growing season. Theκv, wsvalue of 0.15 obtained here for the accumulation
15
mode is comparable to the CCN-derived overall median value ofκv=0.15 reported by
Gunthe et al. (2009) for tropical rainforest air during the wet season in central Amazonia and the averageκv value of 0.16 measured by Levin et al. (2014) at a forested moun-tain site in Colorado from July to August. We are not aware of any other field data of
κv for the coarse mode at remote continental sites, but the elevated CM value of 0.36
20
compared to that for the accumulation mode of 0.15 is consistent with the chemical analysis results indicating a relatively high content of hygroscopic ammonium sulfate in CM (fws, AS=0.72, vs. of 0.38 for AM) (Table 4).
We now compare the hygroscopicity, κv, ws, estimated from FDHA measurements with the ZSR-predicted hygroscopicity, κv, p. Accounting for the fact that AS, WSOM,
25
ACPD
15, 7837–7893, 2015Composition, microstructure, and
hygroscopic properties of
aerosols
E. F. Mikhailov et al.
Title Page
Abstract Introduction
Conclusions References
Tables Figures
◭ ◮
◭ ◮
Back Close
Full Screen / Esc
Printer-friendly Version Interactive Discussion
Discussion
P
a
per
|
Discussion
P
a
per
|
Discussion
P
a
per
|
Discussion
P
a
per
|
AM and CM can be respectively reduced to:
κv, p=κ
v, ASεws, AS+κv, WSOMεws, WSOM, (15)
κv, p=κv, ASεws, AS+κv, sea saltεws, sea salt+κv, WSOMεws, WSOM, (16)
whereεws,i is the volume fraction of water soluble compounds scaled to total water soluble PM (Table 4). The application of these simplified equations results in a∼5 %
5
underestimation ofκv, pfor both size modes.
The simple mixing rule (Eqs. 15 and 16) with corresponding pairs of CCN-derived
κv,i and εws,i (Table 4) yields κv, p=0.27 for AM and κ
v, p=0.53 for CM. That is, the
estimates from the mixing rule exceed the FDHA-derivedκv, ws values (Table 5) by
fac-tors of 1.8 and 1.5 for the accumulation and coarse mode, respectively. The observed
10
discrepancy is too large to be explained by experimental and PM chemical analysis uncertainties.
The high content of sparingly soluble organic matter produced by oxidation of bio-genic emissions (Mikhailov et al., 2015) can account for the inconsistency between the ZSR predictedκv, pand FDHA-derivedκv, wsvalues. In mixed particles the organic
15
coating can reduce the water transport across the surface by acting as physical barrier. Moreover, at high content of the sparingly soluble compounds this effect will strongly
depend on the water activity range, as these species exhibit hygroscopic growth at
aw close to 1. This particularly leads to a discrepancy by a factor of 5–10 between SOA hygroscopicity determined from sub- and supersaturation experiments (Petters
20
and Kreidenweis, 2007; Prenni et al., 2007; Wex et al., 2009; Petters et al., 2009). In our FDHA experiment the hygroscopicity,κm, ws0 , was obtained in the dilution mode (Eq. 8) in the 96–99.4 % RH range. Depending on the type of SOA, theκv in a given RH range can vary from 0.01 to 0.05 (Wex et al., 2009; Petters et al., 2009), but it is still less than the values ofκv=0.1±0.04 obtained in CCN experiments (Petters and
25
Kreidenweis, 2007; Gunthe et al., 2009; Wex et al., 2009; Chang et al., 2010; Engel-hart et al., 2011). Thus, due to the uncertainty ofκv, the last term of Eqs. (15) and (16) can vary by a factor of 10, which translates into 30 and 3 % uncertainty inκv, p for the
ACPD
15, 7837–7893, 2015Composition, microstructure, and
hygroscopic properties of
aerosols
E. F. Mikhailov et al.
Title Page
Abstract Introduction
Conclusions References
Tables Figures
◭ ◮
◭ ◮
Back Close
Full Screen / Esc
Printer-friendly Version Interactive Discussion
Discussion
P
a
per
|
Discussion
P
a
per
|
Discussion
P
a
per
|
Discussion
P
a
per
accumulation and coarse mode, respectively. Nevertheless, this uncertainty does not cover the observed difference between the measuredκ
v, ws and predictedκv, p values.
As mentioned above and as will be shown below for the internally mixed particles, the organic coating can limit the uptake of water by inorganic species and may thus decrease the hygroscopicity especially in sub-saturated water vapor.
5
Based on the ZSR mixing rule (Eqs. 15 and 16), we can estimate the volume fraction of ammonium sulfate,εws, AS, p, that is involved in the hygroscopic growth. Inserting in Eq. (15) the KIM-derivedκv, ws=0.15 and experimental hygroscopicitiesκ
v, AS=0.57,
κv, WSOM=0.01 and 0.05 obtained for sub-saturated conditions at 96–99.4 % RH
(Ta-ble 4, values are in brackets) yields for the accumulation modeεws, AS, p=0.23±0.02,
10
while the total volume fraction εws, AS is 0.33 (Table 4). A similar calculation for the coarse mode using Eq. (16) with the KIM-derived κv, ws=0.36 leads accordingly to
εws, AS, p=0.48±0.01 vs.εws, AS=0.72 (Table 4). Based on these estimations one can
assume that in sub-saturated conditions (96–99.4 % RH) the inorganic compounds were not completely dissolved: approximately 30 % of ammonium sulfate in AM and
15
CM, are isolated by sparingly soluble organic species, thereby reducing the hygro-scopicity of the ZOTTO samples.
A similar positive difference (up to 77 %) between predicted (from chemical
analy-sis) and CCN-derivedκv values was observed for pristine tropical rainforest aerosols studied during the AMAZE-08 campaign in central Amazonia (Gunthe et al., 2009).
Al-20
though in the Amazon experiment the dry particle size range was 30–300 nm, we do not exclude the possibility that the observed deviation was also caused by sparingly soluble SOA, which in the time scale of the CCN measurement (seconds or less) could impede the water transport to the more hygroscopic species, like AS.
4.5 Water uptake kinetics and microstructural rearrangements
25