www.atmos-chem-phys.net/11/7319/2011/ doi:10.5194/acp-11-7319-2011
© Author(s) 2011. CC Attribution 3.0 License.
Chemistry
and Physics
Chemical characterization of aerosols at the summit of Mountain
Tai in Central East China
C. Deng1, G. Zhuang1, K. Huang1, J. Li1, R. Zhang1, Q. Wang1, T. Liu1, Y. Sun2, Z. Guo1, J. S. Fu3, and Z. Wang2 1The Center for Atmospheric Chemistry Study, Department of Environmental Science & Engineering, Fudan University,
Shanghai 200433, China
2The Institute of Atmospheric Physics, Chinese Academy of Science, LAPC, Beijing 100029, China
3Department of Civil and Environmental Engineering, The University of Tennessee, Knoxville, TN 37996, USA
Received: 13 July 2010 – Published in Atmos. Chem. Phys. Discuss.: 2 September 2010 Revised: 18 March 2011 – Accepted: 16 July 2011 – Published: 25 July 2011
Abstract. PM2.5 and TSP samples were collected at the
summit of Mountain Tai (MT) (1534 m a.s.l.) in spring 2006/2007 and summer 2006 to investigate the characteris-tics of aerosols over central eastern China. For comparison, aerosol samples were also collected at Tazhong, Urumqi, and Tianchi in Xinjiang in northwestern China, Duolun and Yulin in northern China, and two urban sites in the megac-ities, Beijing and Shanghai, in 2007. Daily mass concen-trations of TSP and PM2.5 ranged from 39.6–287.6 µg m−3
and 17.2–235.7 µg m−3 respectively at the summit of MT. Averaged concentrations of PM2.5 showed a pronounced
seasonal variation with higher concentration in summer than spring. 17 water-soluble ions (SO24−, NO−3, Cl−, F−, PO34−, NO−2, CH3COO−, CH2C2O24−, C2H4C2O24−,
HCOO−, MSA, C2O24−, NH+4, Ca2+, K+, Mg2+, Na+), and
19 elements of all samples were measured. SO24−, NO−3, and NH+4 were the major water-soluble species in PM2.5,
accounting for 61.50 % and 72.65 % of the total measured ions in spring and summer, respectively. The average ra-tio of PM2.5/TSP was 0.37(2006) and 0.49(2007) in spring,
while up to 0.91 in summer, suggesting that aerosol parti-cles were primarily comprised of fine partiparti-cles in summer and of considerable coarse particles in spring. Crustal ele-ments (e.g., Ca, Mg, Al, Fe, etc.) showed higher concen-tration in spring than summer, while most of the pollution species (SO24−, NO−3, K+, NO−
2, NH + 4, Cl
−, organic acids,
Pb, Zn, Cd, and Cr) from local/regional anthropogenic emis-sions or secondary formation presented higher concentration in summer. The ratio of Ca/Al suggested the impact of Asian dust from the western deserts on the air quality in this region.
Correspondence to:G. Zhuang
(gzhuang@fudan.edu.cn)
The high concentration of K+ in PM2.5 (4.41 µg m−3)and
its good correlation with black carbon (r=0.90) and oxalic acid (r=0.87) suggested the severe pollution from biomass burning, which was proved to be a main source of fine parti-cles over central eastern China in summer. The contribution of biomass burning to the fine particle at MT accounted for 7.56 % in spring and 36.71 % in summer, and even reached to 81.58 % on a day. As and Pb were two of the most en-riched elements. The long-range transport of aerosols spread the heavy pollution from coal-mining/coal-ash to everywhere over China. Anthropogenic air-pollution was evidently rather severe at MT, though it has been declared by UNESCO to be a World Heritage site.
1 Introduction
Aerosols have potential impact on the global atmospheric chemistry, cloud properties and precipitation development (Tegen et al., 1996; Arimoto, 2001; Rastogi and Sarin, 2005, 2006). Anthropogenic aerosols, including the primar-ily emissions and the secondary aerosols, are mainly in fine mode, which has much more adverse impact on climate and hydrologic cycling (Kaufman et al., 2002), visibility (Chan et al., 1999), and human health (Dockery et al., 1993).
Eastern China, including provinces of Hebei, Shandong, Jiangsu, Zhejiang, and the mega-city, Shanghai, is the area with rapidest growth in economy, e.g. Shandong is one of the two provinces in China, whose GDP exceeded 3×10¹¹ RMB in 2008 (http://finance.people.com.cn/), which resulted in the increasing emissions of SO2, NO2, and particulate
is located in Shandong and surrounded by Jiangsu, Anhui, Henan, and Hebei provinces. Aerosols, from the summit of MT could be the representative of the regional pollution. Pre-vious study found that CO and O3at the top of MT exhibited
high in summer and low in winter, which was attributed to the seasonal changes of meteorological conditions and seasonal variations of sources (Gao et al., 2005; Wang et al., 2001). In addition, VOCs, O3, and CO were all higher than those
observed at other rural mountainous sites (Suthawaree, et al., 2010), which might be due to the strong sources surrounded. Average concentration of peroxides at MT was much lower than that measured at some rural mountain sites, suggesting that significant removal processes took place in this region (Ren et al., 2009). O3and CO play key roles in determining
the oxidizing capacity of the atmosphere in the presence of sunlight, and they are ideal tracers for anthropogenic pollu-tions (Novelli et al., 1994, 1998). VOC, O3, CO, and
per-oxide are all related to the formations of secondary aerosols in ambient air, which suggested that the characteristics of the aerosols at MT might be different from those at other sites.
Mineral aerosols through long-range transport may di-rectly or/and indidi-rectly affect the properties of air mass by providing surfaces for many chemical and physical processes and serving as carriers of anthropogenic substances, which would affect the global climate/environmental change (Guo et al., 2004; Dentener et al., 1996; Sun et al., 2004; Liu et al., 2002). Northwestern China is one of the main source areas of Asian dust that can be transported to hundred and thousand miles away, passing through central and eastern China and even to the Pacific. The composition of min-eral aerosols would subject to transform due to adsorbing gaseous species, surface reactions, and coagulation with an-thropogenic aerosol on the pathway during transport.
Little information on aerosols at the summit of MT is available. The studies on aerosols reported in literatures mostly represented those samples collected from ground level, and limited knowledge has been acquired on the aerosols at high elevation over the world. MT is just in the downstream of Asian Dust from northwestern China. There-fore, the summit of MT is an ideal site to examine the long-range transport of Asian dust and to observe the mixing of dust with anthropogenic aerosol. This paper presents the characteristics, sources, formation processes, and the rela-tion with the long-range transport of aerosols collected at MT, which would reveal the air quality in PBL (Planetary Boundary Layer) over central east China.
2 Experimental
2.1 Sampling
TSP and PM2.5 aerosol samples were simultaneously
col-lected at the meteorological observation station located at the summit of MT (36.25◦N, 117.10◦E) in spring (14 March–
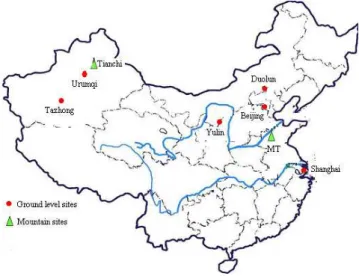
Fig. 1.Map of the sampling sites in this study.
6 May) and summer (2–30 June) in 2006 and in spring (26 March–18 May) in 2007. The sampling duration of each sample was generally 24 h, except a few samples, which was 48 h. All of the samples were collected on What-man® 41 filters (Whatman Inc., Maidstone, UK) by medium-volume samplers (model: (TSP/PM10/PM2.5)-2, flow rate:
77.59 L min−1). The samples were put in polyethylene plas-tic bags right after sampling and reserved in a refrigera-tor. All of these filters were weighed before and after sam-pling with an analytical balance (Sartorius 2004MP, reading precision 10 µg) after stabilizing under constant temperature (20±1◦C) and humidity (40±1.5 %) for over 24 h. All the
procedures were strictly quality-controlled to avoid any pos-sible contamination of the samples. For comparison, aerosol samples were also collected at Tazhong, Urumqi, Tianchi in Xinjiang in northwestern China, Duolun and Yulin in north-ern China, and in two urban sites in the megacities, Beijing and Shanghai (Fig. 1). Information of all samples is list in Table 1. The detailed analytical procedures were given else-where (Zhuang et al., 2001).
2.2 Chemical analysis
2.2.1 Ion analysis
One-fourth of each sample and blank filter was extracted ul-trasonically by 10 mL deionized water (18 Mcm−1). Af-ter passing through microporous membranes (pore size, 0.45 µm; diameter, 25 mm; made by the affiliated plant of Beijing chemical school), the filtrates were determined for pH with a pH meter (model, Orion 818). Each fil-trate was stored at 4◦C in a clean tube for IC analysis.
12 anions (SO24−, NO−3, Cl−, F−, PO3−
4 , NO
−
2, CH3COO
−,
HCOO−, MSA, C2O24−, CH2C2O42−, C2H4C2O24−) and 5
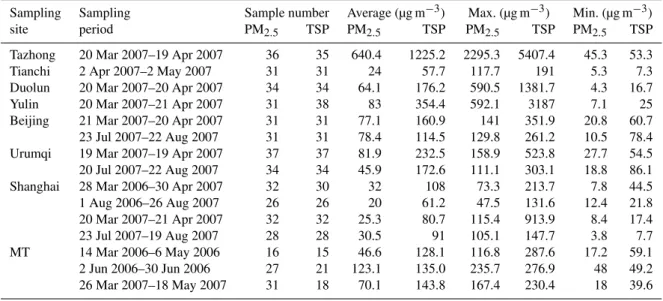
Table 1.Mass concentrations of aerosols (µg m−3)at the summit of MT and other sampling sites.
Sampling Sampling Sample number Average (µg m−3) Max. (µg m−3) Min. (µg m−3)
site period PM2.5 TSP PM2.5 TSP PM2.5 TSP PM2.5 TSP
Tazhong 20 Mar 2007–19 Apr 2007 36 35 640.4 1225.2 2295.3 5407.4 45.3 53.3
Tianchi 2 Apr 2007–2 May 2007 31 31 24 57.7 117.7 191 5.3 7.3
Duolun 20 Mar 2007–20 Apr 2007 34 34 64.1 176.2 590.5 1381.7 4.3 16.7
Yulin 20 Mar 2007–21 Apr 2007 31 38 83 354.4 592.1 3187 7.1 25
Beijing 21 Mar 2007–20 Apr 2007 31 31 77.1 160.9 141 351.9 20.8 60.7
23 Jul 2007–22 Aug 2007 31 31 78.4 114.5 129.8 261.2 10.5 78.4
Urumqi 19 Mar 2007–19 Apr 2007 37 37 81.9 232.5 158.9 523.8 27.7 54.5
20 Jul 2007–22 Aug 2007 34 34 45.9 172.6 111.1 303.1 18.8 86.1
Shanghai 28 Mar 2006–30 Apr 2007 32 30 32 108 73.3 213.7 7.8 44.5
1 Aug 2006–26 Aug 2007 26 26 20 61.2 47.5 131.6 12.4 21.8
20 Mar 2007–21 Apr 2007 32 32 25.3 80.7 115.4 913.9 8.4 17.4
23 Jul 2007–19 Aug 2007 28 28 30.5 91 105.1 147.7 3.8 7.7
MT 14 Mar 2006–6 May 2006 16 15 46.6 128.1 116.8 287.6 17.2 59.1
2 Jun 2006–30 Jun 2006 27 21 123.1 135.0 235.7 276.9 48 49.2
26 Mar 2007–18 May 2007 31 18 70.1 143.8 167.4 230.4 18 39.6
Ion Chromatography (Model: Dionex 3000), which consists of a separation column (Dionex Ionpac AS11 for anion and CS12A for cation), a guard column (Dionex Ionpac AG 11 for anion and AG12A for cation), a self-regenerating sup-pressed conductivity detector (Dionex Ionpac ED50), and a gradient pump (Dionex Ionpac GP50). The gradient mobile phase generated by EG-3000 was used for anion detection, while the weak acid eluent (20 mM MSA) for cation detec-tion. The recovery of each ion was in the range of 80–120 %. The relative standard deviation of each ion was less than 5 % for reproducibility test. The limits of detection (S/N = 3) were less than 0.04 mg L−1for anions and 0.006 mg L−1for cations. The quality assurance was routinely carried out by using Standard Reference Materials (GBW 08606) produced by National Research Center for Certified Reference Mate-rials, China. Blank values were subtracted from sample de-terminations. The details were given elsewhere (Yuan et al., 2003).
2.2.2 Element analysis
Half of each sample filter and blank filter was digested at 170◦C for 4 h in high-pressure Teflon digestion vessel with 3 mL concentrated HNO3, 1 mL concentrated HCl, and 1 mL
concentrated HF. After cooling, the solutions were dried, and then added 0.1 mL concentrated HNO3, and diluted to 10 mL
with deionized water (resistivity of 18 Mcm−1). Total 19
elements (Al, Fe, Mn, Mg, Ti, Na, Sr, Ca, Co, Cr, Ni, Cu, Pb, Zn, Cd, V, S, As and P) were determined by Induc-tively Coupled Plasma Atomic Emission Spectroscopy (ICP-AES, model: ULTIMA, made by JOBIN-YVON Company, France). All the reagents used were of the highest grade. All the preparation was carried out in a Class-100 clean bench. The recovery rates were measured with standard addition,
and the recoveries of each element were in the range of 95 % to 105 %. The relative standard deviations of each element were less than 2 % for reproducibility test. The geochem-istry reference matter (TBW07401) made by the Center for National Standard Matter was also analyzed simultaneously to check the reliability of analysis (Han et al., 2005). The detection limits (3 s) for typical elements of Al, As, Ca, Cd, Co, Fe, Pb, Cu, and Zn were 1.5, 5, 0.03, 0.35, 0.6, 0.5, 5, 0.6, and 0.3 µg L−1, respectively. Black carbon (BC)
was analyzed with Smokerstain Reflectometer (UK, Model, M43D). The detailed analytical procedures were given else-where (Zhuang et al., 2001).
2.3 Meteorological data, fire spot map and trace gases
The meteorological data, including temperature, relative hu-midity (RH), dew point, wind speed, wind direction, at-mospheric pressure, visibility etc., were collected from http://www.wunderground; Data of SO2, NO2 in
Shang-hai and MT were collected from http://www.envir.gov.cn and http://www.tahb.gov.cn; Fire spot data were got from MODIS Global Fire Mapping Service (http://firefly.geog. umd.edu/firemap/); O3 and CO were detected with a
Table 2.Mass concentrations (µg m−3)and size distributions of aerosols at the summit of MT and other sampling sites.
Sites time Spring Summer
PM2.5 TSP PM2.5/TSP PM2.5 TSP PM2.5/TSP
Shanghai 2003–2005a 135.0 293.0 0.46 72.0 167.0 0.43
2006 32.0 108.0 0.30 20.0 61.2 0.33
2007 25.3 80.7 0.31 30.5 91.0 0.34
MT 2006 46.6 128.1 0.37 123.1 135.0 0.91
2007 70.1 143.8 0.49
Urumqi 2007 81.9 232.5 0.35 45.9 172.6 0.27
Beijing 2002b 212.6 1410.1 0.15 79.6 224.6 0.35
2007 77.1 160.9 0.48 78.4 114.5 0.68
Duolun 2007 64.1 176.2 0.36
Tianchi 2007 24.0 57.7 0.42
Yulin 2007 83.0 354.4 0.23
aWang et al. (2006b);bWang et al. (2006a).
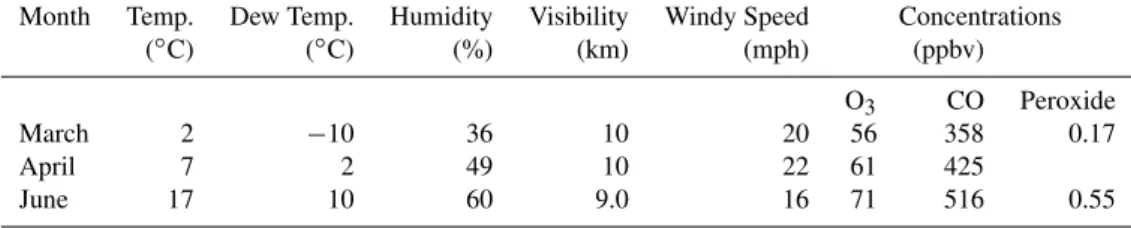
Table 3.Meteorological conditions and concentrations of gases (O3, CO, Peroxide) in ambient air at MT.
Month Temp. Dew Temp. Humidity Visibility Windy Speed Concentrations
(◦C) (◦C) (%) (km) (mph) (ppbv)
O3 CO Peroxide
March 2 −10 36 10 20 56 358 0.17
April 7 2 49 10 22 61 425
June 17 10 60 9.0 16 71 516 0.55
Measurement method of peroxide: A 26-turn coil was used to strip the peroxides out of the air and into a liquid phase by water (0.42 mL min−1), which was sucked through a
10-turn coil (0.42 mL min−1) at which buffer (potassium hydrogen phthalate (KHP, Fisher Scientific) and tetrasodium ethylenediaminetetraacetate (Na4EDTA, Fluka Scientific))
and fluorescence (POPHA (Fluka Scientific), horseradish peroxidase (Sigma Chemical Co.), KHP, and Na4EDTA) solutions were added, then the liquid entered a pH booster cell
that contained 30 % ammonium hydroxide (Sigma Chemical Co.) to adjust solution pH from 6 to approximately 10. After going through a debubbler (0.42 mL min−1), where the
bubbles were removed, the fluorescence of the dimmer was detected using a fluorimeter (Spectrovision FD-100, Groton Technology Inc., Concord, MA) with excitation and emission
wavelength of 326 nm and 400 nm, respectively.
3 Results and discussion
3.1 Overview of particle matters at summit of MT
3.1.1 Mass concentrations of PM and size distribution
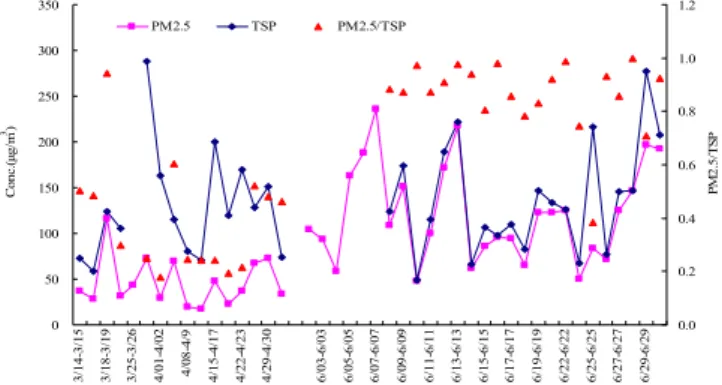
Temporal variations of mass concentrations and the corre-sponding deviations of PM2.5and TSP at MT and other
sam-pling sites are summarized in Fig. 2 and Tables 1–2. TSP were relatively seasonal stable (128.1 µg m−3/143.8 µg m−3
in spring 2006/2007 and 135.0 µg m−3 in summer 2006),
while PM2.5had highly seasonal variation with much higher
concentration in summer 2006 (123.1 µg m−3)than in spring 2006/2007 (46.6 µg m−3/70.1 µg m−3)at MT. PM2.5was
rel-atively higher in spring 2007 (26 March–18 May) compared to that in spring 2006 (14 March–6 May), which was likely attributed to the different sampling periods and it will be in-terpreted in Sect. 3.2.1. TSP from MT was comparable with those from other sampling sites in ground level, and there
was no obvious decrease at a height of 1534 m compared to those at ground level, as expected. Both TSP and PM2.5
at MT were much higher than those at Tianchi that is also located at a high land (1900 m). Aerosol pollutions at MT were as severe as or even worse than those at ground level, e.g. PM2.5at MT were much higher than those at other sites,
including the sites in megacities, Beijing and Shanghai, at ground level in summer. The average ratio of PM2.5/TSP
0 50 100 150 200 250 300 350 3/ 14-3/ 15 3/ 18-3/ 19 3/ 25-3/ 26 4/ 01-4/ 02 4/ 08-4/ 9 4/ 15-4/ 17 4/ 22-4/ 23 4/ 29-4/ 30 6/ 03-6/ 03 6/ 05-6/ 05 6/ 07-6/ 07 6/ 09-6/ 09 6/ 11-6/ 11 6/ 13-6/ 13 6/ 15-6/ 15 6/ 17-6/ 17 6/ 19-6/ 19 6/ 22-6/ 22 6/ 25-6/ 25 6/ 27-6/ 27 6/ 29-6/ 29 Co n c .( μ g/ m 3) 0.0 0.2 0.4 0.6 0.8 1.0 1.2 PM2 .5 /T S P
PM2.5 TSP PM2.5/TSP
Fig. 2.Daily variations of TSP and PM2.5from 14 March to 30 June
in 2006 at MT.
was even higher than the summit of MT. On the contrary, the height of the PBL in spring was so compressed that it used to be below the summit of MT, and the Mountain-valley breezes could not fully develop due to the weak solar radia-tion and the strong regional winds in ground level. Hence, the transport upward of the regional pollutants to the summit was less frequent in spring than in summer, which resulted in lower concentrations of fine particles in spring. Besides, dust storms mostly occur in spring and MT is located on the very pathway of its long-range transport from central Asia to the northern America (Arimoto et al., 1996; Zhang et al., 1997; Sun et al., 2010). Thus, in those days with high wind speed in spring, higher ratio of those coarse particles to the total aerosol mass was often observed even at elevation of more than 1500 m.
3.1.2 Ionic and elemental composition of the particles at MT
Mass concentrations of ions in PM2.5 and TSP at MT are
listed in Table 4. Water soluble ions contributed 10.82 % of TSP and 23.99 % of PM2.5in mass in spring, while 40.89 %
and 41.08 % in summer. This result revealed evidently that the secondary aerosol possessed much larger part in summer than in spring. The ratios of total ions to the total mass in PM2.5 were higher than those in TSP both in summer and
spring, suggesting that the pollution components, such as SO24−, NH+4, NO−3, existed more in fine mode. These three major water soluble ions accounted for 61.50 % in spring and 72.65 % in summer of the total ions measured in PM2.5,
while 69.20 % and 71.47 % in TSP, respectively (Table 5). Also, higher concentration of K+, the tracer of the biomass source, in summer was observed, which could account for 8.26 % of total ions in TSP. Whereas, higher concentration of Ca2+, likely more from the Asian dust source, in spring,
accounted for 21.93 % of the total ions in TSP.
Water-soluble ions are proved to play key roles in many atmospheric processes, such as cloud formation, visibility degradation, solar radiation, acidification of cloud, rain, and
Table 4.Water-soluble ions in PM2.5and TSP and the
correspond-ing ratios of summer/sprcorrespond-ing at MT.
Concentration(µg m−3) Ratio
Spring Summer (Summer/Spring)
TSP PM2.5 TSP PM2.5 TSP PM2.5
NH+4 1.48 0.88 10.40 9.56 7.03 10.86
Na+ 0.68 0.56 1.36 1.28 2.00 2.29
K+ 0.72 0.48 4.56 4.41 6.33 9.19
Mg2+ 0.24 0.16 0.24 0.16 1.00 1.00
Ca2+ 3.04 1.72 2.88 1.76 0.95 1.02
F− 0.13 0.11 0.02 0.03 0.15 0.27
Cl− 0.83 0.65 2.18 2.30 2.63 3.54
MSA 0.02 0.01 0.22 0.54 11.00 54.00
HCOO− 0.12 0.06 0.12 0.16 1.00 2.67
CH3COO− 0.27 0.23 1.83 1.32 6.78 5.74
C2O24− 0.15 0.10 0.37 0.48 2.47 4.80
CH2C2O24− 0.42 0.22 0.65 0.49 1.55 2.23
C2H4C2O24− 0.02 0.01 0.04 0.10 2.00 10.00
NO−3 3.61 3.24 8.82 8.21 2.44 2.53
SO24− 4.47 2.72 20.73 20.26 4.64 7.45
NO−2 0.03 0.03 0.12 0.14 4.00 4.67
PO34− 0.01 n.a 0.01 0.02 1.00
Total ions (CIC) 13.86 11.18 54.47 51.53 3.93 4.61
Total mass (CP) 128.1 46.6 135 123.1 1.05 2.64
CIC/CP(%) 10.82 23.99 40.35 41.86 3.73 1.74
Ca2+/Total ions 21.93 15.38 5.29 3.42
K+/Total ions 5.19 4.29 8.37 8.56
CIC: Total mass concentrations of water- soluble ions (µg m−3).
CP: Mass concentrations of TSP or PM2.5(µg m−3).
fog, and haze formation because of their affinity with water (Tsai et al., 1999; Novakov et al., 1993; Matsumoto et al., 1997; Facchini et al., 2000). Haze mostly occurred in stable, warm, and moist air, and was characterized by the high level of fine particles with high percentage of certain water soluble ions, such as SO24−, NH+4, and NO−3, in the aerosols. Certain characteristics of the aerosols collected at MT in summer and spring and at Beijing in dust, haze, and clear days are sum-marized in Table 5. CIC/CP, C(S+N+A)/CIC, SOR and NOR
at MT in summer were very similar to those in haze days in Beijing, suggesting that haze could occur frequently in sum-mer at the summit of MT, which could be proved by the lower visibility (9.0 km) on average at MT.
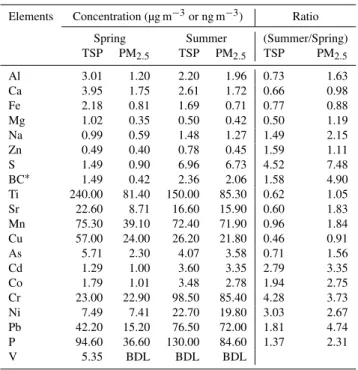
The concentrations of nineteen elements and black carbon (BC) in aerosols at MT are listed in Table 6, which showed clearly that crustal element (Ca, Ma, Al, Mn, Ti, Sr, and Na) were higher in spring, while pollution elements (Pb, Cr, Cd, Zn, Ni, S, BC), except As and Cu, were higher in summer. The elements could be classified into four groups according to their enrichment factors (EFs = (X/Al)aerosol/(X/Al)crust):
Table 5.SOR, NOR of ambient air and main water-soluble ions in PM2.5and TSP at MT and Beijing.
MT Beijing∗
Spring Summer Haze days Dust days Clear days
PM2.5/TSP 0.37 0.91 0.39 0.21 0.31
CIC/CP(%) PM2.5 23.99 41.08 53.20 9.30 15.20
TSP 10.82 40.89 33.30 3.30 32.2
C(S+N+A)/CIC(%) PM2.5 61.50 72.65 87.10 63.70 73.00
TSP 69.20 71.47 79.90 45.70 66.10
SOR PM2.5 0.08 0.31 0.27 0.29 0.15
TSP 0.09 0.32 0.24 0.25 0.17
NOR PM2.5 0.09 0.22 0.22 0.09 0.13
TSP 0.10 0.26 0.29 0.16 0.18
C(S+N+A): The sum of the concentrations of SO24−, NO
−
3, and NH
+
4 (µg m
−3).
CIC: Total mass concentrations of water- soluble ions (µg m−3).
CP: Mass concentrations of TSP or PM2.5(µg m−3).
SOR: Sulfur oxidation ratio, SOR =nSO24−/(nSO42−+nSO2).
NOR: Nitrogen oxidation ratio, NOR =nNO−3/(nNO3−+nNO2)(nrefers to the molar concentration).
∗Wang et al. (2006a).
Table 6. Concentrations (µg m−3)of elements in PM2.5and TSP
and the corresponding ratios of summer/spring at MT.
Elements Concentration (µg m−3or ng m−3) Ratio
Spring Summer (Summer/Spring)
TSP PM2.5 TSP PM2.5 TSP PM2.5
Al 3.01 1.20 2.20 1.96 0.73 1.63
Ca 3.95 1.75 2.61 1.72 0.66 0.98
Fe 2.18 0.81 1.69 0.71 0.77 0.88
Mg 1.02 0.35 0.50 0.42 0.50 1.19
Na 0.99 0.59 1.48 1.27 1.49 2.15
Zn 0.49 0.40 0.78 0.45 1.59 1.11
S 1.49 0.90 6.96 6.73 4.52 7.48
BC∗ 1.49 0.42 2.36 2.06 1.58 4.90
Ti 240.00 81.40 150.00 85.30 0.62 1.05
Sr 22.60 8.71 16.60 15.90 0.60 1.83
Mn 75.30 39.10 72.40 71.90 0.96 1.84
Cu 57.00 24.00 26.20 21.80 0.46 0.91
As 5.71 2.30 4.07 3.58 0.71 1.56
Cd 1.29 1.00 3.60 3.35 2.79 3.35
Co 1.79 1.01 3.48 2.78 1.94 2.75
Cr 23.00 22.90 98.50 85.40 4.28 3.73
Ni 7.49 7.41 22.70 19.80 3.03 2.67
Pb 42.20 15.20 76.50 72.00 1.81 4.74
P 94.60 36.60 130.00 84.60 1.37 2.31
V 5.35 BDL BDL BDL
BDL:Below detection limits; BC: Black carbon;∗Unit after BC: ng m−3.
and lower in PM2.5, while pollution elements were higher in
PM2.5and lower in TSP. EFs of As and Pb exhibited
differ-ent seasonal variations with higher EF of Pb in summer and higher EF of As in spring.
μ
0 1 10 100 1000 10000
Al Fe Ti Mg Na Sr Ca Mn Co Cu Ni Cr Zn S As Pb Al Fe Ti Mg Na Sr Ca Mn Co Cu Ni Cr Zn S As Pb
Spring Summer
EF
s
T SP PM2.5
Fig. 3. Enrichment factors (EFs) of elements at MT in spring and
summer, 2006.
3.1.3 Acidity of the aerosols at MT
Figure 4 shows the variations of pH of the filtrates of aerosols at MT, and it indicated that pH decreased obviously from spring to summer. The mean pH values of the aqueous fil-trates of aerosols collected at MT and other sampling sites are compared in Table 7. The aerosols at MT showed higher acidity for both PM2.5 (pH = 4.62) and TSP (pH = 4.92)
in summer in comparison with the weak acidity of PM2.5
Table 7.pH of aqueous filtrates of PM2.5and TSP aerosols at different sampling sites.
Sites Spring Summer Reference
PM2.5 TSP PM2.5 TSP
MT 5.92 7.22 4.62 4.92 This study
Shanghai 5.27 6.48 5.29 6.37 This study
Urumqi 5.49 6.21 This study
Tianchi 5.81 6.35 This study
Tazhong 6.61 7.39 This study
Beijing (Normal days) 6.54 6.79 5.92 6.26 Wang et al. (2005)
Beijing (Supper dust days) 7.25 7.54 Wang et al. (2005)
Beijing (Haze days) 5.33 6.27 Wang et al. (2006a)
0.0 2.0 4.0 6.0 8.0
3/
18-3/
1
9
3/
25-3/
2
6
4/
01-4/
0
2
4/
08-4/
9
4/
15-4/
1
7
4/
22-4/
2
3
4/
29-4/
3
0
6/
08-6/
0
8
6/
10-6/
1
0
6/
12-6/
1
2
6/
14-6/
1
4
6/
16-6/
1
6
6/
18-6/
1
8
6/
20-6/
2
0
6/
24-6/
2
4
6/
26-6/
2
6
6/
28-6/
2
8
6/
30-6/
3
0
pH
PM2.5 TSP
μ
μ
d
Fig. 4.Daily variations of pH of aqueous filtrates of aerosols at MT,
2006.
aerosols is determined by the presence and the proportions of the cations and anions in the filtrates of aerosols. In ad-dition, the ratio of equivalent concentrations of total cations to total anions (C/A) should be equal to 1, if all the cations and anions in the aerosol were measured. However, CO23− and HCO−3 were not measured in this study due to the limi-tation of ion chromatography, hence, the difference of the to-tal anions and cations could be used to roughly estimate the amount of CO23−and HCO−3 unmeasured (Wang et al., 2005). C/A of aerosols in spring at MT reached 1.6, while only 1.1 in summer, suggesting that much more carbonate or bicar-bonate presented in the aerosols at MT in spring. The re-markable increase of SO24−, NO−3 and organic acids in sum-mer shown in Table 4 indicated that in sumsum-mer much more aerosols at MT was from secondary pollution, which would lead to the lower pH of the filtrates. Compared to the pH of those aerosols collected from Shanghai in summer (5.29 in PM2.5and 6.37 in TSP), the aerosols at MT showed even
higher acidity, suggesting that the secondary air pollution at MT in summer was even severer than that in Shanghai.
3.2 Sources and formation mechanisms of aerosols at summit of MT
3.2.1 Influence of biomass burning
Biomass burning includes those from grassland, forest, and crop residue, among which more than 60 % are from crop residue burning in the world (Streets et al., 2003). With the rapid development of economy in China, crop residue is increasingly being burned openly in the field. In har-vest every year∼5.182×10⁷ ton crop residues (accounted for 40.0 % of the total crop residues in China) were di-rectly burnt openly, especially in central eastern China, in-cluding Shandong, Jiangsu, Henan, Hebei provinces. Shan-dong, where MT is located, was in number 1 among those provinces mentioned above with the largest amount of crop residues (1.798×10⁷t) to be burned openly (Cao et al., 2007). Biomass burning emissions are known to contribute a considerable amount of PM and gaseous pollutants to the air, and crop residues contribute more fine particles and gaseous than other biomaterial residues (Cao et al., 2005; Zhu et al., 2005).
Water soluble potassium is a good tracer for aerosols formed from biomass burning (Andreae, 1983). Sources of total potassium ion (K+Total) in aerosols might be attributed to soot from biomass burning, sea salt, and crustal dust. Elemental Al and Na+could be the good markers of crustal dust and sea salt respectively, as the composition of Na, K, and Al in sea water and in crustal dust were found to be: Na: 31 %, K:1.1 %, Al:0 %, and Na: 2.6 %, K:2.9 %, Al:7.7 %, respectively (Wedepohl, 1995), which showed that the percentage of K+were much lower than Na+in sea salt
and also lower than Al in crustal dust. This means that the concentrations of Na+and Al in the aerosols would increase more than K+if the aerosols were from sea salt and crustal dust. Figure 5 showed that K+ on certain days in summer was significant higher than Na+ and Al with remarkable increase from the normal days, which suggested that the high concentrations of PM2.5 in summer could likely from
was reasonably assumed that the total potassium (K+Total)is the sum of dust-derived potassium (K+Crust), sea-salt-derived potassium (K+SS), and biomass burning-derived potassium (K+BB)i.e. K+Total= K+Crust+ K+SS+ K+BB(Virkkula et al., 2006), we can calculate the biomass burning potassium (K+BB) as K+BB=K+Total–K+Crust–K+SS. Assuming Na+in aerosol is from crust and sea salt only, i.e. Na+Total= Na+Crust+ Na+SS, where Na+Total is the concentration of Na+ in the aerosol sample, and Al in aerosol is originated from crust only, thus, K+Crust and K+SS can be estimated through the ratios of K+/Al and Na+/Al in the aerosol sample and the ratio of K+/Na+in sea salt, i.e. K+Crust= (K+/Al)crust×Alcrust and K+SS= (Na+Total–
(Na+/Al)crustl×Alcrustl)×(K+/Na+)sea−salt. The ratio of
K+/Na+in those particles from sea salt is constant (0.037) (Chester, 1990), whereas the ratios of K+/Al and Na+/Al in crustal dust were different between the samples collected from different sites because of the different background and the different influence of the human activities on each site. We now have two methods to estimate the biomass burning derived potassium (K+BB): (1) Using the minimum ratios of K+/Al of 0.152 and Na+/Al of 0.240 in the PM2.5
aerosol sample collected at MT on 26 April 006 among all samples collected to calculate the background value of K+ and Na+ in crustal dust, then the biomass burning derived potassium (K+BB) is given from K+BB= K
+ Total–
K+Crust–K+SS, where K+Crust= (K+/Al)Aerosol×AlAerosol,
AlAerosol is the Al concentration measured in PM2.5,
i.e. K+Crust= 0.152×AlAerosol, and K+SS= (Na+Total–
(Na+/Al)
Aerosol×AlAerosol)×(K+/Na+)sea−salt,
i.e. K+SS= (Na+Total–0.240×AlAerosol)×0.037, (2) Using
the ratios of K+/Al of 0.107 and Na+/Al of 0.031 mea-sured in the soil samples collected at MT to calculate the background value of K+ and Na+in crustal dust, then the biomass burning derived potassium (K+BB)is given from K+BB=K+Total−KCrust+ −K+SS,where K+Crust
=(K+/Al)soil×AlAerosol,i.e.K+Crust=0.107×AlAerosol,and
K+SS=(Na+Total−(Na+/Al)soil×AlAerosol)×(K+/Na+)sea−salt,
i.e.K+SS=(Na+Total−0.031×AlAerosol)×0.037,
The concentrations of K+BB (biomass burning-derived K+)
calculated with two methods mentioned above in PM2.5
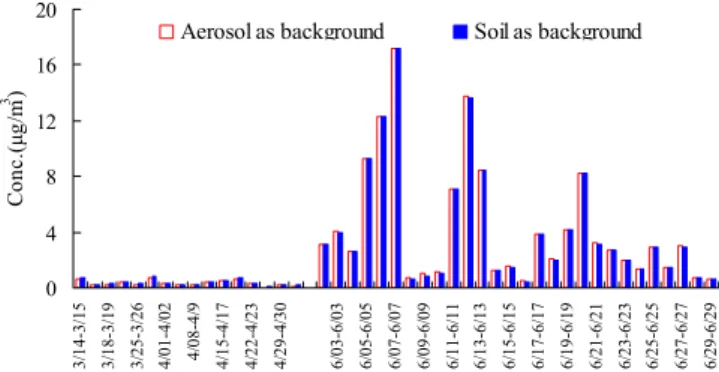
col-lected at MT in 2006 are shown in Fig. 6. It can be seen clearly that very similar concentrations of K+BB were ac-quired by the two methods. The averaged K+BB were 0.40 and 4.30 µg m−3in spring and summer, respectively, with the method of using the minimum ratios of K+/Al and Na+/Al
in the aerosol sample to calculate the background value of K+and Na+in crustal dust, while the K+
BB were 0.32 and
4.30 µg m−3 with the method of using the ratios of K+/Al and Na+/Al in the soil samples. The high level of K+BB
0 4 8 12 16 20 3/ 14 -3/ 1 5 3/ 22 -3/ 2 3 4/ 01 -4/ 0 2 4/ 12 -4/ 1 3 4/ 22 -4/ 2 3 5/ 03 -5/ 0 4 6/ 02 -6/ 0 2 6/ 05 -6/ 0 5 6/ 08 -6/ 0 8 6/ 11 -6/ 1 1 6/ 14 -6/ 1 4 6/ 17 -6/ 1 7 6/ 20 -6/ 2 0 6/ 23 -6/ 2 3 6/ 26 -6/ 2 6 6/ 29 -6/ 2 9 Co n c .( μ g/ m 3 ) Na+ K+ Al μ d
Fig. 5. Daily variations of K+, Na+, and Al in PM2.5 from
14 March to 30 June in 2006 at MT.
μ 0 4 8 12 16 20 3/ 14-3 /15 3/ 18-3 /19 3/ 25-3 /26 4/ 01-4 /02 4/ 08-4/ 9 4/ 15-4 /17 4/ 22-4 /23 4/ 29-4 /30 6/ 03-6 /03 6/ 05-6 /05 6/ 07-6 /07 6/ 09-6 /09 6/ 11-6 /11 6/ 13-6 /13 6/ 15-6 /15 6/ 17-6 /17 6/ 19-6 /19 6/ 21-6 /21 6/ 23-6 /23 6/ 25-6 /25 6/ 27-6 /27 6/ 29-6 /29 C onc .( μ g/ m 3 )
Aerosol as background Soil as background
Fig. 6. Concentrations of biomass burning derived K+calculated
with two methods in PM2.5in 2006 at MT.
(4.30 µg m−3)in summer indicated that there were the sig-nificant part of the aerosols from biomass burning emissions at MT during the summer time. This result could also be confirmed by the fire spot data in this region, as shown in Fig. 7a–f. The amount of those fire spots distributed in the region surrounding MT increases obviously in May (Fig. 7c), and highly active fire disturbance appeared in June (Fig. 7d). The fire spots spread mainly to the south to MT during 1– 9 June (Fig. 7e), and then extended to the northern places to MT during 10–19 June (Fig. 7f), which was in accordance to the harvest time of wheat/rice from south to north in this region.
The contributions of biomass burning, crustal dust, and other sources to the fine particles, PM2.5, in spring and
sum-mer 2006 at MT are shown in Fig. 8. To assess quantitatively the contributions of biomass burning openly from the agri-culture residues to the formation of PM2.5 at MT, we used
the ratio of K+/PM2.5of 9.56 % (wt %) from the agriculture
residues, i.e. biomass burning-derived PM2.5= K+BB/0.0956,
to calculate the mass of PM2.5derived from biomass
burn-ing, for both Li et al. (2007) and Cao et al. (2008a) re-ported a very similar content of K+in PM2.5emitted from
μ
1-29 March 2006
a
1-29 April 2006
b
1-29 May 2006
c
1-29 June 2006
d
1-09 June 2006
e
10-19 June 2006
f
Fig. 7. Fire spot data derived from MODIS Global Fire
Map-ping during 2006:(a)1–29 March,(b)1–29 April,(c)1–29 May,
(d)1–29 June,(e)1–9 June and(f)10–19 June at MT.
0 50 100 150 200 250 2 006 .3.14 2 006 .3.22 200 6.4 .1 2 006 .4.12 2 006 .4.22 200 6.5 .3 200 6.6 .2 200 6.6 .5 200 6.6 .8 2 006 .6.11 2 006 .6.14 2 006 .6.17 2 006 .6.20 2 006 .6.23 2 006 .6.26 2 006 .6.30 Co n c .( μ g/ m 3) Biomass burning Crustal dust Others
Fig. 8. Daily contributions of biomass burning, crustal dust, and
others in PM2.5at MT.
crustal dust-derived PM2.5was calculated with the formula
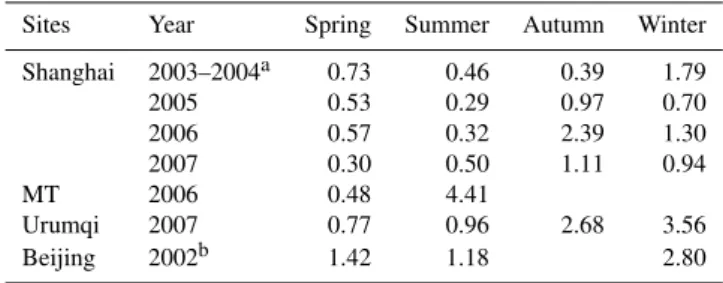
of Al/0.08. The results revealed that the contribution of biomass burning to the fine particle at MT accounted for 7.56 % in spring and 36.71 % in summer, and even reached to 81.58 % on the day of 12 June. In addition, the concen-trations of K+at different sampling sites are summarized in Table 8. The concentration of K+ at MT was much higher than those at other sites, and it showed strong seasonal vari-ation with 4.41 µg m−3in summer and 0.48 µg m−3in spring in PM2.5. Also, K+in PM2.5correlated well to other species
that are related to biomass burning, such as BC, C2O24−,
etc. (see Table 9). All of these results demonstrated evi-dently that biomass burning was one of major contributor to the aerosol pollution in summer over central eastern China, where MT is located.
Table 8.Concentrations of K+in PM2.5at different sampling sites.
Sites Year Spring Summer Autumn Winter
Shanghai 2003–2004a 0.73 0.46 0.39 1.79
2005 0.53 0.29 0.97 0.70
2006 0.57 0.32 2.39 1.30
2007 0.30 0.50 1.11 0.94
MT 2006 0.48 4.41
Urumqi 2007 0.77 0.96 2.68 3.56
Beijing 2002b 1.42 1.18 2.80
aWang et al. (2006b);bWang et al. (2006a).
− − − PM2.5 0 10 20 30 40 Co n c. ( μ g/ m 3)
Nitrate Sulfate Ammonium
0 10 20 30 40
Spring Summer Spring Summer Spring Summer Spring Summer
MT Shanghai Beijing Urumqi
TSP Co n c. ( μ g/ m 3 ) PM2.5 0 10 20 30 40 Con c.( μ g/ m 3)
Nitrate Sulfate Ammonium
TSP 0 10 20 30 40
Spring Summer Spring Summer Spring Summer Spring Summer
MT Shanghai Beijing Urumqi
Co n c. ( μ g/ m
3 )
Fig. 9.Seasonal variations of SO24−, NO−3, and NH+4 in aerosols at
different sampling sites.
3.2.2 Secondary components: SO24−, NO−3, and NH+4
Table 9.Correlation coefficients between K+and other species in aerosols in summer at MT.
K+ C2O24− BC SO42− Cl− NO−3 NH+4
K+ 1.000
C2O24− 0.869 1.000
BC 0.904 0.781 1.000
SO24− 0.636 0.749 0.526 1.000
Cl− 0.708 0.640 0.742 0.481 1.000
NO−3 0.813 0.903 0.767 0.802 0.753 1.000
NH+4 0.636 0.749 0.526 1.000 0.481 0.802 1.000
SO24− and NO−3 in TSP at MT were 4.47 and 3.61 µg m−3
in spring, 20.73 and 8.82 µg m−3 in summer respectively,
while in Shanghai 2.28 and 1.42 µg m−3in spring, 7.34 and
5.50 µg m−3, in summer 2006, respectively. During the study period, the average concentrations of SO2 and NO2 were
46.0 and 24.0 µg m−3in spring, 34.0 and 26.0 µg m−3in sum-mer over MT, while 51.0 and 41.0 µg m−3in spring and 33.0 and 19.0 µg m−3 in summer in Shanghai. Mineral aerosols reacted with SO2 or NO2 to form a layer of sulfate or
ni-trate on the mineral surfaces through the heterogeneous re-actions (Yaacov et al., 1989), and soil particles would be coated by solutions contained sulfate and nitrate. The re-action of SO2on calcium-rich mineral aerosol was likely to
play an important role in the downwind regions (Dentener et al., 1996), as many studies confirmed that the composition and morphology of dust particles would be changed during their transport (Underwood et al., 2001; Song et al., 2001). The conversion of SO2 and NO2 to be SO24− and NO−3 in
ambient air could be their major source in aerosols. Sulfur oxidation ratio (SOR) and nitrogen oxidation ratio (NOR) can indicate the efficiency of these transformations. If SOR is smaller than 0.10, the SO24− could be from the primary emissions (Pierson et al., 1979; Truex et al., 1980), other-wise, SO24−was produced through the photochemical oxida-tion from SO2 (Ohta et al., 1990). Though concentrations
of the gases were basically in the same levels, the SOR and NOR were significantly different between MT and Shang-hai, especially in summer. SOR and NOR in TSP increased from 0.09 and 0.10 in spring to 0.32 and 0.26 in summer at MT, while 0.06 and 0.10 to 0.12 and 0.16 in Shanghai, re-spectively, in the same sampling time. This result indicated that in summer at MT the transformation efficiency of SO2
and NO2to be SO24−and NO−3 was much higher than that in
Shanghai, and it would result in much higher concentrations of sulfate and nitrate at MT than that in Shanghai.
Many factors were likely attributed to the more effective conversion of SO2 and NO2 to be SO24− and NO
− 3 on the
summit of the mountain. Firstly, humidity plays a key role in the formation of sulfate from SO2, for 80–90 % of the
global sulfate was produced in the aqueous-phase, (Jill et al.,
2001). At the summit of MT, total cloud days were 5.4 and 7.0 in spring and summer, respectively, and monthly aver-age foggy days could reach 26, sometimes even 30 in sum-mer, while only 10 in spring. The relatively high humid-ity at the summit in summer is in favor of the formation of sulfate. Secondary, oxidation of SO2 occurs potentially via
three important pathways: oxidation by hydrogen peroxide or ozone, and auto-oxidation catalyzed by Fe (III) and Mn (II), and the former two were proved to be the dominative ox-idation processes under certain conditions (Jill et al., 2001). High level of the biomass burning of agriculture residues re-sulted in increase of those gaseous pollutants, such as O3,
CO and VOCs in summer. Averaged concentration of total peroxide (0.55±0.67 ppbv) was significantly higher in sum-mer than that (0.17±0.26 ppbv) in spring at MT (Ren et al., 2009). The O3in 2003 (Gao et al., 2005) and 2006 (Table 3)
at MT showed that O3was also higher in summer than that
in spring. High levels of O3and peroxide in ambient air in
summer accelerated the conversion of SO2 and NO2 to be
SO24−and NO−3. Lastly, at MT there is abundance of hydro-carbon emitted by the abundant foliage that covers more than 90 % of the area of MT (Suthawaree, et al., 2010). O3
accel-erated the formation of SO24−by directly reacting with SO2
and generating OH radical that further to be transformed to peroxide via cooperating with hydrocarbon under light radia-tion. Hydrocarbon can react with OH radical to produce HO2
and RO2(OH+RH
[O2]
−→RO2+H2O,NO+RO2→RCHO+
HO2+NO2) (Ariel et al., 2000), and HO2 further
re-act with SO2 and NO2. Higher CO level produced
from biomass burning in summer also contributed to the oxidation of SO2 by generating peroxide with OH
radical (OH+CO−→[O2]HO2+CO2).The reactive processes
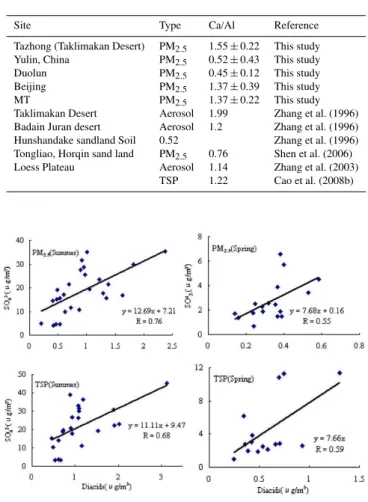
above would benefit the formation of organic acids: HO2+RO2→ROOH+O2. The high concentrations of
diacids and the good correlations of diacids with SO24−, as shown in Fig. 10, further suggested the formation mecha-nism of high level of the secondary aerosol in summer at MT. Besides, NH+4 increased significantly from 1.48 µg m−3 in spring to 10.4 µg m−3in summer, which was likely due to
more pesticide sprayed in the large area of farming fields in late May and the stock-raise at MT region, which could pro-duce much more NH3in summer than in spring. Also, higher
temperature in summer could lead to the higher emission of NH3from animal’s excrements (Sacoby et al., 2007). 3.2.3 Mineral dust in spring time
Table 10.Ratio of Ca/Al in aerosol or surface soil in different sam-pling sites over China.
Site Type Ca/Al Reference
Tazhong (Taklimakan Desert) PM2.5 1.55±0.22 This study
Yulin, China PM2.5 0.52±0.43 This study
Duolun PM2.5 0.45±0.12 This study
Beijing PM2.5 1.37±0.39 This study
MT PM2.5 1.37±0.22 This study
Taklimakan Desert Aerosol 1.99 Zhang et al. (1996)
Badain Juran desert Aerosol 1.2 Zhang et al. (1996)
Hunshandake sandland Soil 0.52 Zhang et al. (1996)
Tongliao, Horqin sand land PM2.5 0.76 Shen et al. (2006)
Loess Plateau Aerosol 1.14 Zhang et al. (2003)
TSP 1.22 Cao et al. (2008b)
Fig. 10. Scatter plots of SO24−vs. decides (sum of CH2C2O24−,
CH4C2O24−, and C2O24−).
Duolun, MT, and Beijing. The ratio of Ca/Al has been proved to be a good tracer for different dust original areas (Wang et al., 2005; Sun et al., 2005), for Ca/Al showed remarkable de-pendence of the source regions for both dust aerosol and soil samples. Ratios of Ca/Al in aerosol or soil from different sampling sites are shown in Table 10, and it could be seen clearly that Taklimakan desert, the western source of Asian dust, is characterized by high ratio of Ca/Al of greater than 1.5, while the northern source of Asian dust, such as Duolun and Hunshandake Sandland, is characterized by low ratio of Ca/Al of around 0.5. The ratio of Ca/Al (1.37±0.22) in the aerosol at MT indicated that the dust aerosol at MT in spring could be from the long-range transport of the dust from western or northwestern high-dust sources. The facts men-tioned above that the coarse particles dominated in spring (PM2.5/TSP of 0.37) and the alkalinity (pH = 7.22) of the TSP
in spring further confirmed that the long-range transport was the major source of the aerosols in spring at MT.
Y ulin
0 1 0 2 0 3 0 4 0
C
onc
.(
μ
g/
m
3)
Duolun
0 10 20 30 40
Co
n
c
.(
μ
g/
m
3)
M T
0 1 0 2 0 3 0
Co
n
c.
(
μ
g/
m
3)
Beijin g
0 5 10
Co
n
c.
(
μ
g/
m
3) Al C a Fe
T azh o n g
0 4 0 8 0 1 2 0 1 6 0
3 /2 6 -3 /2 7
3 /2 8 -3 /2 9
3 /3 0 -3 /-3 1
4 /1 -4 /1
4 /2 -4 /2
4 /3 -4 /3
4 /4 -4 /-4
4 /5 -4 /5
4 /6 -4 /8
4 /9 -4 /1 0
4 /1 1 -4 /1 3
C
onc
.(
μ
g/
m
3)
Fig. 11. Daily variation of mineral elements (Ca, Al and Fe) at
different sampling sites in spring, 2007.
3.2.4 The pollution elements As and Pb
The pollution elements, As and Pb, were highly enriched in the aerosols with the EF of 1541 and 679, respectively, in spring, while 1470 and 1969 in summer in PM2.5at MT. As
Table 11.Correlation coefficients among the certain species in spring and summer at MT.
Spring
SO2−
4 NO
−
3 BC Al Fe Ca As Cr Cu Cd Mn Pb Zn Ti
Summer
SO24− .802 .526 .253 .274 .249 .502 .325 .478 .613 .303 .496 .538 −.243 SO24−
NO−3 .954 .767 .223 .237 .259 .415 .249 .594 .551 .286 .419 .557 −.087 NO−3
BC .748 .792 −.030 −.029 −.002 .358 .090 .323 .378 .023 .476 .081 .004 BC
Al .225 .185 −.027 .997 .986 .469 .795 .623 .691 .984 −.184 .725 .411 Al
Fe .353 .239 −.070 .781 .982 .456 .775 .616 .677 .984 −.194 .733 .390 Fe
Ca .057 .049 −.241 .857 .806 .529 .838 .684 .721 .992 −.139 .755 .482 Ca
As .326 .234 −.061 .837 .778 .683 .786 .672 .812 .561 .494 .486 .274 As
Cr .164 .111 −.185 .845 .832 .881 .863 .785 .847 .855 .148 .704 .372 Cr
Cu .013 −.043 −.026 .284 .332 .313 .407 .484 .802 .700 .337 .825 .308 Cu
Cd .478 .345 .111 .693 .692 .593 .806 .779 .609 .754 .527 .720 .204 Cd
Mn .415 .295 −.004 .815 .963 .805 .764 .851 .320 .782 −.092 .770 .447 Mn
Pb .438 .359 .086 .701 .873 .554 .949 .774 .591 .704 .735 .134 −.126 Pb
Zn .358 .250 .057 .403 .511 .455 .850 .600 .752 .572 .661 .717 .105 Zn
Ti .367 .425 −.051 .763 .749 .793 .687 .809 .354 .994 .960 .679 .599 Ti
to−0.184 and −0.194, while of As to Al and As to Fe to 0.469 and 0.456, respectively, and the correlation coefficient between Pb and As decreased to 0.494. These results indi-cated that in summer the source of Pb and As was not mainly from long-range transport, instead, they could be from those local/regional sources. It could be seen that Pb and As were both correlated well to Cr, Cu, and Zn in summer, suggesting that the source of Pb and As in summer would likely from the same local/reginal anthropogenic discharge as the pollution elements, Cr, Cu, and Zn, did. The strong convections of air mass would result in the elevation to the summit of MT from the ground level of the pollutants. The emission of Pb from the local/regional anthropogenic source in summer could be much more than that from the long-range transport in spring, which led to the higher enrichment of Pb in summer than that in spring.
4 Summary
Aerosols over central eastern China showed significantly sea-son variation, with fine particles dominated in summer while coarse particles in spring. The summit of MT was suffering from the invasion of long-range transported dust from north-western China, the heavy local/regional anthropogenic emis-sions from the surrounding areas, and the severe secondary pollutions. The contribution of biomass burning to the fine particle at MT accounted for 7.56 % in spring and 36.71 % in summer, and even reached to 81.58 % on a day. The high levels of peroxides and ozone, as well as the favourable me-teorological conditions in the ambient air were in favour of the transformation of SO2 and NOx to sulfate and nitrate,
which resulted in the even severe secondary pollution in this region. As and Pb were two of the most enriched elements. The long-range transport of aerosols spread the heavy pol-lution from coal-mining/coal-ash to everywhere over China. Anthropogenic air-pollution was evidently rather severe at MT.
Acknowledgements. This work was supported by the great inter-national collaboration project of MOST, China (2010DFA92230), the National Key Project of Basic Research of China (Grant Nos. 2006CB403704), and National Natural Science Foundation of China (Grant Nos. 20877020, 20977017). The authors would like to acknowledge Zhihua Wang of Shangdong University for
providing the data of O3and CO.
Edited by: S. C. Liu
References
Andreae, M. O.: Soot carbon and excess fine potassium: long-range transport of combustion-derived aerosols, Science, 220, 1148– 1151, 1983.
Ariel, F. S. and Lamb, D.: The sensitivity of sulfer wet deposition to atmospheric oxidants, Atmos, Environ., 34, 1681–1690, 2000. Arimoto, R.: Eolian dust and Climate: Relationship to sources, tro-pospheric chemistry, transport and deposition, Earth Sci. Rev., 54, 29–42, 2001.
Arimoto R., Duce R. A., and Savoie D. L.: Relationships among aerosol constituents from Asia and the North Pacific during PEM-West, J. Geophys. Res. Atmos., 101(D1), 2011–2023, 1996.
Cao, G., Zhang, X., Wang, D., and Zheng, F.: Inventory of at-mospheric pollutants discharged from biomass burning in China continent, China Environ. Sci., 25(4), 389–393, 2005 (in Chi-nese).
Cao, G., Zhang, X., Wang, Y., and Zheng, F.: Estimation of the emission from open burning of crop residues in China continent, Chin. Sci. Bull., 52(18), 1826–1831, 2007 (in Chinese). Cao, G., Zhang, X., Gong, S., and Zheng, F.: Investigation on
emis-sion factors of particulate matter and gaseous pollutants from crop residue burning, Environ. Sci., 20, 50–55, 2008a.
Chan, Y. C., Simpson, R. W., Mctainsh, G. H., Vowles, P. D., Co-hen, D. D., and Bailey, G. M.: Source apportionment of visibil-ity degradation problems in Brisbane (Australia) using the multi-ple linear regression technique, Atmos. Environ., 33, 3237–3250, 1999.
Chester, R.: Marine Geochemistry, Unwin Hyman, London,
698 pp., 1990.
Dentener, F. J., Carmichael, G. R., and Zhang, Y.: Role of mineral aerosol as a reactive surface in the global troposphere, J. Geo-phys. Res. Atmos., 101(D17), 22869–22889, 1996.
Dockery, D. W., Pope, A. C., Xu, X., Spengler, J. D., Ware, J. H., Fay, M. E., Ferris Jr., B. G., and Speizer, F. E.: An association between air pollution and mortality in six US cities, New Engl. J. Med., 1753–1759, 1993.
Facchini, M. C. S., Decesari, M., Mircea, S., Fuzzi, and Loglio, G.: Surface tension of atmospheric wet aerosol and cloud/fog droplets in relation to their organic carbon content and chemical composition, Atmos. Environ., 34, 4853–4857, 2000.
Gao, J., Wang, T., Ding, A., and Liu, C.: Observational study of ozone and carbon monoxide at the summit of mount Tai (1534 m a.s.l.) in central-eastern China, Atmos. Environ., 39(20), 4779–4791, 2005.
Guo, J., Kenneth, A., Rahn, and Zhuang, G.: A mechanism for the increase of pollution elements in dust storms in Beijing, Atmos. Environ., 38, 855–862, 2004.
Han, L., Zhuang G., Sun Y., and Wang, Z. F.: Local and non-local sources of airborne particulate pollution at Beijing, Science in China Ser. B Chemistry, 48(4), 1–12, 2005.
Jill, E. R., Oliver, V. R., Katharine, F. M., Christopher J., Eli, D. S., Vincent, A. D., Sonia, M. K., Liaquat, H., and Collett Jr., J.: Drop size-dependent S (IV) oxidation in chemically hetero-geneous radiation fogs, Atmos. Environ., 35, 5717–5728, 2001. Kaufman, Y. J., Tanre, D., and Boucher, O.: A satellite view of
aerosols in the climate system, Nature, 419, 215–223, 2002. Li, X., Wang, S., Duan, L., Hao, J., Li, C., Chen, Y., and Yang,
L.: Particulate and Trace Gas Emissions from Open Burning of Wheat Straw and Corn Stover in China, Environ. Sci. Technol., 41(17), 6052–6058, 2007.
Liu, C. L., Zhang, J., and Liu, S. M.: Physical and chemical charac-ters of materials from several mineral aerosol sources in China, Environ. Sci., 23, 28–32, 2002.
Matsumoto, K., Tanaka, H., Nagao, I., and Ishizaka, Y.: Contribu-tion of particulate sulfate and organic carbon to cloud conden-sation nuclei in the marine atmosphere, Geophys. Res. Lett., 24, 655–658, 1997.
Novakov, T. and Penner, J. E.: Large condensation of organic aerosols to cloud-condensation nuclei concentration, Nature, 365, 823–826, 1993.
Novelli, P. C., Masarie, K. A., Tans, P. P., and Lang, P. M.: Recent changes in atmospheric carbon monoxide, Science, 263, 1587– 1590, 1994.
Novelli, P. C., Masarie, K. A., and Lang, P. M.: Distributions and recent changes of carbon monoxide in the lower troposphere, J. Geophys. Res., 103(D51), 19015–19033, 1998.
Ohta, S. and Okita, T.: A chemical characterization of atmospheric aerosol in Sapporo, Atmos. Environ., 24A, 815–822, 1990. Pierson, W. R., Brachaczek, W. W., and Mckee, D. E.: Sulfate
emis-sions from catalyst equipped automobiles on the highway, J. Air Pollut. Control Assoc., 29, 255–257, 1979.
Rastogi, N. and Sarin M. M.: Long-term characterization of ionic species in aerosols from urban and high altitude sites in western India: Role of mineral dust and anthropogenic sources, Atmos. Environ, 39, 5541–5554, 2005.
Rastogi, N. and Sarin, M. M.: Chemistry of aerosols over a semi-arid region: Evidence for acid neutralization by mineral dust, J. Geophys. Res. Lett., 33, L23815, doi:10.1029/2006GL027708, 2006.
Ren, Y., Ding, A., Wang, T., Shen, X., Guo, J., Zhang, J., Wang, Y., Xu, P., Wang, X., Gao, J., Jeffrey, L., and Collett, J.: Measure-ment of gas-phase total peroxides at the summit of Mount Tai in China, Atmos. Environ., 43, 1702–1711, 2009.
Sacoby, M. W. and Marc, L.: Examination of atmospheric ammonia levels near hog CAFOs, homes, and schools in Eastern North Carolina, Atmos. Environ., 41, 4977–4987, 2007.
Shen, Z. X., Cao, J. J., Li, X. X., Wang, Y. Q., Jie, D. M., and Zhang,
X. Y.: Chemical characteristics of aerosol particles (PM2.5)at
a site of Horqin Sand-land in northeast China, Environmental Sciences-China, 18(4), 701–707, 2006.
Song, C. H. and Carmichael, G. R.: A three-dimensional modeling investigation of the evolution processes of dust and sea-salt par-ticles in East Asia, J. Geophys. Res.-Atmos., 106(D16), 18131– 18154, 2001.
Streets, D. G., Yarber, K. F., Woo, J. H., and Carmichael, G. R.: Biomass burning in Asia: Annual and seasonal estimates and atmospheric emissions, Global Biogeochem. Cy., 17(4), 1099, doi:10.1029/2003GB002040, 2003.
Sun, Y., Zhuang, G., Wang, Y., Han, L., Guo, J., Dan, M., Zhang, W., Wang, Z., and Hao, Z.: The air-borne particulate pollution in Beijing-concentration, composition, distribution and sources, Atmos. Environ., 38, 5991–6004, 2004.
Sun, Y., Zhuang, G., Wang, Y., Zhao, X., Li, J., Wang, Z., and An, Z.: Chemical composition of dust storms in Beijing and implications for the mixing of mineral aerosol with pollu-tion aerosol on the pathway, J. Geophys. Res., 110, D24209, doi:10.1029/2005JD006054, 2005.
Sun, Y., Zhuang, G., Huang K., Li J., Wang, Q., Wang Y., Lin, Y., Fu, J., Zhang, W., Tang, A., and Zhao, X.: Asian dust over northern China and its impact on the downstream aerosol chemistry in 2004, J. Geophys. Res., 115, D00K09, doi:10.1029/2009JD012757, 2010.
Suthawaree, J., Kato, S., Okuzawa, K., Kanaya, Y., Pochanart, P., Akimoto, H., Wang, Z., and Kajii, Y.: Measurements of volatile organic compounds in the middle of Central East China dur-ing Mount Tai Experiment 2006 (MTX2006): observation of regional background and impact of biomass burning, Atmos. Chem. Phys., 10, 1269–1285, doi:10.5194/acp-10-1269-2010, 2010.
Tegen, I., Lacis, A. A., and Fung, I.: The influence of climate forcing of mineral aerosols from disturbed soils, Nature, 380(4), 419–422, 1996.
Truex, T. J., Pierson, W. R., and Mckee, D. E.: Sulfate in diesel exhaust. Environ. Sci. Technol., 14, 1118–1121, 1980.
Tsai, Y. I. and Cheng, M. T.: Visibility and aerosol chemical com-positions near the coastal area in central Taiwan, Sci. Total Env-iron., 231, 37–51, 1999.
6609–6620, 2001.
Virkkula, A., Teinil¨a, K., Hillamo, R., Kerminen, V.-M., Saarikoski, S., Aurela, M., Viidanoja, J., Paatero, J., Koponen, I. K., and Kulmala, M.: Chemical composition of boundary layer aerosol over the Atlantic Ocean and at an Antarctic site, Atmos. Chem. Phys., 6, 3407–3421, doi:10.5194/acp-6-3407-2006, 2006. Wang, T., Cheung, A., Vincent, T. F., Anson, M., and Li, Y. S.:
Ozone and related gaseous pollutants in the boundary layer of eastern China: overview of the recent measurements at a rural site, Geophys. Res. Lett., 28(12), 2373–2376, 2001.
Wang, Y., Zhuang, G., Sun, Y., and An, Z.: Water-soluble part of the aerosol in the dust storm season – evidence of the mixing between mineral and pollution aerosols, Atmos. Environ., 39, 7020–7029, 2005.
Wang, Y., Zhuang, G., Sun Y., and An, Z.: The variation of charac-teristics and formation mechanisms of aerosols in dust, haze, and clear days in Beijing, Atmos. Environ., 40, 6579–6591, 2006a. Wang, Y., Zhuang, G., Zhang, X., Huang, K., Xu, C., Tang, A.,
Chen, J., and An, Z.: The ion chemistry, seasonal cycle, and
sources of PM2.5and TSP aerosol in Shanghai, Atmos. Environ.,
40, 2935–2952, 2006b.
Wang, Y., Ge, F., Liu, X., Wang, W., Jia, H., and Wang, D.: Anal-ysis of the ionic characteristics for wet droplets at Mountain Tai, China Environ. Sci., 26(4), 422–426, 2006c (in Chinese). Wang, Y., Wai, K., Gao, J., Liu, X., Wang, T., and Wang, W.: The
impacts of anthropogenic emissions on the precipitation chem-istry at an elevated site in North-eastern China, Atmos. Environ., 42, 2959–2970, 2008.
Wedepohl, K. H.: The compositions of the continental crust, Geochim. Cosmochim. Acta, 59, 1217–1232, 1995.
Yaacov, M. and Judith, G.: Heterogeneous reactions of minerals with sulfur and nitrogen oxides, J. Aerosol Sci., 20(3), 303–311, 1989.
Yuan, H., Wang, Y., and Zhuang, G.: The simultaneous determina-tion of organic acid, MSA with inorganic anions in aerosol and rainwater by ion chromatography, J. Inst. Anal., 6, 12–16, 2003 (in Chinese).
Zhang, X. Y., Zhuang, G. Y., Zhu, G. H., Zhang, D., An, Z. S., Chen, T., and Huang, X. P.: Element tracers for Chinese source dust, Science in China (Series D), 39(5), 512–521, 1996. Zhang, X. Y., Arimoto, R., and An, Z. S.: Dust emission from
Chi-nese desert sources linked to variations in atmospheric circula-tion, J. Geophys. Res.-Atmos., 102(D23), 28041–28047, 1997. Zhang, D., Zang, J., Shi, G., Iwasaka, Y., Matsuki, A., and
Trochkine, D.: Mixture state of individual Asian dust particles at a coastal site of Qingdao, China, Atmos. Environ., 37(28), 3895– 3901, 2003.
Zhu, B., Zhu, X., Zhang, Y., Zeng, L., and Zhang, Y.: Emission
factors of PM2.5 from crop straw burning, Res. Environ. Sci.,
18(2), 29–33, 2005 (in Chinese).