different physical nature had been shown to be determined by cosmophysical factors [1]. Appearance of histograms of a similar shape is repeated periodically: these are the near-a-day, near-27-days and annual periods of increased probability of the similar shapes. There are two distinctly distinguished near-a-day periods: the sidereal-day (1,436 min-utes) and solar-day (1,440 minmin-utes) ones. The annual periods are represented by three sub-periods: the “calendar” (365 average solar days), “tropical” (365 days 5 hours and 48 minutes) and “sidereal” (365 days 6 hours and 9 minutes) ones. The tropical year period indicates that fact that histogram shape depends on the time elapsed since the spring equinox [2]. The latter dependence is studied in more details in this work. We demonstrate that the appearance of similar histograms is highly probable at the same time count offfrom the moments of equinoxes, independent from the geographic lo-cation where the measurements had been performed: in Pushchino, Moscow Region (54◦NL, 37◦EL), and in Novolazarevskaya, Antarctic (70◦SL, 11◦EL). The sequence
of the changed histogram shapes observed at the spring equinoxes was found to be op-posite to that observed at the autumnal equinoxes. As the moments of equinoxes are defined by the cross of the celestial equator by Sun, we also studied that weather is not the same as observed at the moments when the celestial equator was crossed by other celestial bodies — the Moon, Venus, Mars and Mercury. Let us, for simplicity, refer to these moments as a similar term “planetary equinoxes”. The regularities observed at these “planetary equinoxes” had been found to be the same as in the case of true solar equinoxes. In this article, we confine ourselves to considering the phenomenological observations only; their theoretical interpretation is supposed to be subject of further studies.
1 Materials and methods
A many-year monitoring of the alpha-activity of239Pu sam-ples (performed with devices constructed by one of the au-thors, I. A. Rubinstein [3]) was used as a basis for this study. Round-the-clock once-a-second measurements were made in Pushchino, at the Institute of Theoretical and Experimental Biophysics, Russian Academy of Sciences, and at Novolaza-revskaya Antarctic Polar Station of the Arctic and Antarctic Institute.
Semi-conductor detectors used were either collimator-free or equipped with collimators limiting the beam of reg-istered alpha-particles by a spatial angle (about 0.1 radian) within which the particles travelled along a certain direction: towards the Sun, Polar Star, West or East. The number of registered alpha-particles during one-second interval was the measured parameter. Results of the continuous once-a-second measurements of the decay activity were stored in a computer databank.
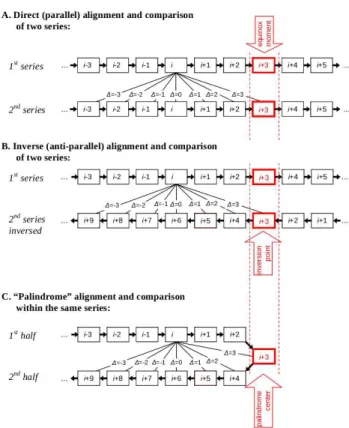
One-minute histograms constructed from 60 results of the once-a-second measurements of activity were the main ob-jects of analysis in our study. The histograms were visu-ally compared with each other in order to estimate the re-semblance of their shape. The estimation was made by the method of expert judgment. This analysis was performed with the assistance of Edwin Pozharsky’s computer program (described in [1]) which allowed to construct histograms for each one-minute interval in a series of measurements and, fur-ther, to smooth and scale them, and to mirror (if needed) in order to superimpose the histograms and visually compare their shape. At the final step of analysis, we constructed the distribution of the number of pairs of similar histograms ver-sus the interval separating the histograms in each pair. Fig. 1 presents a diagram explaining three kinds of comparison of the series of histograms.
Fig. 1: Boxes indicate histograms constructed for the measured ra-dioactivity within each minute of time. Arrows connecting the boxes indicate the direction of time separating the one-minute histograms. The interval between the histograms,∆, is measured in minutes or in position numbers in the aligned series.
sequences in which the equinox moments occur at the same place. Then each i-th histogram of one series is compared with the number of neighboring histograms of the other se-ries, as shown in Fig. 1, case A.
Method B; inverse alignment (anti-parallel). These two series are aligned in the same way but the second one is re-versed at the point of equinox. This is illustrated in Fig. 1B.
Method C; “palindrome” alignment. Two parts of the same sequence are compared with each other. To do that, we assume the equinox moment to be the inversion center of a palindrome. Therefore, the second half of the sequence (fol-lowing the center) is reversed and aligned with the first half as shown in Fig. 1C. Then the two halves of the sequence are compared with each other.
Fig. 2 presents an extract from the laboratory log-file to il-lustrate what shapes are considered similar from the expert’s viewpoint. Final results are presented as the plots of the fre-quency of similar pairs of histograms versus the interval (measured in minutes) separating the position of items in the pairs (Fig. 3, e.g.).
The true equinox moments and the equivalent moments when the Moon, Mars, Venus or Mercury intersect the celes-tial equator (called here, by analogy, “planetary equinoxes”) were determined by nonlinear interpolation of the data
tabu-Fig. 2: Extract from a laboratory log: pairs of similar histograms of 239Pu alpha-activity taken at the same time count off from
the moments of Moon-2005-March-11 and Venus-2001-October-18 equinoxes. Each histogram is constructed by 60 one-second mea-surements (total time being equal to 1 minute). The doubled figures in upper corners of each picture specify the series number (No.1 or No.5) and the position number of a histogram in the series. His-tograms of Moon-2005-March-11 equinox are drawn in red and those of Venus-2001-October-18 in blue. The data presented here correspond to the extreme in the blue curve in Fig. 4.
lated in the annual astronomy tables [4]; the residual error of this interpolation was much within the time resolution of our observations.
2 Results
2.1 Comparison of the histogram series obtained at the successive (in turn) “equinoxes”
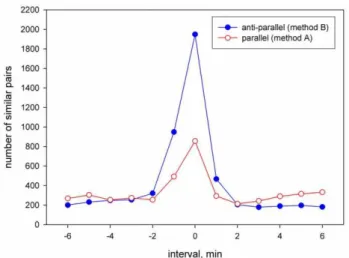
Fig. 3: Total number of similar pairs of histogram as function of time interval separating the histograms in the pair. The compared histogram sequences were related to the successive (neighboring) equinoxes. The sequences compared were aligned parallel or anti-parallel around the very “equinox” moment. First what is seen in the figure is that the probability to find a similar pair of histograms sharply decreases with the distance between the items in the pair. Second important moment is that the maximum probability (which is a measure of similarity of the sequences) is three times higher in the case the sequences compared are oriented anti-parallel. That means the histogram shape depends not only on the proximity of a planet or Sun to the celestial equator but also on the direction a celestial body moves to it. The diagram represents a summary of data for 24 pairs of compared series of alpha-activity aligned around the Sun, the Moon, Mars, Venus and Mercury “equinoxes”. The series were 720 minutes long each. The data used have been obtained either in Pushchino and Novolazarevskaya.
proximity to the equinox moment, but also on the direction the Sun is moving to the celestial equator: from the northern or from the southern hemisphere. The hypothesis has been confirmed by comparison of thedirectseries of the autumn histograms with the inverse series of the spring histograms [2, 5, 6] (cf. in Fig. 1, method B).
In this work, the same analysis is applied to the data in-cluding “planetary equinoxes”. Namely, not only solar but also lunar, venusian, martian and mercurian “equinoxes” have been considered. Fig. 3 summarizes the results of 24 pairs of such “equinox” events. Only the pairs ofsuccessive “equi-noxes” were here compared; i.e., a series of histograms ob-tained at one “equinox” was compared with that of just next “equinox” for the same celestial body. The series were com-pared with use of either procedure A (parallel) and B (anti-parallel) (cf. in Fig. 1).
Fig. 3 shows that:
1. The phenomenon of similarity of the temporal change of the histogram shape near the moments of intersec-tion of the celestial equator by a celestial body appears to be independent of the nature of the body (whatever the Sun, the Moon, Venus, Mars or Mercury). Hence,
Fig. 4: Histogram series at the Venus setting “equinox” 2001-October-18(↓) is highly similar to those at the Moon rising “equinoxes” 2005-March-11(↑), 2005-April-7(↑) and considerably less similar to the series at the Moon setting “equinox” 2005-March-25(↓). (The extreme of this distribution is formed with the pairs of histograms presented in Fig. 2, to illustrate the extent of their simi-larity.)
the sequential changes of histograms do not show any gravitational influence of the bodies;
2. Neither does it depend on the geographic point where the measurements have been performed: the data ob-tained in Pushchino and Novolazarevskaya (Antarctic) display similarity of histograms at the same absolute time, to within one-minute accuracy;
3. Neither does it depend on the velocity a celestial body moves across the equator. Despite a great difference in both angular and linear velocities of the bodies, the changes of histogram shape are correlated in the se-quences aligned along the same time scale. This is a surprising result that has not a simple kinematic expla-nation. This fact, again, is an indication of that the phe-nomenon observed is not a matter of any “influence” exerted by a celestial bodies on the observable value; 4. What we can learn from the fact that the similarity of
histogram sequences is higher in the case of anti-parallel orientation of compared sequences is as fol-lows. The variation of histogram shape shows not only the extent of proximity of the Sun or a planet to the ce-lestial equator but also their location in one or another celestial hemisphere. In other words, the “northern” histograms of a vernal equinox display higher similar-ity to the “southern” histograms of the next autumnal equinox despite the movement of the body on the sky sphere are reciprocal at these two cases.
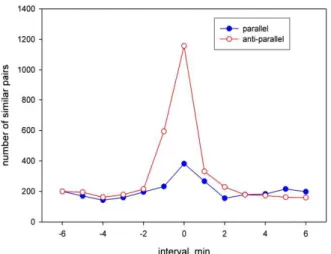
“equi-Fig. 5: The palindrome effect. The number of similar pairs of his-tograms in two compared halves of a sequence separated by the equinox moment as function of time shift between the halves. To-tal numbers obtained in the analysis of 17 equinox and “planetary equinox” events are presented here. Comparison of half-sequences was performed with the procedure C in Fig. 1. Palindrome ef-fect is indicated by the fact that the similarity of anti-parallel half-sequences is 3-fold higher then that of parallel half-half-sequences.
noxes” (2005-March-11(↑); 2005-March-25(↓), and 2005-April-7(↑)). The figure shows that:
1. The histogram series adjusted to “equinox” moments are similar even if the events considered are separated by years (four years in this particular case);
2. The similarity of histograms depends on the direction of movement towards the celestial equator. However, in this particular case, symbate “equinoxes” (Venus-2001-October-18(↓) and Moon-2005-March-25(↓)) happened to be less similar then the counter-directed ones (Venus-2001-October-18(↓) and the other two Moon “equinoxes”, both rising).
2.2 Comparison of direct and inverse halves of the same series of histograms (the “palindrome” effect)
The “palindrome effect” has been described in a number of earlier works; this is the presence of specific inversion points in the time series of histograms after which the same his-tograms occur in the reverse order [2, 5, 6]. Over a daily period, 6 am and 6 pm of local time have been found to be such inversion points. Any point on the Earth’s surface par-ticipates in two movements, one due to the rotation of the Earth about its axis and another due to the movement of the center of the Earth along its circumsolar orbit. One finds that, the projections of the two movements onto the circumsolar or-bit are counter-directional during the daytime (6 am to 6 pm) and co-directional during the nighttime (6 pm to 6 am). This is a probable “kinematic” reason for these two time moments are featured.
A question arose if there are a number of such
“palin-Fig. 6: Summarized data on 8 different Moon, Sun and Mars “equinoxes” when the239Pu alpha-activity was measured with the
collimators directed towards Polar Star. Parallel oriented sequences of histograms display 3-fold higher similarity than those oriented anti-parallel.
drome” centers existing at the equinoxes and “planetary equi-noxes”, separating the celestial body movement towards and away from the celestial equator. This supposition has proved to be true. Indeed, the histogram sequences preceding the equinox moments were similar to the inverse sequences fol-lowing this moments. The palindrome effect (detected with the procedure C; cf. Fig. 1), is illustrated in Fig. 5. As re-vealed from the picture, the probability to find similar histo-grams is 3-fold higher if one of the compared half-sequences is inverted — this is exact the essence of the palindrome ef-fect.
Phenomenological meaning of this observation is that the “equinox” moments are just the points at which the order of changing the histogram shapes is reverted. Sharpness of the peak is an indication of a high accuracy (one minute) of detec-tion of the “equinox” moment. Mirror symmetry of the his-togram sequences around an equinox means that hishis-togram shape depends on how far distant is the celestial body from the equator plane, whatever on the northern or southern side of the celestial sphere. This result might seem to conflict with the data presented in Fig. 3 indicating that the direction of the movement also does matter. However, the seeming conflict is resolved by the fact (revealed from our special investiga-tion) that these two phenomena are determined by different, not overlapping sets of similar histograms.
2.3 Equinox effects in the data obtained with collimators
A number of phenomenological conclusions follow from the results presented herein:
1. The shape of histograms obtained from the measure-ments performed in different geographic locations near the time of “equinoxes” is changing synchronously, within one minute accuracy. For instance, they occur simultaneously in Pushchino and Novolazarevskaya despite 104 minutes of local time difference between these two places. This means this is a global phenom-enon independent of the Earth axial rotation;
2. The changes of histograms obtained near the solar or planetary “equinoxes” do not depend on the nature of the “acting” celestial body, whatever the Sun, Mercury, Mars, Venus or Mercury. Individual features of the bodies — different masses and different rates of their orbital movement — are not essential;
3. At very equinox moments, the inversion of the sequen-ce of the histogram shapes occurs: the sequensequen-ce pre-ceding this moment is reciprocal to that observed after it. A moment when the celestial equator is intersected by a celestial body is a particular point in the histogram series. Its position on the time scale can be determined, with a high accuracy, from the palindrome effect; 4. Changes of histograms near the “equinoxes” depend
on the direction in which the celestial body intersects the equator plane (from the northern or from southern hemisphere);
5. Seeming contradiction between these two phenomena — the similarity of the anti-parallel sequences obtained at successive equinoxes, and the mirror similarity of two halves of each histogram sequence (the “palind-rome effect”) — is, probably, resolved by the fact that these two kinds of symmetry are determined by differ-ent, not overlapping sets of similar histograms; 6. Phenomena observed with collimators can be
consid-ered as an indication of the anisotropy of space. Van-ishing of the “palindrome” phenomena when the col-limator is oriented towards the Polar Star is, perhaps,
tor is intersected by the Moon, Venus and Mars and valuable advice in the data analysis. We sincerely appreciate valu-able discussion with S. A. Vasiliev and his interpretation of our results [8]. We sincerely appreciate A. A. Andreyeva’s work as a “second expert” in the analysis of similarity of his-tograms. We are much obliged to our colleagues from the Laboratory for Physical Biochemistry of the Institute for The-oretical and Experimental Biophysics of RAS and from Chair of Biophysics at Physics Department of MSU, for useful dis-cussions at our seminars, and especially to O. Yu. Seraya for discussion and English translation of the article. We appreci-ate T. A. Zenchenko’s systematic job on the development and support of a computer databank for radioactivity monitoring. We are grateful to D. D. Rabounski for his valuable discus-sion. The work would be impossible without M. N. Kondra-shova and her continuous attention, support and discussion of results. Financial support from D. B. Zimin is greatly appre-ciated.
Submitted on January 01, 2011/Accepted on January 05, 2011
References
1. Shnoll S. E. Cosmo-Physical Factors in Stochastic Processes. Svenska Fisikarkivet, Stockholm, 2009.
2. Shnoll S. E., Panchelyuga V. A., and Shnoll A. E. The Palindrome Ef-fect.Progress in Physics, 2008, v. 2, 151–153.
3. Shnoll S. E. and Rubinstein I. A. Regular changes in the fine structure of histograms revealed in the experiments with collimators which iso-late beams of alpha-particles flying at certain directions.Progress in Physics, 2009, v. 2, 83–95.
4. Astronomical Yearbook. St. Petersburg, Nauka, 2000–2008.
5. Shnoll S. E. The “scattering of the results of measurements” of pro-cesses of diverse nature is determined by the Earth’s motion in the inhomogeneous space-time continuum. The effect of “half-year palin-dromes.Progress in Physics, 2009, v. 1, 3–7.
6. Shnoll S. E., Rubinstein I. A., Vedenkin N. N. The “arrow of time” in the experiments in which alpha-activity was measured using collima-tors directed East and West.Progress in Physics, 2010, v. 1, 26–29. 7. Schild R. E., Gibson C. H. Goodness in the Axis of Evil. arXiv:
astro-ph/0802.3229.