Submitted3 June 2016 Accepted 23 November 2016 Published11 January 2017 Corresponding author
Elba E. Serrano, [email protected] Academic editor
Luciano Fadiga
Additional Information and Declarations can be found on page 25
DOI10.7717/peerj.2829
Copyright
2017 Knight and Serrano Distributed under
Creative Commons CC-BY 4.0
OPEN ACCESS
Hydrogel scaffolds promote neural gene
expression and structural reorganization
in human astrocyte cultures
V. Bleu Knight and Elba E. Serrano
Department of Biology, New Mexico State University, Las Cruces, NM, United States
Cell Decision Process Center, Massachusetts Institute of Technology, Cambridge, MA, United States
ABSTRACT
Biomaterial scaffolds have the potential to enhance neuronal development and regen-eration. Understanding the genetic responses of astrocytes and neurons to biomaterials could facilitate the development of synthetic environments that enable the specification of neural tissue organization with engineered scaffolds. In this study, we used high throughput transcriptomic and imaging methods to determine the impact of a hydrogel, PuraMatrixTM, on human glial cellsin vitro. Parallel studies were undertaken with cells grown in a monolayer environment on tissue culture polystyrene. When the Normal Human Astrocyte (NHA) cell line is grown in a hydrogel matrix environment, the glial cells adopt a structural organization that resembles that of neuronal-glial cocultures, where neurons form clusters that are distinct from the surrounding glia. Statistical analysis of next generation RNA sequencing data uncovered a set of genes that are differentially expressed in the monolayer and matrix hydrogel environments. Functional analysis demonstrated that hydrogel-upregulated genes can be grouped into three broad categories: neuronal differentiation and/or neural plasticity, response to neural insult, and sensory perception. Our results demonstrate that hydrogel biomaterials have the potential to transform human glial cell identity, and may have applications in the repair of damaged brain tissue.
SubjectsBioengineering, Bioinformatics, Cell Biology, Genomics, Neuroscience
Keywords 3D culture, RNA-seq, Tissue engineering, Transcriptome, Hydrogel, Astrocyte, Gene expression
INTRODUCTION
(Katz & Burdick, 2009;Wang et al., 2010b;Jeffery et al., 2014). For example, studies have illustrated that the presence of biodegradable matrices at the site of injury can ameliorate reactive astrogliosis and glial scarring, processes that pose a significant barrier to central nervous system (CNS) recovery after trauma (Tysseling-mattiace et al., 2008;Ansorena et al., 2013;Placone et al., 2015). The capacity of the 3D microenvironment to impact cellular morphology as well as transcript and protein expression has been demonstrated for neurons and glia of primate and rodent origin (Georges et al., 2006;Teixeira et al., 2009;Puschmann et al., 2013;Sur et al., 2013;Levy et al., 2014). However, the potential differences between human and rodent astrocytes warrant further investigations with astrocytes of human origin (Oberheim et al., 2009;Levy et al., 2014).
In this study we investigated the consequences of growth in a self-assembling peptide hydrogel environment on human astrocytes. We selected the normal human astrocyte cell line (NHA; Lonza) for this research because it is a primary derived cell line of early developmental origin that retains the ability to differentiate into neuronal cells (Azizi & Krynska, 2013). We assessed how a hydrogel environment affects culture morphology and global gene expression with the intention of determining how biomaterials can potentially affect neural and neuroglial cell fate in humans. We implemented RNA sequencing (RNA-seq) technology for genetic analysis because high throughput transcriptomic approaches are rapidly advancing our ability to identify cell types and subtypes based on classic ‘‘marker gene’’ expression as well as through the identification of novel genes that are expressed in distinct cell types (Cahoy et al., 2008;Puschmann et al., 2013). The well annotated human genome and a rich body of prior literature allowed us to mine the RNA-seq data for functional significance (Ogata et al., 1999;Apweiler et al., 2004;Smith et al., 2007;Huang, Sherman & Lempicki, 2009a;Safran et al., 2010;Szklarczyk et al., 2014;Gray et al., 2015).
METHODS
Cell culture
The Normal Human Astrocyte (NHA; Lonza, CC-2565) cell line was implemented in this study because its neuroglial lineage and species origin present a practicalin vitrosystem for studying the effects of hydrogel biomaterials on the human brain. Furthermore, because NHA are a commercially available cell line, they can be used in follow-up and confirmatory experiments by our research team as well as those of other investigators. NHA from two different biological donors (lots #000080982, #000022529; referred to hereafter as Donor A and Donor B) were cultured according to the manufacturer’s specifications. All cytokines, growth factors, and supplements from the SingleQuotsTM kit (Lonza; CC-4123) were added to Astrocyte Basal Medium (Lonza; CC-3187). We omitted the manufacturer-recommended gentamicin from cell media because the aseptic techniques used in our laboratory enable NHA culture in an antibiotic-free environment. Frozen ampules of cells were thawed and plated into four T-25 flasks (passage 0) and incubated at 37◦C, 5% CO
2, 275 mOsm. Media were replenished within 24 h of thawing cells, and every 48 h that followed. NHA were subcultured by partial digestion with ReagentPackTMsubculturing reagents (Lonza; CC-5034) when cultures reached 80% confluence, five days after plating (passage 1).
Matrix preparation
We selected a self-assembling 16-mer peptide hydrogel matrix (PuraMatrixTM; Ac-RADARADARADARADA-CONH2; 3DMatrix Medical Technology, formerly BD Biosciences) for our experiments because it is chemically defined, commercially available, and cells are readily dissociated from the matrix for RNA isolation. The limited biological activity of PuraMatrixTM facilitates the evaluation of effects that occur primarily in response to the microenvironment structure. In particular, experiments have shown that PuraMatrixTM is not immunogenic, cytotoxic, pyrogenic, or hemolytic, and does not bind to cells via integrin receptors (Holmes et al., 2000;Zhang, Ellis-behnke & Zhao, 2005). Moreover, physiological conditions are retained in PuraMatrixTMbecause the osmolarity of the culture medium is not altered by addition of the hydrogel (matrix=275±2 mOsm; monolayer=276±4 mOsm; mean+S.D.,n=3).
PuraMatrixTM(1%) was vortexed for 30 s, diluted in sterile water to 0.35%, and vortexed again for 30 s. The matrix was centrifuged at 210 G for 5 min to remove bubbles. A total of 125 µl of peptide hydrogel per cm2 was added to each culture vessel prior to the
induction of gelation. Self-assembly of the microenvironment was initiated by adding an equivalent volume of cell culture media and equilibrating for one hour. In order to bring the environment to a neutral pH, the media were replenished twice over the following hour and allowed to incubate overnight prior to the addition of cells.
Experimental design
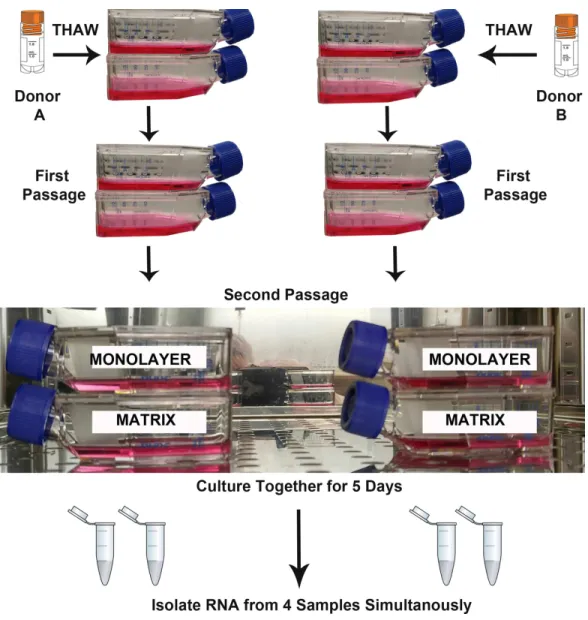
Figure 1 Design of RNA sequencing experiment.The second passages of normal human astrocyte cells from two biological donors were cultured in monolayer and matrix environments for 5 days prior to RNA extraction. Media were replenished on day 3. Cryo vial symbol is courtesy of the symbol library provided by the Integration and Application Network, University of Maryland Center for Environmental Science (ian.umces.edu/symbols/).
both microenvironments was designed to minimize the false discovery of differences due to technical variation. T-25 flasks for each NHA donor and each experimental condition were seeded with 5,000 cells per cm2. As recommended by the vendor, the media were replenished on the 3rd day after plating, and RNA was isolated when monolayer cultures reached approximate confluence (day 5).
Live cell imaging with phase contrast microscopy
CCD camera (Photometrics) attached to an inverted Nikon TE-2000 microscope (20X Magnification).
RNA isolation
RNA isolation was undertaken according to the instructions in the TRIzolR Plus RNA
Purification Kit (Ambion). DNA was removed using the DNA-freeTM kit (Ambion) according to the instructions provided by the manufacturer. RNA quality was assessed with an Agilent 2100 Bioanalyzer.
Library preparation and sequencing
RNA samples with RIN Values greater than 8.8 were submitted to the BioMicro Center at the Massachusetts Institute of Technology for library preparation and sequencing (Fig. S1). A 500 ng aliquot of total RNA (500 ng) from each sample was poly-A purified and converted to cDNA using the manufacturer’s instructions for the Illumina TruSeq RNA Sample Preparation Kit. Samples were fragmented on the SPRI-works system using BioMicro Center adapters, barcoded for multiplexing, enriched using BioMicro Center PCR primers, and assessed for fragment size and distribution on an Agilent 2100 Bioanalyzer. Samples were multiplexed and sequenced on an Illumina HiSeq 2000 (Illumina) in accordance with the protocol for 50 base pair (bp) paired end (PE) reads. Phred scores and nucleotide composition were assessed with FastQC to evaluate base call accuracy (Figs. S2andS3). All four Illumina libraries were multiplexed into one lane (to minimize lane variation) and sequenced on two separate runs of the HiSeq 2000. RNA sequencing (RNA-seq) data collected from all four samples on these two separate occasions are considered technical replicates and labelled as Lane 1 and Lane 2 in the manuscript and data files.
Statistical and ontological analyses
reported a Benjamini–Hochberg adjustedp-value of≤0.1 and a log2fold change≥2 met the criteria for differential gene expression. Cufflinks (version 2.2.1) was used to normalize raw read counts by fragments per kilobase of exon per million reads mapped (FPKM) to compensate for bias introduced by transcript length variance (Trapnell et al., 2012).
Functional significance was imparted to highly and differentially expressed genes using DAVID, the Database for Annotation, Visualization, and Integrated Discovery, with medium stringency settings [29,30]. The Gene Ontology Consortium (GO) terms, Kyoto Encyclopedia of Genes and Genomes (KEGG) pathways, as well as keywords and sequence features from Uniprot were analyzed in detail for genes assigned to clusters with an enrichment score > 1.3 (Langmead et al., 2009;Sur et al., 2012;Lawrence et al., 2013). Protein networks were identified with STRING using the high stringency filter and a maximum of 10 interacting nodes (Szklarczyk et al., 2014). The role of DEGs in nervous system function, if any, was established through manual curation by PubMed query of each DEG using logical ‘‘AND’’ with terms ‘‘brain’’ or ‘‘neural,’’ and by searching the text in GeneCards (Safran et al., 2010).
Immunocytochemistry
Chambered slides with monolayer- and matrix-cultured NHA were rinsed twice in 1 ml/chamber of phosphate buffered saline (PBS) before fixing in an ice cold mixture of methanol and acetone (1:1) for 15 min (1 ml/chamber). Fixed cells were rinsed twice in ice cold PBS, then samples were incubated for one hour at ambient temperature (∼26◦C)
with 1 ml/chamber of blocking solution of PBS comprising 10% normal goat serum, 1% bovine serum albumin (BSA), 0.3 M glycine, and 0.1% TWEENR 20. Primary and
secondary antibodies were diluted in PBS containing 1% BSA and 0.1% TWEENR 20
(PBS-ab). Rabbit anti-TUBB3 antibody (Abcam; catalog # ab52623, lot # GR14955-15) was diluted at 1:300 in PBS-ab and 250µl of antibody solution was incubated with samples
overnight at 4◦C in a sealed, humidified chamber. Primary antibody was omitted from negative control samples to assess nonspecific binding of the secondary antibody. Cells were rinsed 3×5 min in 1 ml/chamber PBS before incubating with 250µl of Alexa FluorR
488-conjugated goat anti-rabbit IgG (Abcam; catalogue # 150081, lot # GR282725-1) diluted at 1:500 in PBS-ab for one hour at ambient temperature (∼26◦C) in the dark.
Cell nuclei were counterstained with the nucleic acid stain Hoescht 33342 (0.2 µg/ ml)
diluted in 18 Mwater. Cells were rinsed 3×5 min in PBS before mounting in glycerol and PBS (1:1). Confocal images were acquired with a 10X/0.3 objective mounted on an inverted LSM 700 microscope (Zeiss). Hoescht 33342 and Alexa FluorR 488 were
Figure preparation
Figures were prepared with Wordle (Feinberg, 2014), Excel (Microsoft, 2010), and the ‘ggplot2’ (Wickham, 2009) and ‘pheatmap’ (Kolde, 2015) data visualization packages for the R statistical programming language. Additional image assembly, labelling, and alignment were completed with Photoshop (Adobe CS6). The ZenLightEdition software package (Zeiss 2009) was used to optimize the relative contribution of the fluorescence signal from the emission channels to the merged confocal image, and to export confocal images as JPEG files.
Responsible conduct and reproducibility
Experimental procedures were developed in accordance with established guidelines for preclinical research (Landis et al., 2012;The National Institute of Health, 2016). NHA were produced by the vendor (Lonza) in compliance with national ethics standards (document available upon request from vendor). Laboratory culture procedures adhered to vendor specifications; cells were used within the maximum 10 population doublings (three passages). RNA-seq results (see below) further confirmed the human origin of the cell line.
The use of the commercial (human) cell lines was approved by the NMSU Institutional Biosafety Committee, approval # 1401SE2F0103, ‘‘Gene Expression in the Nervous System.’’ The protocol was exempt from review by the Institutional Review Board because the commercial cell lines were developed before 2015 and were de-identified by the vendor, Lonza, who retains a signed record of informed consent from human donors. The NIH Extramural Institutional Certification form for human cell lines created before January 25, 2015 was signed by the institutional offices and the principal investigator (EE Serrano) and submitted to NIH with the GEO data files. In accordance with data sharing policies set forth by the NIH, both the raw and processed data are available for download from GEO using the accession numberGSE81995.
Official gene symbols were used in accordance with the standards set forth by the HUGO Gene Nomenclature Committee (Gray et al., 2015). Analysis was undertaken with two biological replicates because the vendor provides primary cell lines from two different human donors. A balanced and blocked design of two biological and two technical replicates was implemented to minimize the impact of confounding variables (Auer & Doerge, 2010). For a complete description of the statistical test that was used to evaluate differential expression, seeAnders & Huber (2010). Sequence data were collected with a single blind protocol at the MIT BioMicro center, without prior knowledge of the nature of the biological samples. Researchers at NMSU assigned groups and assessed the outcomes using a single blind analysis.
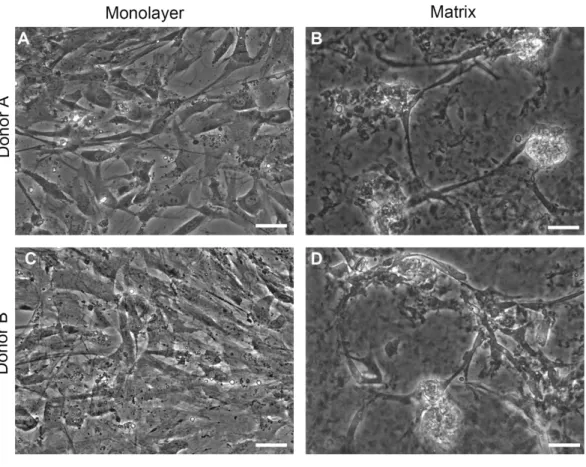
Figure 2 Phase contrast images.Normal human astrocytes cultured in monolayer (A, C) and matrix (B, D) environments for five days and were imaged live, prior to RNA extraction for transcriptome analysis. Representative images are shown for two biological donors: Donor A (A, B); Donor B (C, D). Scale bar= 50µm.
RESULTS
Live cell imaging with phase contrast microscopy
Phase contrast images of cells on TCPS and with peptide hydrogel demonstrate structural differences between NHA grown in TCPS or hydrogel microenvironments (Fig. 2). NHA cultured on TCPS surfaces (Figs. 2Aand2C) appear uniformly flat and phase dark, as is typical of astrocyte cultures, in comparison to NHA cultured with PuraMatrixTM (Figs. 2Band2D). In the hydrogel environment, NHA reorganize and form aggregate structures that resemble neuron-glia cocultures. Clusters of phase-bright cell regions that are characteristic of neuronal somata are visible interspersed in the matrix among phase dark astrocytes (Serrano & Schimke, 1990;Abd-el-basset, 2013).
Evaluation of sequence quality and read alignments
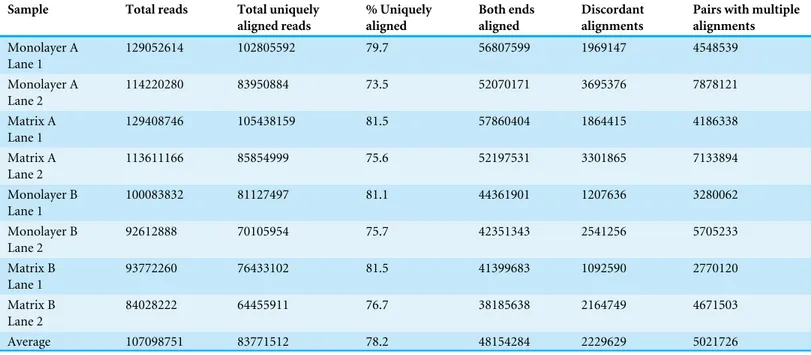
Table 1 RNA-seq alignments to the Human Genome.Paired-end RNA-seq reads from Astrocyte RNA were aligned to the Human Genome (HG19; UCSC) using TopHat (Version 2.0.8b).
Sample Total reads Total uniquely aligned reads % Uniquely aligned Both ends aligned Discordant alignments
Pairs with multiple alignments
Monolayer A Lane 1
129052614 102805592 79.7 56807599 1969147 4548539
Monolayer A Lane 2
114220280 83950884 73.5 52070171 3695376 7878121
Matrix A Lane 1
129408746 105438159 81.5 57860404 1864415 4186338
Matrix A Lane 2
113611166 85854999 75.6 52197531 3301865 7133894
Monolayer B Lane 1
100083832 81127497 81.1 44361901 1207636 3280062
Monolayer B Lane 2
92612888 70105954 75.7 42351343 2541256 5705233
Matrix B Lane 1
93772260 76433102 81.5 41399683 1092590 2770120
Matrix B Lane 2
84028222 64455911 76.7 38185638 2164749 4671503
Average 107098751 83771512 78.2 48154284 2229629 5021726
aligned to the reference human genome (hg19) for a total of 856,790,008 RNA-seq read alignments (Table 1). Approximately 80% of the reads aligned uniquely. Both paired ends aligned to the reference genome (hg19) for 45% of the PE reads, while 2% of alignments were discordant and did not meet the expected distance and/ or orientation constraints established by TopHat.
Normalization and establishment of threshold for expression
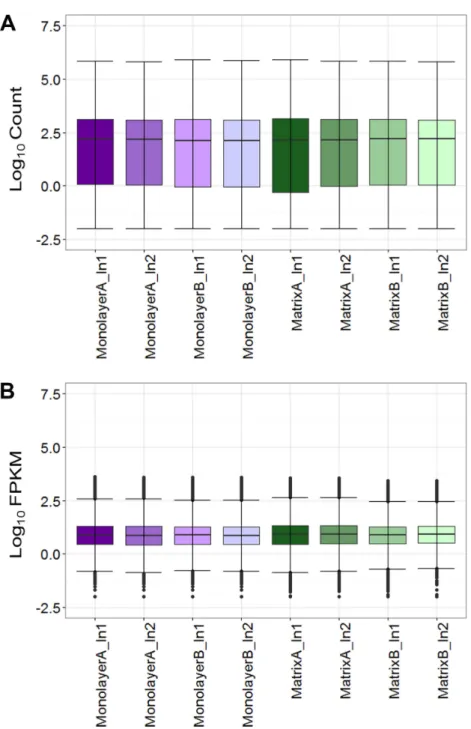
Figure 3 Boxplots of raw RNA-seq alignment counts (A) and thresholded FPKM normalized data (B).
Normal human astrocyte RNA samples from two different donors (denoted by A and B) grown in mono-layer and matrix conditions were multiplexed for sequencing and replicated on two different lanes (de-noted by 1 and 2).
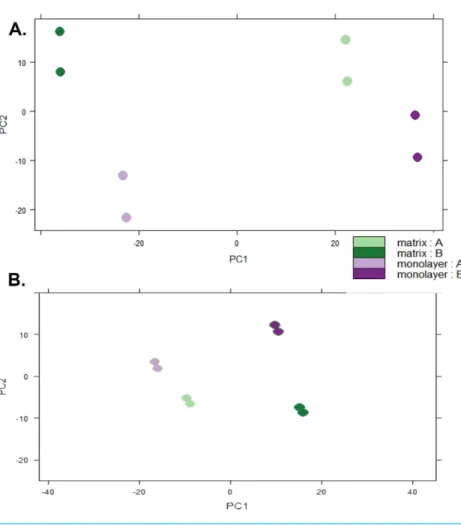
Figure 5 Principal Component Analysis.Plots of raw read count data (A) and FPKM normalized data (B) from RNA sequencing of normal human astrocyte RNA from two different donors (denoted by A and B) grown with TCPS and peptide hydrogel. The pairs of dots correspond to technical replication on two different lanes.
from 0.1–1 (File S3). Moreover, 1,806 genes representing noncoding RNA sequences were removed from subsequent analyses (File S4). Application of these filter criteria identified 12,822 CTSs for downstream analyses (File S5).
Characterization of the most abundant transcripts
Figure 6 Heatmap with hierarchical clustering for the most expressed genes common to RNASeq datasets from NHA grown in TCPS and in hydrogel environments (n=115).FPKM values for RNA
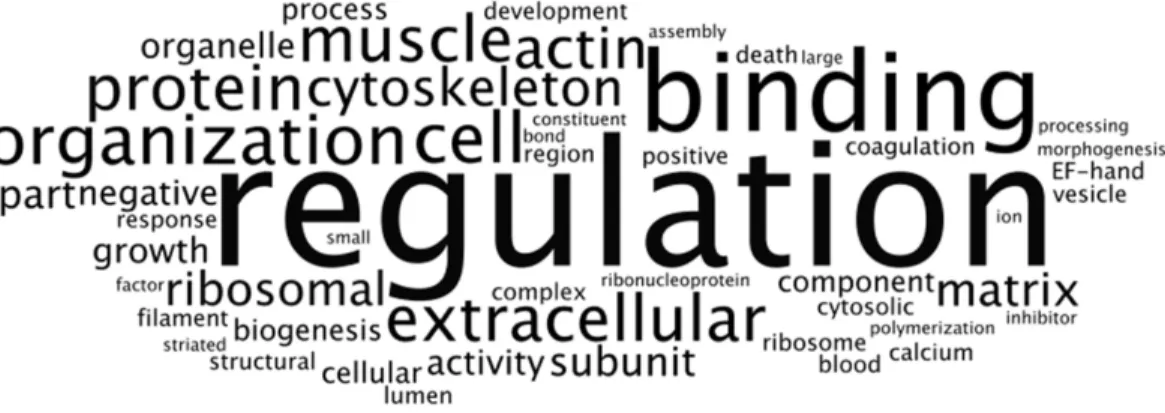
Figure 7 Frequency analysis of DAVID ontological terms for the most expressed genes common to RNASeq datasets from NHA grown in TCPS and in hydrogel environments (n=115).Wordle was used
to arrange the DAVID terms that described the nine significant clusters (enrichment scores > 1.3;File S6) of the most highly transcribed CTSs into an image that represents increasing frequency with larger font size.
A total of 24 of the 26 CTSs that were not common to both conditions were found in the top 15% of the most transcribed genes in the other condition. Two genes,ACTA2and
HTRA1, ranked much lower in the other condition. When CTSs were ranked by highest average FPKM, the CTS forACTA2was ranked #61 for cells grown on TCPS; this ranking fell to #476 (37%) of the highest average FPKM for cells grown in PuraMatrixTM. The
ACTA2gene corresponds to the alpha actin 2 protein, which is involved in the formation of tight junctions in the blood brain barrier (Safran et al., 2010).ACTA2was not considered to be differentially expressed between the two conditions using our DEG criteria; however, the log2FC value was−2.5. For cells grown in PuraMatrixTM, the CTS forHTRA1was ranked #122 of the most transcribed 12,822 genes; this ranking fell to #739 (58%) of the highest average FPKM for cells grown on TCPS. HTRA1is a serine protease that plays a crucial role in neuronal maturation, possibly through downregulation of the TGF-β
signalling pathway (Launay et al., 2008).HTRA1met the differential expression criteria with a log2FC=2.2.
Identification of CNS biomarkers in monolayer- and matrix-cultured NHA transcriptomes
We compared the transcriptome of NHA in monolayer and matrix conditions with established profiles for distinct CNS cell types (Fig. 8). As per Cahoy et al. (2008), a suite of marker genes specify several classes of murine neural cells, including astrocytes, oligodendrocytes, and neurons, (Cahoy et al., 2008). Of the genes thatCahoy et al. (2008)
Figure 8 Percentages of established neural biomarkers that met RNA sequencing threshold criteria for NHA grown in monolayer and matrix environments.RNA sequencing data for NHA was compared to genes that were found to be enriched in neural cell types (A) and subtypes (B) byCahoy et al. (2008).
We further probed for cellular heterogeneity in NHA cultures using marker genes for distinct CNS cell subtypes.Cahoy et al. (2008)developed subset profiles (80 genes each) of the most upregulated genes in specific classes of astrocytes (in vitro,in vivo, developing, and mature) and oligodendrocytes (precursors, myelinating) (Cahoy et al., 2008). When we undertook a more detailed analysis of the NHA transcriptome in monolayer and matrix conditions using these gene lists, we observed that markers for all CNS cell subtypes were present in similar amounts for both monolayer- and matrix- cultured NHA. However, the relative amount of NHA expressed genes varied between subtypes. For example the subtypein vitroastrocytes comprised the highest number of biomarker genes (monolayer, 78%; matrix, 78%;Fig. 8B), as compared to myelinating oligodendrocytes, where a fewer number of biomarkers were detectable (monolayer, 34%; matrix, 36%;Fig. 8B).
Ontological analysis of differentially expressed genes with DAVID
A total of 43 CTSs met our criteria for differentially expressed genes (DEGs;Table 2). Of these DEGs, 16% were upregulated in monolayer-cultured NHA, and 84% were upregulated in cells cultured with PuraMatrixTM (Fig. 9). DAVID analysis did not group the DEGs from TCPS-cultured cells into any clusters (Huang, Sherman & Lempicki, 2009a;Huang, Sherman & Lempicki, 2009b). In contrast, DAVID analysis assigned the DEGs upregulated in hydrogel-cultured cells into 9 significant clusters (enrichment score > 1.3) which we ranked 1–9 with the highest enrichment score corresponding to cluster 1 (Table 3andFile S7) (Huang, Sherman & Lempicki, 2009a;Huang, Sherman & Lempicki, 2009b).
Predicted protein interactions for DEGs
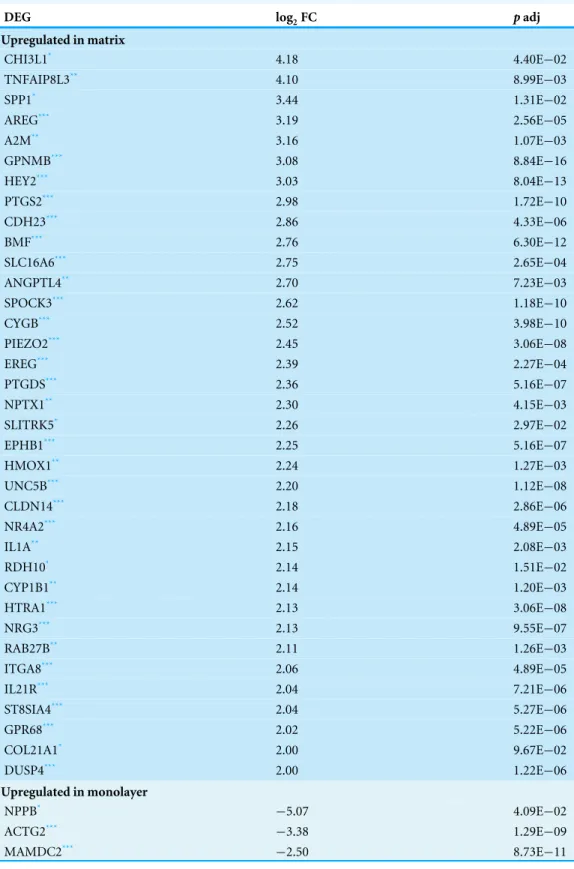
Table 2 Differentially Expressed Genes.CTSs with log2transformed fold change values≥ |2|.
DEG log2FC padj
;
Upregulated in matrix
;CHI3L1* 4.18 4.40E−02
;TNFAIP8L3** 4.10 8.99E−03
;SPP1* 3.44 1.31E−02
;AREG*** 3.19 2.56E−05
;A2M** 3.16 1.07E−03
;GPNMB*** 3.08 8.84E−16
;HEY2*** 3.03 8.04E−13
;PTGS2*** 2.98 1.72E−10
;CDH23*** 2.86 4.33E−06
;BMF*** 2.76 6.30E−12
;SLC16A6*** 2.75 2.65E−04
;ANGPTL4** 2.70 7.23E−03
;SPOCK3*** 2.62 1.18E−10
;CYGB*** 2.52 3.98E−10
;PIEZO2*** 2.45 3.06E−08
;EREG*** 2.39 2.27E−04
;PTGDS*** 2.36 5.16E−07
;NPTX1** 2.30 4.15E−03
;SLITRK5* 2.26 2.97E−02
;EPHB1*** 2.25 5.16E−07
;HMOX1** 2.24 1.27E−03
;UNC5B*** 2.20 1.12E−08
;CLDN14*** 2.18 2.86E−06
;NR4A2*** 2.16 4.89E−05
;IL1A** 2.15 2.08E−03
;RDH10* 2.14 1.51E−02
;CYP1B1** 2.14 1.20E−03
;HTRA1*** 2.13 3.06E−08
;NRG3*** 2.13 9.55E−07
;RAB27B** 2.11 1.26E−03
;ITGA8*** 2.06 4.89E−05
;IL21R*** 2.04 7.21E−06
;ST8SIA4*** 2.04 5.27E−06
;GPR68*** 2.02 5.22E−06
;COL21A1* 2.00 9.67E−02
;DUSP4*** 2.00 1.22E−06
;
Upregulated in monolayer
;NPPB* −5.07 4.09E−02
;ACTG2*** −3.38 1.29E−09
;MAMDC2*** −2.50 8.73E−11
Table 2(continued)
DEG log2FC padj
;DES*** −2.22 1.48E−05
;GCNT4** −2.13 2.70E−03
;DYSF** −2.06 4.28E−03
;EGF** −2.05 6.38E−03
Notes.
Significance levels marked by Benjamini-Hochberg adjustedpvalues. *<0.1.
**<0.01. ***<0.001.
Figure 9 Volcano plot of CTSs that fulfilled expression threshold criteria.The log2 transformed fold change between monolayer and matrix environments is plotted against the negative log10 of thepvalue. The CTSs that were found to be significantly differentially expressed using our criteria of log2 fold change ≥2 and adjustedpvalues≤0.1, 0.01, or 0.001 are shown in green, yellow, or red, respectively.
cultured with PuraMatrixTMwere predicted to interact with ITGB1, EFNB1, NOTCH1, MAPK8, EFNB2, USH1C, HBD, CD44, EGFR, and TP53 (Fig. 10B).
Table 3 Significant Clusters of Differentially Expressed Genes.DAVID Functional analysis of differentially expressed genes (log2 fold change≥2 and adjustedpvalues≤0.1) resulted in nine significant functional clusters (enrichment score > 1.3).
Cluster Score Description Genes
1 5.6 Glycoprotein, signal, signal peptide, glycosylation site: N-linked
A2M, NRG3, PTGS2, SPOCK3, EREG, PT-GDS, ITGA8, ST8SIA4, AREG, GPNMB, SLITRK5, IL1A, COL21A1, IL21R, CHI3L1, GPR68, EPHB1, NPTX1, UNC5B, ANGPTL4, CDH23, SPP1
2 3.5 Extracellular region, extracellular space, secreted A2M, SPOCK3, EREG, COL21A1, HTRA1, HMOX1, CHI3L1, AREG, IL1A, SPP1, ANGPTL4
3 2.0 ErbB signalling pathway, domain: like, EGF, EGF-like region: conserved site, EGF-EGF-like, EGF-EGF-like: type 3, growth factor
NRG3, PTGS2, EREG, AREG
4 1.9 Cell morphogenesis involved in neuron differentiation, cell projection organization, neuron projection mor-phogenesis, neuron development, axonogenesis
UNC5B, ITGA8, NR4A2, SLITRK5, EPHB1, CDH23
5 1.6 Response to (wounding, inflammation, extracellular sig-nal, nutrient levels, steroid hormone stimulus, endoge-nous stimulus, organic substance, inorganic substance), organelle lumen, membrane-enclosed lumen
GPR68, IL1A, DUSP4, A2M, CYP1B1, PTGS2, HMOX1, NR4A2, SPP1
6 1.6 Blood vessel morphogenesis, vasculature development, regulation of cell proliferation, angiogenesis
PTGS2, EREG, HMOX1, HEY2, IL1A, SPP1, ANGPTL4
7 1.6 Extracellular matrix, proteinaceous extracellular matrix SPOCK3, COL21A1, SPP1, ANGPTL4 8 1.5 Ossification, biomineral formation, bone development,
skeletal system development
PTGS2, GPNMB, SPP1
9 1.4 Positive regulation’ of (multicellular organismal pro-cess, cytokine biosynthetic propro-cess, cell communication, macromolecule biosynthetic process, cellular biosyn-thetic process, macromolecule metabolic process, regu-lation of cytokine production, cell proliferation
PTGS2, EREG, HMOX1, HEY2, IL1A, SPP1
Significance of differentially expressed genes for CNS function
The relevance of the DEGs in the nervous system was probed through pooled information sources (DAVID, GeneCards) as well as primary literature queries (PubMed) of individual genes along with the terms ‘‘brain’’ and ‘‘neural.’’ One of the seven genes upregulated in monolayer-cultured cells had a previously established neural function. Of the 36 genes upregulated in hydrogel-cultured cells, 34 were assigned to CNS function either through manual curation or functional clustering by DAVID (Fig. 11) (Huang, Sherman & Lempicki, 2009a;Huang, Sherman & Lempicki, 2009b;Safran et al., 2010). Of the hydrogel-upregulated genes,∼42% (n=15) have an established role in response to neural insult and correspond to processes such as oxidative stress (and/or angiogenesis), ischemic stroke, and traumatic brain injury. Approximately 39% (n=14) of the genes upregulated in matrix-cultured cells are involved in neuronal differentiation and growth, synapse formation, and neural plasticity.
Figure 10 Protein networks predicted by STRING analysis.DEGs were used as input for the STRING database using the high stringency setting. Ten interacting nodes (boxed) are shown for networks derived from DEGs upregulated in monolayer (A) and matrix (B) conditions (not boxed).
Hydrogel-upregulated genes involved in stress responses
Manual curation and the bioinformatics resource DAVID suggest that fifteen genes upregulated in hydrogel-cultured cells participate in the CNS responses to inflammation, oxidative stress, traumatic brain injury, and ischemic stroke (Fig. 11). The collective information resources DAVID and GeneCards linked seven of these genes to the inflammatory response of the CNS, includingPTGS2, HMOX1, A2M, SPP1, GPR68, and IL1A(Huang, Sherman & Lempicki, 2009a;Huang, Sherman & Lempicki, 2009b;Safran et al., 2010). Other experiments have provided evidence thatCHI3L1, GPR68andIL1Aare involved in the response to traumatic brain injury (Hua et al., 2011;Schneider et al., 2012;
Wiley et al., 2015). DAVID associated ‘response to oxidative stress’ withHMOX1, CYGB,
andPTGS2(File S7) (Huang, Sherman & Lempicki, 2009a;Huang, Sherman & Lempicki, 2009b). DAVID assigned the GO term ‘angiogenesis’ toHMOX1, EREG, andANGPTL4 (File S7) (Huang, Sherman & Lempicki, 2009a;Huang, Sherman & Lempicki, 2009b). Analysis of function in GeneCards revealed thatEPHB1andUNC5Balso regulate angiogenesis (Safran et al., 2010). Literature reports thatANGPTL4upregulation corresponds to increased vascularization after stroke (Schipper et al., 2014). Results from prior studies show that
IL21R, BMF, andGPNMBcorrespond to mediators of injury following ischemic stroke (Clarkson et al., 2014;Nakano et al., 2014;Pfeiffer et al., 2014).
Hydrogel-upregulated genes involved in neuronal growth and differentiation
Reports of previous findings and DAVID functional analysis indicate that fourteen of the genes upregulated in hydrogel-grown NHA are associated with neuronal differentiation and growth, synapse formation, and neural plasticity (Fig. 11). The primary literature and content of GeneCards suggest thatST8SIA4, PTGS2, andHMOX1 are involved in neural plasticity, along with DUSP4, indirectly, through interactions withGRIN1 and
Figure 11 Expression levels and ontological characterization of genes upregulated in hydrogel-cultured NHA.Normalized expression levels (FPKM) for hydrogel-upregulated genes are shown for monolayer (dark grey) and matrix (light grey) cultures (A). Functional classification categories assigned to hydrogel-upregulated genes by DAVID (blue) or through manual curation (purple). Categories are displayed left to right in order from those with the greatest number of genes (synaptic plasticity;n=10) to the least number of genes (anterograde transport,n=1).
provide evidence thatRDH10 is involved in neuronal differentiation during embryonic development, andUNC5B, a netrin receptor, mediates the repulsion of growth cones in the axon during nervous system development (Kaur et al., 2007;Chatzi, Cunningham & Duester, 2013). Experiments have identifiedNPTX1as a marker of commitment to neural lineage that is involved in synaptic remodelling (Boles et al., 2014).
Analysis of GeneCards revealed thatNR4A2is a transcriptional regulator that plays a role in the differentiation of meso-diencephalic dopaminergic neurons (Safran et al., 2010).
Figure 12 Class IIIβ-tubulin Immunocytochemistry. Optical sections of NHA samples cultured in monolayer (A) and matrix (B) environments for 5 days. Cells were fixed prior to staining class III β-tubulin (green) and nuclei (blue) with anti –TUBB3 antibody and Hoescht 33342, respectively. Scale bar=200µm.
through downregulation of TGF-β (Launay et al., 2008). GeneCards analysis revealed thatSLITRK5andITGA8modulate neurite growth (Safran et al., 2010). Researchers have indicated thatSPP1 interacts withITGA8, and its expression pattern corresponds to the development of finger dexterity (Yamamoto et al., 2013). Review of GeneCards uncovered thatEPHB1plays an important role in synapse formation and the maturation of dendritic spines (Safran et al., 2010).
Hydrogel-upregulated genes involved in sensory processes
Other CNS functions of hydrogel-upregulated genes
Manual curation of gene function through review of the primary literature and the information on GeneCards revealed additional CNS functions for genes upregulated in matrix-cultured NHA, including involvement with the blood brain barrier (BBB) and astrocyte-specific genes, as well as genes associated with neurological disorders and other functions. In particular,CLDN14is an essential component the tight junctions comprising the BBB. The reported high expression levels forCYP1B1andCH31L1in the BBB suggest a role for these genes in BBB function (Safran et al., 2010;Decleves et al., 2011;Bjørnbak et al., 2014).CHI3L1is also an astroglial lineage marker, andAREGacts as a growth factor and mitogen in astrocytes (Safran et al., 2010;Bjørnbak et al., 2014).RAB27Bis involved in axonal anterograde transport (Arimura et al., 2009).SPOCK3 is a calcium-binding extracellular proteoglycan that is specifically expressed in the brain (Hartmann et al., 2013).PTGSplays a role in sedation, NREM sleep, pain, and may play an anti-apoptotic role in oligodendrocytes (Safran et al., 2010).NRG3is also thought to be a survival factor for oligodendrocytes (Safran et al., 2010). In addition, four genes associated with neurological disorders were significantly upregulated in hydrogel-cultured cells (NR4A2, Parkinson’s disease; A2M & HMOX1, Alzheimer’s; COL21A1, atypical psychosis) (Safran et al., 2010;
Kanazawa et al., 2013;Schipper & Song, 2015).
CNS function of TCPS-upregulated genes
For NHA cultured on TCPS, querying the neural relevance of the DEGs in the nervous system through pooled information sources (DAVID, GeneCards) as well as primary literature queries (PubMed) of individual genes along with the terms ‘‘brain’’ and ‘‘neural’’ resulted in a smaller proportion of genes with relevance to the CNS. Of the 7 genes upregulated in TCPS-cultured cells, one gene (EGF) was found to have a previously established neural function. Analysis of GeneCards revealed that EGF can induce neurite outgrowth (Safran et al., 2010). One in seven corresponds to approximately 14% of the genes upregulated in TCPS-cultured cells with a previously established function in the CNS. In contrast, 94% of hydrogel-upregulated genes were known to play a role in the CNS.
Immunocytochemical detection of class III β-tubulin
DISCUSSION
After five days in culture, the morphology of hydrogel-cultured NHA resembled what is typically observed in primary mouse neuron-astrocyte co-cultures, while monolayer-cultured cells retained the phase dark appearance that typifies astrocyte cultures (Serrano & Schimke, 1990;Abd-el-basset, 2013). The change in cellular organization was accompanied by a difference in the staining pattern of class IIIβ-tubulin between the two conditions. In monolayer-cultured NHA, the tubulin stain was prevalent throughout all cells, whereas in matrix-cultured NHA, heterogeneous labelling was observed. These findings are consistent with the results of experiments by Azizi & Krynska (2013), who developed a protocol to induce neuronal differentiation in NHA by altering media, growth factors, and using a hydrogel comprising natural extracellular matrix proteins (Azizi & Krynska, 2013). In contrast, we found that culturing cells with the synthetic hydrogel PuraMatrixTM, and no change in media or growth factors, was sufficient for the induction of morphological and transcriptomic differences. The limited bioreactivity of PuraMatrixTMsuggests that changes in our NHA cultures may be attributed, at least in part, to the mechanical properties or structural organization of the growth environment (Holmes et al., 2000;Zhang, Ellis-behnke & Zhao, 2005;Sur et al., 2012). The altered morphology we observed in NHA cultured with PuraMatrixTM is congruent with previous findings where neuronal differentiation of immature cell types has been shown to depend primarily upon stiffness of the culture substrate (Teixeira et al., 2009;Sur et al., 2012).
Next generation RNA sequencing provides a comprehensive view of expressed transcripts and transcripts that are differentially regulated between culture conditions. Therefore, for insight into the key molecular players that direct the cellular response to altered substrate elasticity, we undertook next generation RNA sequencing experiments of TCPS- and hydrogel-cultured NHA. The adherence to stringent criteria for RNA integrity (RIN≥8.8) facilitated the collection of sequence data with Phred scores >20. Transcriptomic analysis revealed 43 genes that were significantly differentially expressed between monolayer and matrix conditions.
We propose that the genes involved in neuronal differentiation and maturation contribute to the molecular basis of the altered morphology and structural reorganization observed in hydrogel-cultured NHA. In particular,UNC5B,HTRA1,ITGA8, and SPP1
would make intriguing candidates for future studies due to their relatively high expression levels and fold changes as compared with other genes in this umbrella category. Moreover, two of the top five most upregulated genes in matrix-cultured NHA,CHI3L1andAREG, have an established role in astrocyte growth and differentiation. The expression of markers for neuronal and glial maturity in hydrogel-cultured NHA suggests that differentiation of NHA into mature neurons and astrocytes is enhanced when cultured in a hydrogel environment. Results are consistent with previous reports of neuronal and astrocytic enhancement on soft substrates (Teixeira et al., 2009).
The differences between TCPS and hydrogel- cultured NHA warrant further investigation into the structural and molecular bases of our findings. For example, the observation that a number of hydrogel-upregulated genes are involved in sensory perception (n=10) inspires functional studies with electrophysiological techniques or calcium imaging. Electrophysiological approaches could also be used to evaluate changes in synaptic plasticity, another functional category comprising several (n=9) hydrogel-upregulated genes. In addition, the number of hydrogel-hydrogel-upregulated genes involved in the inflammatory response (n=8) prompts experiments that can measure secreted inflammatory and anti-inflammatory mediators. Extended live imaging experiments can be used to determine whether the structural reorganization of NHA is due to migration or local division, while transmission electron microscopy can be applied to uncover ultrastructural features of cellular and subcellular organization within the hydrogel environment. Moreover, characterization of the structure of the hydrogel with scanning electron microscopy, as well as measuring the elasticity of the hydrogel through atomic force microscopy, could contribute to the design of hydrogels for therapeutic applications.
CONCLUSION
NHA cultured with the peptide hydrogel PuraMatrixTM undergo a morphological and transcriptomic shift in the absence of additional growth factors. Next-generation RNA sequencing and ontological analyses revealed key molecular players involved in maturation and differentiation of neurons and glia that were upregulated in hydrogel-cultured NHA. The upregulation of gene biomarkers which signify neuronal and glial maturity in hydrogel-cultured NHA suggests that differentiation of NHA into mature neurons and astrocytes can be stimulated when cells are cultured in a hydrogel environment.
List of abbreviations
% percent
◦C degrees Celsius
µl microliter
3D tridimensional
bp base pair
cm2 square centimetre
CNS central nervous system
CO2 carbon dioxide
CTS coding transcript sequence
DAVID Database for Annotation, Visualization, and Integrated Discovery
DEG differentially expressed gene
DNA deoxyribonucleic acid
FPKM fragments per kilobase of exon per million reads mapped
GO Gene Ontology Consortium
G gravity
mOsm milliosmole
ng nanograms
NHA normal human astrocytes
RNA ribonucleic acid
RNA-seq RNA sequencing
RIN RNA integrity number
PBS phosphate buffered saline
PCR polymerase chain reaction
PE paired end
qPCR quantitative polymerase chain reaction
BSA bovine serum albumin
TCPS tissue culture polystyrene
UCSC University of California Santa Cruz
ACKNOWLEDGEMENTS
We are grateful to Dr. Stuart Levine and Dr. Shmulik Motola of the Massachusetts Institute of Technology BioMicro Center for technical support. We would like to thank Dr. Armando Varela-Ramirez of the Border Biomedical Research Center Cytometry, Screening and Imaging Core Facility at the University of Texas El Paso for assistance with confocal imaging. The content of this manuscript is solely the responsibility of the authors and does not necessarily represent the official views of the National Institutes of Health or NMSU.
ADDITIONAL INFORMATION AND DECLARATIONS
Funding
Grant Disclosures
The following grant information was disclosed by the authors: National Institutes of Health: P50GM068762.
New Mexico State University (Manasse Endowment Fund).
UTEP RCMI Border Biomedical Core Facility: NIH: 5G12MD007592.
Competing Interests
The authors declare there are no competing interests.
Author Contributions
• V. Bleu Knight conceived and designed the experiments, performed the experiments, analyzed the data, contributed reagents/materials/analysis tools, wrote the paper, prepared figures and/or tables, reviewed drafts of the paper.
• Elba E. Serrano conceived and designed the experiments, analyzed the data, contributed reagents/materials/analysis tools, wrote the paper, prepared figures and/or tables, reviewed drafts of the paper, oversight for compliance with institutional agency procedures for research integrity.
Human Ethics
The following information was supplied relating to ethical approvals (i.e., approving body and any reference numbers):
The use of the commercial (human) cell lines was approved by the NMSU Institutional Biosafety Committee, approval # 1401SE2F0103, ‘‘Gene Expression in the Nervous System.’’ The protocol was exempt from review by the Institutional Review Board because the commercial cell lines were developed before 2015 and were de-identified by the vendor, Lonza, who retains a signed record of informed consent from human donors. The NIH Extramural Institutional Certification form for human cell lines created before January 25, 2015 was signed by the institutional offices and the principal investigator (EE Serrano) and submitted to NIH with the GEO data files. In accordance with data sharing policies set forth by the NIH, both the raw and processed data are available for download from GEO using the accession numberGSE81995.
DNA Deposition
The following information was supplied regarding the deposition of DNA sequences: GEO:GSE81995.
Data Availability
The following information was supplied regarding data availability: Raw and processed data available at GEO Accession numberGSE81995
Code on GitHub:https://github.com/bleuknight/Normal_Human_Astrocyte_3D.
Supplemental Information
REFERENCES
Abd-el-basset EM. 2013.Pro-inflammatory cytokine; tumor-necrosis factor-alpha
(TNF-α) inhibits astrocytic support of neuronal survival and neurites outgrowth.Advances in Bioscience and Biotechnology 4:7380.
Anders S, Huber W. 2010.Differential expression analysis for sequence count data.
Genome Biology11: Article R106DOI 10.1186/gb-2010-11-10-r106.
Ansorena E, De Berdt P, Ucakar B, Simón-Yarza T, Jacobs D, Schakman O, Jankovski A, Deumens R, Blanco-Prieto MJ, Préat V, Des Rieux A. 2013.Injectable alginate hydrogel loaded with GDNF promotes functional recovery in a hemisection model of spinal cord injury.International Journal of Pharmaceutics455:148–158
DOI 10.1016/j.ijpharm.2013.07.045.
Apweiler R, Bairoch A, Wu CH, Barker WC, Boeckmann B, Ferro S, Gasteiger E, Huang H, Lopez R, Magrane M, Martin MJ, Natale DA, O’Donovan C, Redaschi N, Yeh L-SL. 2004.UniProt: the Universal Protein knowledgebase.Nucleic Acids Research 32:D115–D119DOI 10.1093/nar/gkh131.
Arimura N, Kimura T, Nakamuta S, Taya S, Funahashi Y, Hattori A, Shimada A, Ménager C, Kawabata S, Fujii K, Iwamatsu A, Segal RA, Fukuda M, Kaibuchi K. 2009.Anterograde transport of TrkB in axons is mediated by direct interaction with Slp1 and Rab27.Developmental Cell16:675–686 DOI 10.1016/j.devcel.2009.03.005.
Ashton RS, Banerjee A, Punyani S, Schaffer DV, Kane RS. 2007.Scaffolds based on degradable alginate hydrogels and poly(lactide-co-glycolide) microspheres for stem cell culture.Biomaterials28:5518–5525DOI 10.1016/j.biomaterials.2007.08.038.
Auer PL, Doerge RW. 2010.Statistical design and analysis of RNA sequencing data.
Genetics185:405–416DOI 10.1534/genetics.110.114983.
Azizi SA, Krynska B. 2013.Derivation of neuronal cells from fetal normal human astrocytes (NHA).Methods in Molecular Biology 1078:89–96
DOI 10.1007/978-1-62703-640-5_8.
Benito-Gonzalez A, Doetzlhofer A. 2014.Hey1 and Hey2 control the spatial and tempo-ral pattern of mammalian auditory hair cell differentiation downstream of hedgehog signaling.Journal of Neuroscience 34: 1286512876DOI 10.1523/JNEUROSCI.
Bjørnbak C, Brøchner CB, Larsen LA, Johansen JS, Møllgård K. 2014.Brain barriers and a subpopulation of astroglial progenitors of developing human forebrain are immunostained for the glycoprotein YKL-40.The Journal of Histochemistry and Cytochemistry 62:369–388DOI 10.1369/0022155414528514.
Boles NC, Hirsch SE, Le S, Corneo B, Najm F, Minotti AP, Wang Q, Lotz S, Tesar PJ, Fasano CA. 2014.NPTX1 regulates neural lineage specification from human pluripotent stem cells.Cell Reports6:724–736DOI 10.1016/j.celrep.2014.01.026.
Cahoy JD, Emery B, Kaushal A, Foo LC, Zamanian JL, Christopherson KS, Xing Y, Lubischer JL, Krieg PA, Krupenko SA, Thompson WJ, Barres BA. 2008.A tran-scriptome database for astrocytes, neurons, and oligodendrocytes: a new resource for understanding brain development and function.The Journal of Neuroscience 28:264–278DOI 10.1523/JNEUROSCI.4178-07.2008.
Chatzi C, Cunningham TJ, Duester G. 2013.Investigation of retinoic acid function during embryonic brain development using retinaldehyde-rescued Rdh10 knockout mice.Developmental Dynamics242(9):1056–1065DOI 10.1002/dvdy.23999.
Chen R, Zhang J, Fan N, Teng Z, Wu Y, Yang H, Tang Y, Sun H, Song Y, Chen C. 2013.
D 9 -THC-caused synaptic and memory impairments are mediated through COX-2 signaling.Cell155:1154–1165DOI 10.1016/j.cell.2013.10.042.
Clarkson BDS, Ling C, Shi Y, Harris MG, Rayasam A, Sun D, Salamat MS, Kuchroo V, Lambris JD, Sandor M, Fabry Z. 2014.T cell-derived interleukin (IL)-21
promotes brain injury following stroke in mice.The Journal of Experimental Medicine 211:595–604DOI 10.1084/jem.20131377.
Decleves X, Jacob A, Yousif S, Shawahna R, Potin S, Scherrmann J-M. 2011.Interplay of drug metabolizing CYP450 enzymes and ABC transporters in the blood-brain barrier.Current Drug Metabolism12:732–741DOI 10.2174/138920011798357024.
Feinberg J. 2014.Wordle: beautiful word clouds.Available atwww.wordle.net.
Georges PC, Miller WJ, Meaney DF, Sawyer ES, Janmey PA. 2006.Matrices with compliance comparable to that of brain tissue select neuronal over glial growth in mixed cortical cultures.Biophysical Journal90:3012–3018
DOI 10.1529/biophysj.105.073114.
Girotto G, Vuckovic D, Buniello A, Lorente-Cánovas B, Lewis M, Gasparini P, Steel KP. 2014.Expression and replication studies to identify new can-didate genes involved in normal hearing function.PLOS ONE9(3):e91446
DOI 10.1371/journal.pone.0085352.
Gray KA, Yates B, Seal RL, Wright MW, Bruford EA. 2015.Genenames.org: the HGNC resources in 2015.Nucleic Acids Research43:D1079–D1085
DOI 10.1093/nar/gku1071.
Hartmann U, Hülsmann H, Seul J, Röll S, Midani H, Breloy I, Hechler D, Müller R, Paulsson M. 2013.Testican-3: a brain-specific proteoglycan member of the BM-40/SPARC/osteonectin family.Journal of Neurochemistry 125:399–409
DOI 10.1111/jnc.12212.
Hascalovici JR, Song W, Vaya J, Khatib S, Fuhrman B, Aviram M, Schipper HM. 2009.Impact of heme oxygenase-1 on cholesterol synthesis, cholesterol efflux and oxysterol formation in cultured astroglia.Journal of Neurochemistry 108:72–81
DOI 10.1111/j.1471-4159.2008.05741.x.
Hebenstreit D, Fang M, Gu M, Charoensawan V, Van Oudenaarden A, Teichmann SA. 2011.RNA sequencing reveals two major classes of gene expression levels in metazoan cells.Molecular Systems Biology 7: Article 497DOI 10.1038/msb.2011.28.
towards donor-identical brain tissue.Human Molecular Genetics22:3534–3546
DOI 10.1093/hmg/ddt208.
Holmes TC, Lacalle S De, Su X, Liu G, Rich A, Zhang S. 2000.Extensive neurite outgrowth and active synapse formation on self-assembling peptide scaffolds.
Proceedings of the National Academy of Sciences of the United States of America 97(12):6728–6733.
Hua F, Wang J, Ishrat T, Wei W, Atif F, Sayeed I, Stein DG. 2011.Genomic pro-file of Toll-like receptor pathways in traumatically brain-injured mice: ef-fect of exogenous progesterone.Journal of Neuroinflammation8: Article 42
DOI 10.1186/1742-2094-8-42.
Huang DW, Sherman BT, Lempicki RA. 2009a.Systematic and integrative analysis of large gene lists using DAVID bioinformatics resources.Nature Protocols4:44–57
DOI 10.1038/nprot.2008.211.
Huang DW, Sherman BT, Lempicki RA. 2009b.Bioinformatics enrichment tools: paths toward the comprehensive functional analysis of large gene lists.Nucleic Acids Research37:1–13DOI 10.1093/nar/gkn923.
Jeffery AF, Churchward MA, Mushahwar VK, Todd KG, Elias AL. 2014.Hyaluronic acid–based 3D culture model forin vitrotesting of electrode biocompatibility.
Biomacromolecules15:2157–2165DOI 10.1021/bm500318d.
Kanazawa T, Ikeda M, Glatt SJ, Tsutsumi A, Kikuyama H, Kawamura Y, Nishida N, Miyagawa T, Hashimoto R, Takeda M, Sasaki T, Tokunaga K, Koh J, Iwata N, Yoneda H. 2013.Genome-wide association study of atypical psychosis.American Journal of Medical Genetics Part B: Neuropsychiatric Genetics162B:679–686
DOI 10.1002/ajmg.b.32164.
Katz JS, Burdick JA. 2009.Hydrogel mediated delivery of trophic factors for neural repair.Wiley Interdisciplinary Reviews: Nanomedicine and Nanobiotechnology 1:128–139DOI 10.1002/wnan.10.
Kaur S, Abu-Asab MS, Abu-Abab MS, Singla S, Yeo S-Y, Ramchandran R. 2007.
Expression pattern for unc5b, an axon guidance gene in embryonic zebrafish development.Gene Expression13:321–327.
Kolde R. 2015.pheatmap: pretty heatmaps.Available athttps:// cran.r-project.org/ package=pheatmap.
Landis SC, Amara SG, Asadullah K, Austin CP, Blumenstein R, Bradley EW, Crystal RG, Darnell RB, Ferrante RJ, Fillit H, Finkelstein R, Fisher M, Gendelman HE, Golub RM, Goudreau JL, Gross RA, Gubitz AK, Hesterlee SE, Howells DW, Huguenard J, Kelner K, Koroshetz W, Krainc D, Lazic SE, Levine MS, Macleod MR, McCall JM, Moxley RT, Narasimhan K, Noble LJ, Perrin S, Porter JD, Steward O, Unger E, Utz U, Silberberg SD. 2012.A call for transparent reporting to optimize the predictive value of preclinical research.Nature490:187–191
DOI 10.1038/nature11556.
Launay S, Maubert E, Lebeurrier N, Tennstaedt A, Campioni M, Docagne F, Gabriel C, Dauphinot L, Potier MC, Ehrmann M, Baldi A, Vivien D. 2008.HtrA1-dependent proteolysis of TGF-beta controls both neuronal maturation and developmental survival.Cell Death and Differentiation15:1408–1416DOI 10.1038/cdd.2008.82.
Lawrence M, Huber W, Pagès H, Aboyoun P, Carlson M, Gentleman R, Morgan MT, Carey VJ. 2013.Software for computing and annotating genomic ranges.PLoS Computational Biology9:e1003118DOI 10.1371/journal.pcbi.1003118.
Levy AF, Zayats M, Guerrero-Cazares H, Quiñones-Hinojosa A, Searson PC. 2014.
Influence of basement membrane proteins and endothelial cell-derived factors on the morphology of human fetal-derived astrocytes in 2D.10.PLoS ONE9:e92165
DOI 10.1371/journal.pone.0092165.
Li H, Koenig AM, Sloan P, Leipzig ND. 2014.Invivo assessment of guided neural stem cell differentiation in growth factor immobilized chitosan-based hydrogel scaffolds.
Biomaterials35:9049–9057DOI 10.1016/j.biomaterials.2014.07.038.
Love MI, Huber W, Anders S. 2014.Moderated estimation of fold change and dis-persion for RNA-Seq data with DESeq2.Genome Biology15(12):Article 550
DOI 10.1101/002832.
Nagaraj N, Wisniewski JR, Geiger T, Cox J, Kircher M, Kelso J, Pääbo S, Mann M. 2011.
Deep proteome and transcriptome mapping of a human cancer cell line.Molecular Systems Biology7:1–8DOI 10.1038/msb.2011.81.
Nakano Y, Suzuki Y, Takagi T, Kitashoji A, Ono Y, Tsuruma K, Yoshimura S, Shi-mazawa M, Iwama T, Hara H. 2014.Glycoprotein nonmetastatic melanoma protein B (GPNMB) as a novel neuroprotective factor in cerebral ischemia-reperfusion injury.Neuroscience277:123–131DOI 10.1016/j.neuroscience.2014.06.065.
Oberheim NA, Takano T, Han X, He W, Lin JHC, Xu Q, Wyatt JD, Pilcher W, Ojemann JG, Bruce R, Goldman SA, Nedergaard M. 2009.Uniquely hominid features of adult human astrocytes.Journal of Neuroscience29(10):3276–3287
DOI 10.1523/JNEUROSCI.4707-08.2009.
Ogata H, Goto S, Sato K, Fujibuchi W, Bono H, Kanehisa M. 1999.KEGG: ky-oto encyclopedia of genes and genomes.Nucleic Acids Research27:29–34
DOI 10.1093/nar/27.1.29.
Ortinau S, Schmich J, Block S, Liedmann A, Jonas L, Weiss DG, Helm CA, Rolfs A, Frech MJ. 2010.Effect of 3D-scaffold formation on differentiation and survival in human neural progenitor cells.Biomedical Engineering Online9: Article 70
DOI 10.1186/1475-925X-9-70.
Pfeiffer S, Anilkumar U, Chen G, Ramírez-Peinado S, Galindo-Moreno J, Muñoz-Pinedo C, Prehn JHM. 2014.Analysis of BH3-only proteins upregulated in re-sponse to oxygen/glucose deprivation in cortical neurons identifies Bmf but not Noxa as potential mediator of neuronal injury.Cell Death and Disease5:e1456
Placone AL, McGuiggan PM, Bergles DE, Guerrero-Cazares H, Quiñones-Hinojosa A, Searson PC. 2015.Human astrocytes develop physiological
morphol-ogy and remain quiescent in a novel 3D matrix.Biomaterials42:134–143
DOI 10.1016/j.biomaterials.2014.11.046.
Prang P, Müller R, Eljaouhari A, Heckmann K, Kunz W, Weber T, Faber C, Vroemen M, Bogdahn U, Weidner N. 2006.The promotion of oriented axonal regrowth in the injured spinal cord by alginate-based anisotropic capillary hydrogels.Biomaterials 27:3560–3569DOI 10.1016/j.biomaterials.2006.01.053.
Puschmann TB, Zandén C, De Pablo Y, Kirchhoff F, Pekna M, Liu J, Pekny M. 2013.Bioactive 3D cell culture system minimizes cellular stress and maintains thein vivo-like morphological complexity of astroglial cells.Glia61:432–440
DOI 10.1002/glia.22446.
Safran M, Dalah I, Alexander J, Rosen N, Iny Stein T, Shmoish M, Nativ N, Bahir I, Doniger T, Krug H, Sirota-Madi A, Olender T, Golan Y, Stelzer G, Harel A, Lancet D. 2010.GeneCards Version 3: the human gene integrator.Database2010:baq020
DOI 10.1093/database/baq020.
Schipper H, Song W. 2015.A heme oxygenase-1 transducer model of degenerative and developmental brain disorders.International Journal of Molecular Sciences 16:5400–5419DOI 10.3390/ijms16035400.
Schipper H, Song W, Benito-gonzalez A, Doetzlhofer A, Nakano Y, Suzuki Y, Takagi T, Kitashoji A, Ono Y, Tsuruma K, Yoshimura S, Shimazawa M, Iwama T, Hara H, Decleves X, Jacob A, Yousif S, Shawahna R, Potin S, Scherrmann J-M, Pfeiffer S, Anilkumar U, Chen G, Ramírez-Peinado S, Galindo-Moreno J, Muñoz-Pinedo C, Prehn JHM, Buga AM, Margaritescu C, Scholz CJ, Radu E, Zelenak C, Popa-Wagner A, Yung YC, Stoddard NC, Mirendil H, Chun J, Balani P, Boulaire J, Zhao Y, Zeng J, Lin J, Wang S, Blumenthal NR, Hermanson O, Heimrich B, Shastri VP, Launay S, Maubert E, Lebeurrier N, Tennstaedt A, Campioni M, Docagne F, Gabriel C, Dauphinot L, Potier MC, Ehrmann M, Baldi A, Vivien D, Ranade SS, Woo S, Dubin AE, Moshourab RA, Wetzel C, Petrus M, Mathur J, Bégay V, Coste B, Mainquist J, Wilson AJ, Francisco AG, Reddy K, Qiu Z, Wood N, Lewin GR, Patapoutian A, Gutmann DH, Hedrick NM, Li J, Astrocytomas SP, Hedrick M, Nagarajan R, Perry A, Watson MA, Hundahl CA, Fahrenkrug J, Hannibal J, Abd-el-basset EM, Datta PK, Lichtenstein MP, Madrigal JLM, Pujol A, Galea E, Besco JA, Hooft van Huijsduijnen R, Frostholm A, Rotter A, Cárdenas A, Kong M, Alvarez A, Maldonado H, Leyton L, Girotto G, Vuckovic D, Buniello A, Lorente-Cánovas B, Lewis M, Gasparini P, Steel KP, Szulzewsky F, Pelz A, Feng X, Synowitz M, Markovic D, Langmann T, Holtman IR, Wang X, Eggen BJL, Boddeke HWGM, Hambardzumyan D, Wolf SA, Kettenmann H. 2014.Transcriptomics of post-stroke angiogenesis in the aged brain.Brain Research1116:5400–5419
DOI 10.1016/j.neuroscience.2014.06.065.
Schneider JW, Goetsch SC, Leng X, Ludwig SM, Russell JL, Yang C-P, Zhang Q-J. 2012.
molecules that regulate proton sensing G protein-coupled receptors.ACS Chemical Neuroscience3:557–568DOI 10.1021/cn300025a.
Serrano EE, Schimke RT. 1990.Flow cytometric analysis of mammalian glial cultures treated with methotrexate.Glia3:539–549DOI 10.1002/glia.440030613.
Smith B, Ashburner M, Rosse C, Bard J, Bug W, Ceusters W, Goldberg LJ, Eilbeck K, Ireland A, Mungall CJ, Leontis N, Rocca-Serra P, Ruttenberg A, Sansone S-A, Scheuermann RH, Shah N, Whetzel PL, Lewis S. 2007.The OBO Foundry: coordinated evolution of ontologies to support biomedical data integration.Nature Biotechnology25:1251–1255DOI 10.1038/nbt1346.
Spencer NJ, Cotanche DA, Klapperich CM. 2008.Peptide- and collagen-based hydro-gel substrates forin vitroculture of chick cochleae.Biomaterials29:1028–1042
DOI 10.1016/j.biomaterials.2007.11.006.
Sur S, Newcomb CJ, Webber MJ, Stupp SI. 2013.Tuning supramolecular mechanics to guide neuron development.Biomaterials34:4749–4757
DOI 10.1016/j.biomaterials.2013.03.025.
Sur S, Pashuck ET, Guler MO, Ito M, Stupp SI, Launey T. 2012.A hybrid nanofiber matrix to control the survival and maturation of brain neurons.Biomaterials 33:545–555DOI 10.1016/j.biomaterials.2011.09.093.
Szklarczyk D, Franceschini A, Wyder S, Forslund K, Heller D, Huerta-Cepas J, Simonovic M, Roth A, Santos A, Tsafou KP, Kuhn M, Bork P, Jensen LJ, Von Mering C. 2014.STRING v10: protein-protein interaction networks, integrated over the tree of life.Nucleic Acids Research43:D447–D452DOI 10.1093/nar/gku1003.
Teixeira AI, Ilkhanizadeh S, Wigenius JA, Duckworth JK, Inganäs O, Hermanson O. 2009.The promotion of neuronal maturation on soft substrates.Biomaterials 30:4567–4572DOI 10.1016/j.biomaterials.2009.05.013.
The National Institute of Health. 2016.Principles and guidelines for reporting preclini-cal research.Available athttps:// www.nih.gov/ research-training/ rigor-reproducibility/ principles-guidelines-reporting-preclinical-research(accessed on 16 December 2016).
Trapnell C, Roberts A, Goff L, Pertea G, Kim D, Kelley DR, Pimentel H, Salzberg SL, Rinn JL, Pachter L. 2012.Differential gene and transcript expression analysis of RNA-seq experiments with TopHat and Cufflinks.Nature Protocols7:562–578
DOI 10.1038/nprot.2012.016.
Tysseling-mattiace VM, Sahni V, Niece KL, Birch D, Fehlings MG, Stupp SI, Kessler JA. 2008.Self-assembling nanofibers inhibit glial scar formation and promote axon elongation after spinal cord injury.Journal of Neuroscience28(14):3814–3823
DOI 10.1523/JNEUROSCI.0143-08.2008.
Wang LS, Boulaire J, Chan PPY, Chung JE, Kurisawa M. 2010b.The role of stiffness of gelatin-hydroxyphenylpropionic acid hydrogels formed by enzyme-mediated crosslinking on the differentiation of human mesenchymal stem cell.Biomaterials 31:8608–8616DOI 10.1016/j.biomaterials.2010.07.075.
differentiation of human mesenchymal stem cells in 3D culture.Biomaterials 31:1148–1157DOI 10.1016/j.biomaterials.2009.10.042.
Wickham H. 2009.ggplot2: elegant graphics for data analysis. New York: Springer.
Wiley CA, Bonneh-Barkay D, Dixon CE, Lesniak A, Wang G, Bissel SJ, Kochanek PM. 2015.Role for mammalian chitinase 3-like protein 1 in traumatic brain injury.
Neuropathology 35:95–106DOI 10.1111/neup.12158.
Yamamoto T, Oishi T, Higo N, Murayama S, Sato A, Takashima I, Sugiyama Y, Nishimura Y, Murata Y, Yoshino-Saito K, Isa T, Kojima T. 2013.Differential expression of secreted phosphoprotein 1 in the motor cortex among primate species and during postnatal development and functional recovery.PLoS ONE8:e65701
DOI 10.1371/journal.pone.0065701.
Yim EKF, Pang SW, Leong KW. 2007.Synthetic nanostructures inducing differentiation of human mesenchymal stem cells into neuronal lineage.Experimental Cell Research 313:1820–1829DOI 10.1016/j.yexcr.2007.02.031.