CHANGE DETECTION IN LAND-USE AND LAND-COVER DYNAMICS
AT A REGIONAL SCALE FROM MODIS TIME-SERIES IMAGERY
Yudi Setiawan a,*, Kunihiko Yoshino b
a
Graduate School of Life and Environmental Sciences, University of Tsukuba, Tennoudai 1-1-1, Tsukuba, Ibaraki 305-8577, Japan – [email protected]
b
Faculty of Engineering, Information and Systems, University of Tsukuba,Tennoudai 1-1-1, Tsukuba, Ibaraki 305-8573, Japan – [email protected]
Commission VII, WG VII/5
KEY WORDS: Change detection, temporal vegetation dynamics, wavelet transform, MODIS EVI,
ABSTRACT:
Remote sensing has long been used as a means of detecting and classifying changes on the land. Analysis of multi-year time series of land surface attributes and their seasonal change indicates a complexity of land use land cover change (LULCC). This paper explores the temporal complexity of land change considering temporal vegetation dynamics, in other words, distinguishing the changes regarding to their properties in long-term image analysis. This study is based on the hypothesis that land cover might be dynamics; however, consistent land use has a typical, distinct and repeated temporal pattern of vegetation index inter-annually. Therefore, pixels represent a change when the inter-annual temporal dynamics is changed. We analysed the dynamics pattern of long-term image data of wavelet-filtered MODIS EVI from 2001 to 2007. The change of temporal vegetation dynamics was detected by differentiating distance between two successive annual EVI patterns. Moreover, we defined the type of changes using the clustering method, which were then validated by ground check points and secondary data sets.
1. INTRODUCTION
Among concerns about global environmental change, some issues related to land-use land-cover (hereafter LULC) and its change (LULCC) over time are becoming increasingly recognized (Lambin et al., 2003; Pielke 2005). During the past decades, several international interdisciplinary research projects have been initiated on these issues including the International Geosphere-Biosphere Programme Committee on Global Change (IGBP, 1988) and the Land Use and Cover Change program (Messerli, 1997). Both of these projects indicated the need to construct an updated and accurate database concerning these changes, their meaning, their pace and the explanatory factors prompting their appearance (Mather, 1999). The ability to recognize that change is a key requirement for the accurate mapping of LULCC (Turner et al., 1995; Lambin et al. 1999), instead of an improvement in the spatial resolution of image data and a detailed ground survey.
Advances in remote sensing technology enable land scientists to identify on-going land cover change processes and their locations (Herold et al., 2006). Meanwhile, one of the main challenges of this technology is to ensure that a change is not a result of short-term variations in land cover (Lunetta et al., 2006, Lambin et al., 2003). For instance, in agricultural land use, which is systematically linked through seasonal-temporal interactions, the land might be associated with a sequence of covers through a year, as a vegetated land (vegetation), barren
land (soil) and inundated land (water); meanwhile, the actual change is when the land is converted into built-up or other uses. In reality, land change is more complicated since it can be also categorized into three types and mechanism, are: 1) seasonal change, driven by annual temperature and rainfall interactions on vegetation phenology; (2) gradual change, caused by inter-annual climate variability or land management; and (3) abrupt change, caused by disturbances such as deforestation, urbanization, floods, and fires (Verbesselt et al., 2010).
Simultaneous analysis on land surface attributes by remote sensing seems to be a way to deal with the issue above (Lunetta et al., 2006). However, since the time-series of remotely sensed data might contain mixture of seasonal, gradual and abrupt changes (Roy et al., 2002), the change detection methods must allow identifying a change within long term data sets and seasonal variation (Setiawan and Yoshino, 2011).
Recently, vegetation dynamics have attracted attention as a means for better understanding LULCC (Galford et al., 2008; Lunetta et al., 2006). On the other hand, understanding vegetation dynamics requires the characterization of vegetation changes at different temporal scales (Martinez and Gilabert, 2009). In this article, we argue that the change detection in LULCC could be improved due to recognizing the change from seasonal/gradual changes, and it can be done due to the pattern analysis of long-term temporal vegetation dynamics of land use.
* Corresponding author: Tel: +81-029-853-5577
E-mail address: [email protected] (Y. Setiawan)
The analysis of temporal vegetation dynamics has often been made by using vegetation index values, either Normalized Difference Vegetation Index (NDVI) or Enhanced Vegetation Index (EVI), which are related to the amount of green leaf biomass. Furthermore, the temporal dynamics of those indexes are useful for examining LULCC due to the differentiating a change pattern in their vegetation dynamics (Hansen et al., 2000; Lloyd, 2000).
This paper will examine an application of temporal vegetation dynamics in order to detect and identify the LULCC with take into account the seasonal events and climatic variability in the tropical region.
2. METHODS
2.1 Satellite data
The vegetation indices, such as NDVI and EVI are commonly used to measure reliable spatial and temporal photosynthetic activity and canopy structural variations. Moreover, EVI was developed to optimize the vegetation signal with improved sensitivity in high biomass regions through a decoupling of the canopy background signal and a reduction in atmospheric influences (Huete et al., 2002).
In this study, we used the time series MODIS EVI (embedded in the MOD13Q1 product), which was filtered by wavelet transforms (Setiawan et al., 2011). The datasets were acquired from January 2001 to December 2007 and captured in a 161 time series with an interval of 16 days. Information on the datasets was obtained from http://lpdaac.usgs.gov, which is maintained by the NASA Land Processes Distributed Active Archive Center (LP DAAC) at the USGS/Earth Resources Observation and Science (EROS) Center, Sioux Falls, South Dakota (2009).
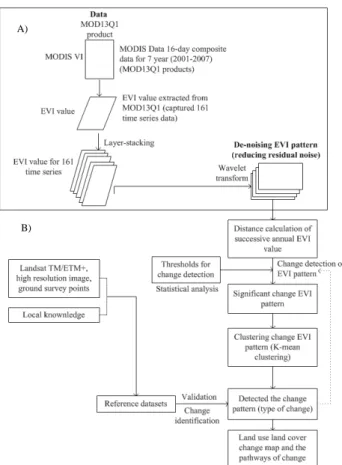
Image processing in this study was designed to address the objectives of our study as illustrated in Figure 1.
2.2 Image pre-processing
The MODIS data has some advantages in providing information on inter-annual variations of land surface, however, the datasets inevitably contain disturbances caused by some errors; such as atmospheric variability (Huete and Liu, 1994), aerosol scattering (Xiao et al., 2003) and some residual errors (Lu et al., 2007). These disturbances degrade the data quality and add considerable uncertainty to temporal sequences, confusing the analysis of temporal image sequences by introducing significant variations on the EVI time series data. Therefore, noise reduction or fitting a model to observation data is required before analysis of temporal dynamics can be determined. In this study, we used the MODIS EVI datasets, which were filtered by wavelet transforms.
Figure 2 indicates that the wavelet transform application deals with discontinuous /sharp spike data (as a residual noise). Once the filtering applied on the temporal EVI pattern, the vegetation phenology can be defined more clearly. Figure 3 shows the result image of filtering by wavelet function on a MODIS image. Characterizing land surface continuously from MODIS EVI datasets have recognized and identified 25 specific land use types, and each type has different time sequence of phenological events (Setiawan et al., 2011).
2.3 Change detection
Previous studies have applied temporal pattern change analysis to identify a change in land cover through change-vector analysis (CVA) (Lambin and Strahlers, 1994), sum of annual Figure 2. The wavelet function filters a temporal pattern EVI
from one pixel MODIS EVI 2001-2007 Original data with
discontinuous/sharp spike (noise) (blue line)
Transformed data by wavelet (red line)
Figure 1. The flow chart of change detection in this study; (A) image preparation and pre-processing (completed by previous study), (B) change detection (this study) A)
B)
Paddy field with double cropping system (paddy-paddy-bareland)
Buit-up (settlement with infrastructure facilities)
Significant distance of change pattern
NDVI (Lunetta et al., 2006) and recursively merging value (Boriah et al., 2008). Meanwhile, we assigned a change area based on distance comparison of EVI values from two successive years, and a threshold was used to assign a change (Figure 4). We created distance in two successive annual patterns following equation 1 (Bouman, 2009). Any two successive annual segments are merged into a new segment,
furthermore, the distance function between segments has a form dkl = D(Rk,Rl) 0.
| | | | (1)
where dk,l is distance between two successive segments, N is the number of observations, and is the mean of a segment (
.
Then, we performed statistical analysis using a standard normal distribution to identify pixels that had the greatest change in distance of EVI for each period. Then, the change threshold was selected corresponding to a range of z-score probabilities, which produced appropriate estimates of annual change values.
In order to differentiate the change patterns, the k-means clustering method was applied. The clustering is applied regarding to the Euclidean distance in an EVI-space, and it
measures how similar a pattern is to patterns in its own cluster compared to patterns in other clusters. Then, we combined the clusters as needed. Each EVI image provides one dimension of the cluster space, analogous to spectral clustering and the clustering method subdivides datasets into n-clusters through an iterative process in order to optimize a criterion function.
2.4 Validation
In this study, the significant change patterns were identified based on the reference data derived by the ground survey, Landsat TM/ETM images, and a high-resolution image (Google Earth). Some pixels were randomly selected and used for the reference datasets. The final number of samples was 18,626 pixels and each pixel was associated with a seasonal change or an actual change event regarding its location in the sets of Landsat images, high resolution image and the reference data derived from the ground survey points.
Whenever possible we provided more detail of land change information including time and pathway of the change. For example, the change pattern illustrated in Figure 4 has been interpreted as a rice paddy field with double cropping system that was converted into built-up (non-agricultural land). That approach was applied to all significant change patterns, which could be detected by the method.
3. RESULTS AND DISCUSSION
3.1 Change detection
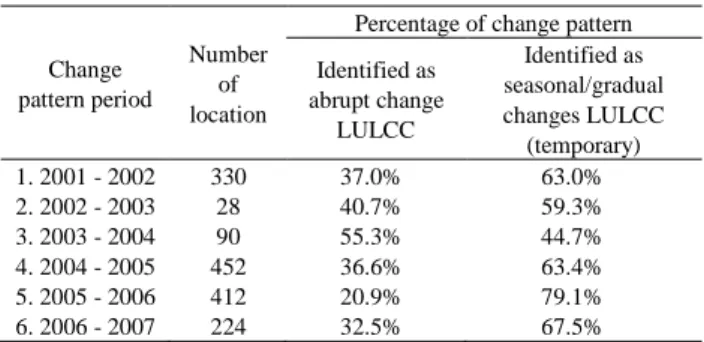
This study assumes that some locations display similar change patterns and are inferred to have a similar type of change. It can be defined with regard to the changes in temporal profiles of EVI. Then, through detailed identification of those change patterns, the pathway of change can be recognized either as a seasonal/gradual change or abrupt change. The results are given in Table 1.
Table 1. The result of change detection for each period
Change pattern period
Number of location
Percentage of change pattern Identified as
abrupt change LULCC
Identified as seasonal/gradual changes LULCC (temporary)
1. 2001 - 2002 330 37.0% 63.0%
2. 2002 - 2003 28 40.7% 59.3%
3. 2003 - 2004 90 55.3% 44.7%
4. 2004 - 2005 452 36.6% 63.4%
5. 2005 - 2006 412 20.9% 79.1%
6. 2006 - 2007 224 32.5% 67.5%
Table 1 shows that on a regional scale, approximately 50%-60% of change patterns are affected by temporary changes of land cover (seasonal/gradual change). These changes of the temporal vegetation pattern were detected related to the climate variability (e.g. ENSO/El-Nino Southern Oscillation), which caused an extreme dry season in 2002, 2005 and 2006. a). Original data b). Transformed by wavelet
Figure 3. The result of filtering on MODIS image.
Figure 4. Identification of the change information from a change of temporal EVI profile
Accordingly, some agricultural lands became barren in those periods because there was insufficient water for plant growth.
In this study, simultaneous analysis of long-term vegetation dynamics allowed the change to be detected including some properties such as the location, area, time and change mechanisms.
Figure 5 shows several patterns of the actual change which could be detected by the distance comparison of EVI. The figure indicates: (a) forest mixed bush converted to barren land through burning at the end of November, 2001, which was planted and converted to upland; (b) change pattern of urban development in an urban area, where an upland was converted into infrastructure/settlement, the area was first converted to barren land (land clearing/preparation) on March 2004, and then a golf course (grass); (c) change pattern of agricultural development due to crop planting in barren land and then being intensive agricultural lands in July 2003; (d) re-vegetation processes occurred in an area affected by volcanic activity, where a forest mixed with bush/grass changed to open land because of the volcanic eruption in November 2002 and the later recovery process.
Moreover, seasonal variability (climatic regime) might also affect the change patterns of the temporal vegetation dynamics of many land use types such as in many areas of industrial forest plantation and upland.
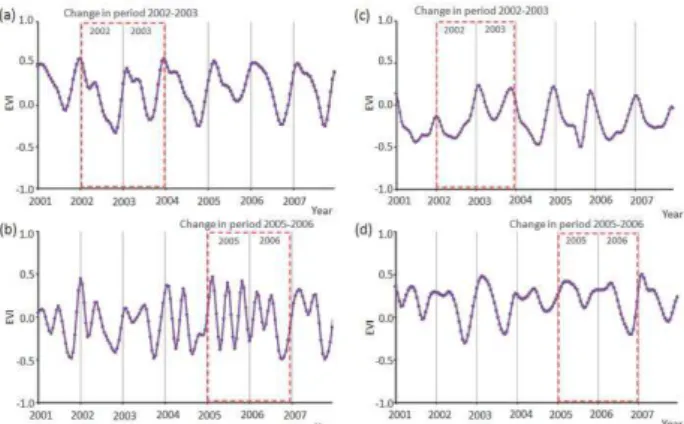
Figure 6 shows several change patterns of agricultural land use which does not necessarily indicate a specific change of land use. These temporary changes are: 1) land in a plantation area is unplanted (barren land) for a long time because of a severe dry season, 2) a temporary change in cropping system, that is a triple cropping system changed to a double cropping system, 3) a pond temporarily changed into vegetated land when the water drained, and 4) intensive upland temporarily changed into barren land because of an extremely dry season, however, the land is then cropped just after the rainy season in following year. This is similar to Lunetta et al. (2006) who mentioned that the phenological issues associated with those land use types represent the temporal complexity of the change detection by a simultaneous analysis.
In addition, characterizing the vegetation dynamics as demonstrated in this article can also monitor even some locations that have the potential to change several times in the long term. Changes from one land use type to another type and conversion into another type, could be identified as well as detected by the changing of temporal pattern more than once, as represented by Figure 7.
In figure 7, pattern 1 indicates a conversion of forested land (bushes) into intensive agricultural land. Meanwhile, pattern 2 represents the changing of a temporal pattern that occurred many times in a rice paddy field. The severe dry season in 2001 and 2007 caused the cropping system changed. The climate variability was caused the cropping system was changed in period 2000-2001, 2001-2002, 2006-2007 and 2007-2008.
3.2 Validation
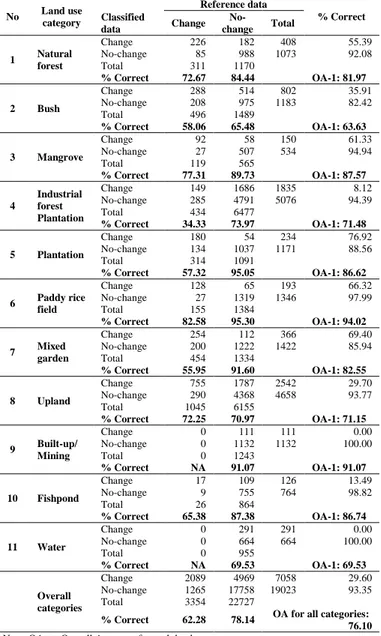
The performance of our change detection approach, which tested actual land use change, revealed an overall accuracy of 76.10%. Comparison accuracy among various land use types reveals variation (Table 2). The rice paddy type had the greatest overall accuracy (94.02%), followed by mangrove (87.57%), plantation (86.62%), mixed garden (82.55%), and natural forest (81.97%).
Figure 5. Several detected changes from a single MODIS pixel that assigned as the actual changes LUCC
Figure 6. Several detected changes from a single MODIS pixel within agricultural lands that assigned as seasonal/
gradual changes
Figure 7. Detection of seasonal changes (temporary changes) which occurred for several times, contributed to the LUCC ISPRS Annals of the Photogrammetry, Remote Sensing and Spatial Information Sciences, Volume I-7, 2012
Table 2 also indicates that the change in the plantations, rice paddies and mixed gardens could be detected more accurately relative to other classes. Meanwhile, the greatest error was associated with upland and industrial forest plantation classes. Specifically, 91.88% of industrial forest plantations and 70.30% of uplands were assigned to changed area; even those areas had not actually changed. At the same time, changes in non-vegetated land use types including built-up (settlement, mining and open-area), fishpond and water-body were not examined, because the reference data for those classes were unacceptable as a change category.
Although the change detection in the land use by recognizing the change of vegetation dynamics is still affected by seasonal change due to the climate variability, the approach is able to monitors the re-vegetation process of non-vegetation areas as well as detecting conversion pathways in vegetated lands. However, the accuracy of the detected change areas might be lower than the area extent indicated in the field because of the inability of MODIS data to resolve an area less than 6.25 ha (250 m x 250 m).
Regional shifts in the temporal vegetation dynamics, including the abrupt and seasonal changes, have numerous consequences relevant to the environment as well as changes in carbon and nitrogen storage, land degradation and loss of biodiversity. Determining the change of temporal vegetation dynamics is the first step in understanding their implications, for example, long-term crop production, and environmental, agricultural and economic sustainability. An understanding of temporal vegetation dynamics to explain the mechanisms and pathways of the land use and land cover change is important because of its relationship to ecosystem characteristics and socio-economic attributes of the land and this will be discussed separately in another article.
4. CONCLUSION
This study used MODIS EVI to detect land use land cover change due to the change in temporal vegetation patterns. The wavelet transform was applied to filter out some noises in 161 time series MODIS EVI. Consequently, the MODIS EVI wavelet-filtered could determine the vegetation phenology in many vegetated lands. This study assumed that consistent land use has a typical, distinct and repeated temporal vegetation dynamics inter-annually; accordingly, a change in land use type could be recognized through a change in the pattern of the long-term vegetation dynamics.
Temporal pattern analysis using the MODIS datasets has significant advantages for both capturing the actual timing of the change event and monitoring of the vegetation growth. However, such capabilities are limited by spatial resolution of the data. The use of multi-temporal data sets is necessary to develop methodologies that utilize information on inter-annual variations to increase the accuracy of the land surface
Table 2. The result of validation on the actual land use change detection for each land use type
No Land use
category Classified data
Reference data
% Correct Change
No-change Total
1 Natural forest
Change 226 182 408 55.39
No-change 85 988 1073 92.08
Total 311 1170
% Correct 72.67 84.44 OA-1: 81.97
2 Bush
Change 288 514 802 35.91
No-change 208 975 1183 82.42
Total 496 1489
% Correct 58.06 65.48 OA-1: 63.63
3 Mangrove
Change 92 58 150 61.33
No-change 27 507 534 94.94
Total 119 565
% Correct 77.31 89.73 OA-1: 87.57
4
Industrial forest Plantation
Change 149 1686 1835 8.12
No-change 285 4791 5076 94.39
Total 434 6477
% Correct 34.33 73.97 OA-1: 71.48
5 Plantation
Change 180 54 234 76.92
No-change 134 1037 1171 88.56
Total 314 1091
% Correct 57.32 95.05 OA-1: 86.62
6 Paddy rice field
Change 128 65 193 66.32
No-change 27 1319 1346 97.99
Total 155 1384
% Correct 82.58 95.30 OA-1: 94.02
7 Mixed garden
Change 254 112 366 69.40
No-change 200 1222 1422 85.94
Total 454 1334
% Correct 55.95 91.60 OA-1: 82.55
8 Upland
Change 755 1787 2542 29.70
No-change 290 4368 4658 93.77
Total 1045 6155
% Correct 72.25 70.97 OA-1: 71.15
9 Built-up/ Mining
Change 0 111 111 0.00
No-change 0 1132 1132 100.00
Total 0 1243
% Correct NA 91.07 OA-1: 91.07
10 Fishpond
Change 17 109 126 13.49
No-change 9 755 764 98.82
Total 26 864
% Correct 65.38 87.38 OA-1: 86.74
11 Water
Change 0 291 291 0.00
No-change 0 664 664 100.00
Total 0 955
% Correct NA 69.53 OA-1: 69.53
Overall categories
Change 2089 4969 7058 29.60
No-change 1265 17758 19023 93.35
Total 3354 22727
% Correct 62.28 78.14 OA for all categories: 76.10 Note: OA-x= Overall Accuracy for each land use category x
5. ACKNOWLEDGEMENTS
The field survey on this research was financially supported by JSPS with the Grant-in-Aid for Scientific Research (B), No. 22405033 and No. 24310169 as well as the JST Basic Research Programs, Core Research for Evolutional Science and Technology (CREST) in Japan.
6. REFERENCES
Boriah, S., Kumar, V. Steinbach, M., Potter, C., Klooster, S., 2008. Land cover change detection: a case study. Proceeding of the
14th ACM SIGKDD International Conference on Knowledge Discovery and Data Mining. pp. 857-865
Bouman, C. A., 2009. Digital Image Processing. Lecture material. School of Electrical and Computer Engineering, Purdue University.
Galford, G. L.; Mustard, J. F.; Melillo, J.; Gendrin, A.; Cerri, C. C. and Cerri, C. E., 2008. Wavelet analysis of MODIS time series to detect expansion and intensification of row-crop agriculture in Brazil. Remote Sensing of Environment, 112, pp. 576-587 Hansen, M., DeFries, R.S., Townshend, J., and Sohlberg, R., 2000.
Global land cover classification at 1 km spatial resolution using a classification tree approach. International. Journal of Remote Sensing, 21, pp. 1331–1364.
Herold, M.; Woodcock, C.; Di Gregorio, A.; Mayaux, P.; Belward, A.; Latham, J. and Schmullius, C. C., 2006. A joint initiative for harmonization and validation of land cover datasets. IEEE
Transactions on Geoscience and Remote Sensing, 44, pp.
1719-1727
Huete, A., Didan, K., Miura, T., Rodriguez, E.P., Gao, X., and Ferreira, L.G., 2002. Overview of the radiometric and biophysical performance of the MODIS vegetation indices.
Remote Sensing of Environment, 83, pp. 195–213.
Huete, A.R., and Liu, H.Q., 1994. An error and sensitivity analysis of the atmospheric- and soil correcting variants of the NDVI for the MODIS-EOS, IEEE Transactions on Geoscience and
Remote Sensing, 32, pp. 897–905.
IGBP, 1988. Toward an Understanding of Global Change: Initial
Priorities for U.S. Contributions to the International
Geosphere-Biosphere Program, Committee on Global Change. Washington DC: National Academy Press.
Lambin, E. F., Baulies, X., Bockstael, N., Fischer, G., Krug, T., Leemans, R., Moran, E. F., Rindfuss, R. R., Sato, Y., Skole, D., II, B. L. T., Vogel, C., 1999. Land-Use and Land-Cover Change (LUCC): Implementation Strategy. IGBP Report 48, IHDP Report 10, Internataional Geosphere-Biosphere Programme (SC-IGBP) and the International Human Dimensions Programme on Global Environmental Change (SC-IHDP), Stockholm Bonn, 125 pp.
Lambin, E. F. and Strahler, A. H., 1994. Change-Vector Analysis in multi-temporal space: A tool to detect and categorize land-cover change processes using high temporal-resolution satellite data Remote Sensing of Environment, 48, pp. 231-244 Lambin, E. F.; Geist, H. J. and Lepers, E., 2003. Dynamics of
land-use and land-cover change in tropical regions. Annual Review
of Environment and Resources, 28, pp. 205-241
Lloyd, D., 2000. A phenological classification of terrestrial vegetation cover using shortwave vegetation index imagery.
International Journal of Remote Sensing, 11, pp. 2269–2279. Lu, X., Liu, R., and Liang, S., 2007. Removal of noise by wavelet
method to generate high quality temporal data of terrestrial MODIS products. Photogrammetric Engineering and Remote
Sensing, 73, pp. 1129–1139.
Lunetta, R. S.; Knight, J. F.; Ediriwickrema, J.; Lyon, J. G. and Worthy, L. D., 2006. Land-cover change detection using multi-temporal MODIS NDVI data. Remote Sensing of
Environment, 105, pp. 142-154
Martinez, B., and Gilabert, M.A., 2009. Vegetation dynamics from NDVI time series analysis using the wavelet transform.
Remote Sensing of Environment, 113, pp. 1823–1842. Mather, A. S., 1999. Land use and cover change. Land Use Policy
16, pp. 143.
Messerli, B., 1997. Geography in a rapidly changing world. In: IGU Bull, 47, pp. 65 - 75.
NASA Land Processes Distributed Active Archive Center (LP DAAC), 2009. MOD13Q1. USGS/Earth Resources Observation and Science (EROS) Center, Sioux Falls, South Dakota.
Pielke, R. A., 2005. Land use and climate change. Science, 310, pp. 1625-1626
Roy, D. P., Borak, J. S., Devadiga, S., Wolfe, R. E., Zheng, M., and Descloitres, J., 2002. The MODIS land product quality
assessment approach. Remote Sensing of Environment, 83(1–2), pp. 62−76.
Setiawan, Y., Yoshino, K., and Philpot, W., 2011. Characterizing temporal vegetation dynamics of land use in regional scale of Java Island, Indonesia, Journal of Land Use Science, DOI:10.1080/1747423X.2011.605178
Setiawan, Y. and Yoshino, K., 2011. Land use change detection by characterizing the vegetation dynamics: Case study of Java Island, Indonesia. Journal of the Japan Society of
Photogrammetry and Remote Sensing, 50(2), pp. 96-103
Turner, B. L. I., Skole, D., Sanderson, S., Fisher, G., Fresco, L., Leemans, R., 1995. Land-use and land-cover change science/research plan. IGBP Report 35, IHDP Report 07, Internataional Geosphere-Biosphere Programme (SC-IGBP) and the International Human Dimensions Programme on Global Environmental Change (SC-IHDP), Stockholm Geneva. Verbesselt, J., Hyndman, R., Newnham, G., and Culvenor, D., 2010. Detecting trend and seasonal changes in satellite image time series. Remote Sensing of Environment, 114, pp. 106-115 Xiao, X.M., Braswell, B., Zhang, Q.Y., Boles, S., and Frolking, S.,
2003. Sensitivity of vegetation indices to atmospheric aerosols: continental-scale observations in northern Asia. Remote
Sensing of Environment, 84, pp. 385–392. ISPRS Annals of the Photogrammetry, Remote Sensing and Spatial Information Sciences, Volume I-7, 2012