ACPD
9, 15423–15451, 2009Cluster analysis of an impact of air back-trajectories
A. Rozwadowska et al.
Title Page
Abstract Introduction
Conclusions References
Tables Figures
◭ ◮
◭ ◮
Back Close
Full Screen / Esc
Printer-friendly Version
Interactive Discussion Atmos. Chem. Phys. Discuss., 9, 15423–15451, 2009
www.atmos-chem-phys-discuss.net/9/15423/2009/ © Author(s) 2009. This work is distributed under the Creative Commons Attribution 3.0 License.
Atmospheric Chemistry and Physics Discussions
This discussion paper is/has been under review for the journalAtmospheric Chemistry
and Physics (ACP). Please refer to the corresponding final paper inACPif available.
Cluster analysis of an impact of air
back-trajectories on aerosol optical
properties at Hornsund, Spitsbergen
A. Rozwadowska1, T. Zieli ´nski1, T. Petelski1, and P. Sobolewski2
1
Institute of Oceanology, Polish Academy of Sciences, Sopot, Poland
2
Institute of Geophysics, Polish Academy of Sciences, Warsaw, Poland
Received: 30 June 2009 – Accepted: 3 July 2009 – Published: 20 July 2009
Correspondence to: A. Rozwadowska ([email protected])
ACPD
9, 15423–15451, 2009Cluster analysis of an impact of air back-trajectories
A. Rozwadowska et al.
Title Page
Abstract Introduction
Conclusions References
Tables Figures
◭ ◮
◭ ◮
Back Close
Full Screen / Esc
Printer-friendly Version
Interactive Discussion
Abstract
In this paper spectra of aerosol optical thickness from AERONET (AErosol RObotic NETwork) station at Hornsund in the southern part of Spitsbergen were employed to study the impact of air mass history on aerosol optical thickness (AOT(500)) and Angstrom coefficient. Backward trajectories computed by means of NOAA HYSPLIT
5
model were used to trace air history. It was found that in spring changes in AOT values over the Hornsund station were influenced by the at least 8-day trajectories of air, which was advected both in free troposphere and in the boundary layer. However, the free tropospheric advection was dominating. In summer the AOT variability was created mainly by local conditions, local direction and speed of advection (1-day trajectories).
10
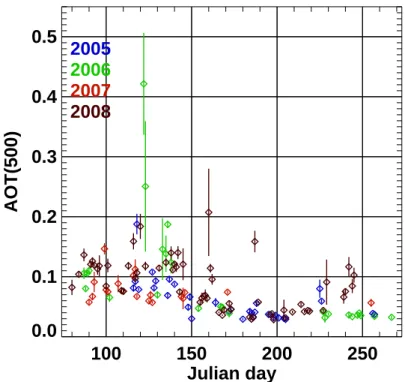
During the ASTAR 2007 campaign aerosols near Hornsund showed low AOT values ranging from 0.06 to 0.09, which is lower than the mean AOT(500) for spring seasons from 2005 to 2007 (0.110±0.007; mean±standard deviation of mean). The 9 April 2007 with AOT(500)=0.147 was an exception. Back-trajectories belonged to the clus-ters of low and average cluster mean AOT value. Beside the maximum AOT of the 9
15
April 2007, the observed AOT values were close to the means for the clusters to which they belonged or were lower than the means.
1 Introduction
Atmospheric aerosols originate from a wide variety of sources in both the marine and the continental environments. Aerosol content varies significantly depending upon the
20
air mass source and history. The Arctic is characterized with a low aerosol load, how-ever, aerosol optical thickness increases considerably in late winter and spring (Arctic haze) and during direct advections of polluted air from lower latitudes in other seasons (e.g. Herber et al., 2002; Tomasi et al., 2007; Quinn et al., 2007; Engvall et al., 2008).
Nearly all pollution in the high Arctic originates from more southerly latitudes. Local
25
ACPD
9, 15423–15451, 2009Cluster analysis of an impact of air back-trajectories
A. Rozwadowska et al.
Title Page
Abstract Introduction
Conclusions References
Tables Figures
◭ ◮
◭ ◮
Back Close
Full Screen / Esc
Printer-friendly Version
Interactive Discussion 2007). Long-range transport of aerosols and its gas precursors is most abundant in
winter and spring, when the shift of a polar front towards south facilitates the advection of polluted air from mid-latitudes, mainly from Europe and Asia. Stable atmosphere and relatively low scavenging by clouds and precipitation are additional factors which influence the effectiveness of transport of aerosols and gas precursors (Quinn et al.,
5
2007). The end of the Polar night causes the generation of aerosols from gas pre-cursors due to photochemically induced reactions. In summer the Polar front moves further north making advection of air from mid-latitude more difficult. Also the dominant direction of circulation changes. While in winter, the mean circulation is characterized by fast low-level transport from Northern Eurasia across the Arctic to North America,
10
the typical pathway in summer goes from the North Atlantic Ocean across the high Arctic toward the North Pacific Ocean. Moreover, the summer transport is slower (Law and Stohl, 2007). In spring (i.e. mid-April to May) almost the whole Arctic region is dominated by high pressure situation. In Svalbard it results in typically persistent air-flow from the Arctic, and slow transport from the northern part of Russia, Scandinavia
15
and the Atlantic (Eneroth et al., 2003; Engval et al., 2007). Also biomass burning in Eurasia and North America and advection of desert dust play an important role in the Arctic air pollution (Stohl et al., 2006; Treffeisen et al., 2007; Generoso et al., 2007; Tomasi et al., 2007; Stone et al., 2007).
Natural, local Arctic sources of aerosol are usually far less effective with regard to
20
light attenuation than the particles connected to long-range transport. Local, Arctic aerosols comprise of sea salt particles (Petelski and Piskozub, 2006), mineral dust, products of activity of volcanoes from the Khamtchatka Peninsula and Alaska (Law and Stohl, 2007; Tomasi et al., 2007; Nagel et al., 1998), the oxidation products of dimethyl-sulfide emitted from the sea surface (Hillamo et al., 2001), and insoluble
or-25
ACPD
9, 15423–15451, 2009Cluster analysis of an impact of air back-trajectories
A. Rozwadowska et al.
Title Page
Abstract Introduction
Conclusions References
Tables Figures
◭ ◮
◭ ◮
Back Close
Full Screen / Esc
Printer-friendly Version
Interactive Discussion found that under moderate-to-high wind conditions, sea-spray aerosol optical thickness
was comparable to that associated with pollution plumes over oceanic regions.
Aerosol sources related to anthropogenic activity and the transportation pathways have been investigated at different Arctic stations such as: Alert, Canadian North Ther-itories (Lin et al., 2001) and Station North, Greenland (Heidam et al., 2004). Stohl et
5
al. (2002) performed a 1-year simulation of the transport of six passive tracers, re-leased over the continents according to an emission inventory for carbon monoxide. They found that European contribution was several times higher than the Asian and the American. The pollution sources have been identified, however, models do not agree on the importance of certain pollution elements, e.g. recent modeling studies
10
yield conflicting results on whether Southern Asia is a significant source of pollutants to the Arctic or not (Quinn et al., 2007). Besides only a small number of papers discuss long-range transport and its impact on aerosol optical properties, and this is especially true in the European Arctic (Herber et al., 2002).
Pollution can be advected to the Arctic both in the boundary layer and in free
tropo-15
sphere (Khattatov et al., 1997; Lund Myhre et al., 2007; Quinn et al., 2007) and its resi-dence time in the atmosphere depends on a number of factors such as e.g. scavenging by cloud and precipitation (e.g. Khattatov et al., 1997). In order to analyze long-range transport of pollutants to the Arctic 5-day or 10-day back-trajectories are most often used (Eneroth et al., 2003; Lin et al., 2001). Eneroth et al. (2003) suggested that 5-day
20
trajectories are not sufficiently long to explain some CO2variability.
The aim of this work was to determine the contribution of aerosol transport to aerosol optical thickness and Angstroem exponent variability in the southern part of Svalbard, to identify main sources and paths of air advection to the area of South Svalbard and to determine basic aerosol optical characteristics for each of them. The authors also
25
back-ACPD
9, 15423–15451, 2009Cluster analysis of an impact of air back-trajectories
A. Rozwadowska et al.
Title Page
Abstract Introduction
Conclusions References
Tables Figures
◭ ◮
◭ ◮
Back Close
Full Screen / Esc
Printer-friendly Version
Interactive Discussion ground” for aerosol measurements performed at Hornsund during ASTAR campaign.
The cluster analysis of air back-trajectories employed in the paper is a technique widely used to identify transport patterns and potential sources of both anthropogenic pollution and natural constituents of the atmosphere, including atmospheric aerosols (e.g. Abdalmogith and Harrison, 2005; Owega et al., 2006; Katragkou et al., 2009; Xia
5
et al., 2007). It is also used to determine how aerosol optical properties observed over the station differ depending on source region and transport pathways (Xia et al., 2007; Toledano et al., 2009; Gogoi et al., 2009; Yan et al., 2008). This method has been used for various parts of the world but only one paper concerns the European High Arctic. Eneroth et al. (2003) applied cluster analysis of 5-day back-trajectories to identify
dis-10
tinct transport patterns for Ny ˚Alesund (Svalbard) and compare the trajectory clusters to CO2measurements to study to what degree different atmospheric flow patterns in-fluence the variability of the atmospheric CO2. In the present paper cluster analysis of back-trajectories is used to analyze the variability of aerosol optical properties in Hornsund, Svalbard.
15
2 Methodology
2.1 Data
The authors used aerosol data from the AERONET (AErosol RObotic NETwork) sta-tion at Hornsund from the period 2005–2008. The measurements in Hornsund are performed from late March to late September. The Hornsund station provides total
20
aerosol optical thickness (AOT) for selected wavelengths (340, 380, 440, 500, 675, 870, 1020 nm), water vapor content in the atmosphere as well as contributions of the fine and coarse modes of aerosol size distribution to the total AOT forλ=500 nm. For the purpose of this paper the authors used mainly the AOT data.
During the ASTAR 2007 campaign, which lasted from 28 March to 16 April a number
25
ACPD
9, 15423–15451, 2009Cluster analysis of an impact of air back-trajectories
A. Rozwadowska et al.
Title Page
Abstract Introduction
Conclusions References
Tables Figures
◭ ◮
◭ ◮
Back Close
Full Screen / Esc
Printer-friendly Version
Interactive Discussion aerosol concentration and size distribution from measurements with Classical
Scatter-ing Aerosol Spectrometer Probe CSASP-100-HV-SP.
The original spectra obtained from AERONET were additionally cloud screened. Since the authors did not have independent cirrus cloud measurements, for fur-ther quality assessment the character of temporal changes in AOT, AOT fine and
5
AOT coarse as well as meteorological observations have been used (Hornsund is a WMO station No. 01003). Cases when higher AOT temporal variability was caused only by coarse particles, indicating high probability of thin cirrus clouds or drifting snow crystals were rejected. Such an approach is justified by the high correlation of the ele-vated concentration of coarse mode aerosol (measured with CSASP-100-HV-SP) with
10
the blowing snow and precipitation cases observed during ASTAR campaign (Rozwad-owska et al., 2008).
For further analyses days during which a minimum of 5 measurements were made were chosen. For each day an average Angstroem exponent (α) and an average AOT(500) have been calculated. The error of the daily average AOT is lower than
15
0.005, with exception to several cases of high AOT and significant daily variability. Typ-ical errors of a daily averageαare 0.07 for AOT(500)=0.12, 0.1 for AOT(500)=0.07 and 0.2 for AOT(500)=0.04. The daily variability and nonlinearity of spectrum (in a log-log scale) are the main causes of the averageαerror. Further in the text AOT(500) andα mean daily means of AOT(500) andα(440–870), respectively.
20
2.2 Backward trajectories
Backward trajectories computed by means of NOAA HYSPLIT model (Draxler and Rolph, 2003) were used to trace the air history. The trajectories were calculated for three atmospheric heights: 1 km, 2.5 km and 5 km a.s.l. One-kilometer trajectory typi-cally represents airflow in the boundary layer (BL), 5-km in free troposphere (FT), while
25
ACPD
9, 15423–15451, 2009Cluster analysis of an impact of air back-trajectories
A. Rozwadowska et al.
Title Page
Abstract Introduction
Conclusions References
Tables Figures
◭ ◮
◭ ◮
Back Close
Full Screen / Esc
Printer-friendly Version
Interactive Discussion
2.3 Cluster analysis
Cluster analysis was used in the paper to classify air backward trajectories into groups of similar history, i.e. similar direction of advection and velocity of air movement. It was shown that the trajectory clusters are associated with the features of large scale atmospheric circulation (Dorling et al., 1992). A non-hierarchical clustering algorithm
5
described by Dorling et al. (1992) was employed in this study. The authors used the data set of geographical coordinates of air parcel back-trajectories, which reached the Hornsund station, calculated for 1 h periods for a range of time between 0 to 192 h prior to the arrival above the station.
Before the cluster analyses the geographical coordinates were changed into x, y
10
on a plane using the azimuthal equidistant projection with a central point with the geo-graphical position of the Hornsund station. It was assumed that the distortion related to the projection had a secondary impact on the classification. The calculated Euclidean distances di j between i-th trajectory and a typical (mean) j-th cluster trajectory are defined as follows:
15
di j2 =Xl=N level
l=1
Xk=N hour
k=1
h
xi kl−Xj kl2
+ yi kl −Yj kl2i
(1) where:
k– index equal to air pass time from a given trajectory point to Hornsund expressed in hours
l – number of trajectory level considered
20
xi kl,yi kl – coordinates on the plane ofk-th point of thei-th trajectory reaching thel-th height above the station,
Xj kl,Yj kl – coordinates on the plane of k-th point of an average trajectory of thej-th cluster reaching thel-th height above the station.
The algorithm minimized the following factor:
25
f =Xj=N clust
j=1
Xi=N traj j
i=1 d
2
ACPD
9, 15423–15451, 2009Cluster analysis of an impact of air back-trajectories
A. Rozwadowska et al.
Title Page
Abstract Introduction
Conclusions References
Tables Figures
◭ ◮
◭ ◮
Back Close
Full Screen / Esc
Printer-friendly Version
Interactive Discussion wherei is a subsequent trajectory inj-th cluster,N traj j denotes a number of
trajec-tories of thej-th cluster, andN clust is a number of clusters.
Clustering was performed for 2 “seed” trajectory files, trajectories for single altitudes (1, 2.5 or 5 km a.s.l.), combinations of 2 altitudes and for trajectories at three height levels simultaneously. Clustering was made for trajectories of lengths between 24 h (1
5
day) to 192 h (8 days). Cluster numbers ranged from 30 to 5.
Only trajectory coordinates have been used in the clustering algorithm, while the additional factors such as topography, land cover, sea ice, atmospheric stability, pre-cipitation or certain events (such as fires) have not been explicitly included. However, some of these factors are related to geographical coordinates. Due to significant
sea-10
sonal differentiation of the Arctic aerosol properties the spring data (in this paper March, April, May – Julian days up to 147) and the summer data (mid June to mid September, Julian days from 165) were analyzed separately. The transition period (Engvall et al., 2008) was ignored. Figure 1 shows temporal variations of AOT during measurement years in Hornsund station.
15
3 Results
3.1 Importance of aerosol transport in aerosol AOT variability
The aim of the cluster analysis of air trajectories was to determine the importance of aerosol transport in AOT and Angstroem exponent variability in the southern part of Svalbard. The authors undertook the attempt to determine the height of air advection
20
ACPD
9, 15423–15451, 2009Cluster analysis of an impact of air back-trajectories
A. Rozwadowska et al.
Title Page
Abstract Introduction
Conclusions References
Tables Figures
◭ ◮
◭ ◮
Back Close
Full Screen / Esc
Printer-friendly Version
Interactive Discussion Relative variance of AOT andα has been analyzed using the following formula:
rel VAR (AOT)=
Pj=N clust
j=1
Pi j=N j
i j=1
AOTi j− hAOTij2 Pi=N
i=1 AOTi− hAOTi
2
(3)
where N is the total number of cases (measurement days), N clust is a number of clusters,N j number of cases from thej-th cluster, AOTi j is an AOT for thei-th case from thej-th cluster, <AOT>j is an average AOT for all cases from the j-th cluster.
5
The rel VAR(α) is defined in the same way. For variance calculations values most deviated from the seasonal average and thus the dominating values of variance have been ignored, e.g. 2 and 3 May 2006 (agricultural fires in Eastern Europe, Lund Myhre et al., 2007) and 5 July and 29 August 2008.
Relative variances of AOT andα strongly depend on a number of clusters, i.e. they
10
decrease with an increase of a number of clusters. However, the number of one-element clusters also increases along with an increase in a number of clusters. Due to a relatively low number of measurement days in both seasons (about 60 per season) the authors decided that the division into 10 clusters is optimal. The dependencies pre-sented below refer to trajectory division into 10 clusters. For both seasons the impact
15
of a number of factors, such as trajectory length, trajectory height, or a combination of trajectory heights used in cluster analyses, on relative variance has been analyzed.
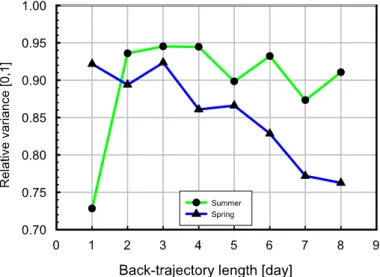
Figure 2 presents the comparison of the impact of trajectory length on relative vari-ance rel VAR(AOT) in spring and summer and for all three height levels used together in cluster analysis. The set geometry (convergence of trajectories to one point and
20
projection to a plane) favors fragments of trajectories most distant from the Hornsund station. In spring rel VAR(AOT) drops with an increase of trajectory length. This sug-gests that the AOT variability in the Hornsund station is influenced by at least 8-day long air mass history. With 10 clusters and 8-day trajectories the AOT variance drops to about 0.75 of the value of the variance without clustering the trajectories. Cluster
25
maxi-ACPD
9, 15423–15451, 2009Cluster analysis of an impact of air back-trajectories
A. Rozwadowska et al.
Title Page
Abstract Introduction
Conclusions References
Tables Figures
◭ ◮
◭ ◮
Back Close
Full Screen / Esc
Printer-friendly Version
Interactive Discussion mum of 10% of variance in spring. In summer the situation is different. The greatest
decrease in AOT variance, rel VAR(AOT)<0.73, is observed with cluster analysis of 1-day trajectories, which suggests that in summer AOT variability is mainly related to local atmospheric conditions, local velocity and direction of air advection. Small drop of a relative variance along with an increase of trajectory length may be attributed to
5
an impact of long-range transport on AOT variability.
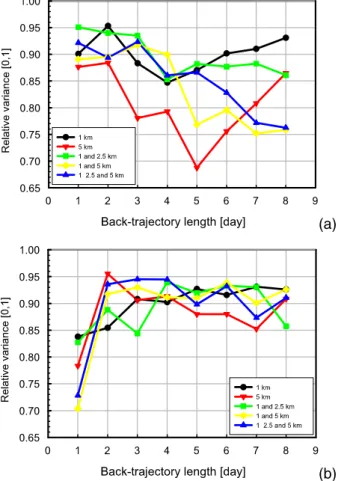
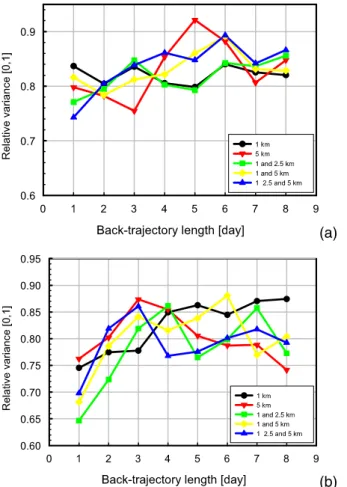
Figure 3 presents influence of air back-trajectory length and trajectory level combi-nation in cluster analysis on rel VAR(AOT). The following has been observed for spring (Fig. 3a):
1. In cases of clustering trajectories at a single altitude above the Hornsund
sta-10
tion, cluster analysis of advection in free troposphere (trajectories at 5 km a.s.l.) decreases AOT variance twice as much as the clustering of boundary layer tra-jectories (advection at 1 km and a combination of altitudes of 1 and 2.5 km), which suggests a dominating role of advection in free troposphere in the AOT variability. 2. In cases of clustering trajectories at a single altitude above the Hornsund station,
15
there is a certain trajectory length for which rel VAR(AOT) is minimum, 5 days for advection at 5 km and 4 days for advection in the boundary layer. Most probably the cluster analysis of longer “single-level” trajectories is not representative any-more for a total (i.e. for all altitudes above the station) advection to the Hornsund station.
20
3. Using a combination of trajectories from the boundary layer and free troposphere (1+5 km, 1+2.5+5 km), drop of rel VAR(AOT) can be observed along with the increase of trajectory length from 1 to 8 days. This suggests that at least 8-day long transport both in the boundary layer and free troposphere are important for the AOT variability.
25
ACPD
9, 15423–15451, 2009Cluster analysis of an impact of air back-trajectories
A. Rozwadowska et al.
Title Page
Abstract Introduction
Conclusions References
Tables Figures
◭ ◮
◭ ◮
Back Close
Full Screen / Esc
Printer-friendly Version
Interactive Discussion 5 km. Use of simultaneous advections in the boundary layer and free troposphere
slightly increases variance at the same number of clusters. This is an artifact of using the same number of clusters with growing number of altitude levels em-ployed in the cluster analysis.
Figure 3b presents the impact of trajectory length and a combination of trajectory
5
levels used in cluster analysis on a relative variance of AOT in summer. The following features have been observed:
1. Independent of a number of trajectory levels and their combination used in cluster analysis rel VAR(AOT) is the lowest for 1-day trajectories, which indicates that in summer the AOT variability is mainly created by a local situation, local direction
10
and velocity of advection (1-day trajectories).
2. In cluster analyses of boundary layer trajectories (1 km a.s.l.) rel VAR(AOT) in-creases along with an increase of trajectory length, while in clustering of a com-bination of trajectories including a trajectory in free troposphere (5 km, 1+5 km, 1+2.5+5 km) for longer trajectories a slight drop of rel VAR(AOT) is observed.
15
Most probably this is an impact of long-range transport on AOT variability.
3. With 10 clusters the variance of the AOT is mostly decreased with 1-day advec-tions in both free troposphere and the boundary layer (rel VAR(AOT)=0.7). The best effect results from a combination of the following levels: 1+5 km, 2.5+5 km and 1+2.5+5 km.
20
Figure 4a shows that unlike the variability of AOT, Angstroem exponent variability is mainly created by a local situation (1-day trajectories at 1+2.5+5 km) in spring. For a level of 1 km rel VAR(α) is practically independent of trajectory length, while for other altitudes it increases with trajectory length. In summer (Fig. 4b) the variance is also best explained by a local situation (for all trajectory level combinations rel VAR(α) is in
25
ACPD
9, 15423–15451, 2009Cluster analysis of an impact of air back-trajectories
A. Rozwadowska et al.
Title Page
Abstract Introduction
Conclusions References
Tables Figures
◭ ◮
◭ ◮
Back Close
Full Screen / Esc
Printer-friendly Version
Interactive Discussion Even such robust classification, based on a modest data set, with a small number
of clusters, without explicit use of orography, land cover, precipitation, events (e.g. fires) and advecting air height along trajectory may explain about 30% of AOT variance and 35% of Angstroem exponent variance. For comparison, clustering of 3-day back-trajectories ending in Beijing explained from about 25% to 47% of variance in aerosol
5
optical thickness in Beijing, depending on season (Xia et al., 2007).
3.2 Back-trajectory clusters for Hornsund station and their aerosol optical properties
The results of the optimum for our data set, i.e. mostly decreasing the variance of AOT, trajectory division into 10 clusters (i.e. clustering of 5-day trajectories at 5 km in spring
10
and of 1-day trajectories at 2.5 and 5 km in summer) are presented in Figs. 5 and 6. In this section all cases have been used, including the extreme ones, which were rejected during the rel VAR(AOT) analyses. Figure 5a and b shows the average values of AOT and Angstroem exponent for particular clusters along with standard deviations of respective mean values in spring and summer. Figure 6a and b presents cluster
15
average 5-day trajectories at 5 km a.s.l. in spring and 1-day trajectories at 2.5 and 5 km a.s.l. in summer, respectively.
3.2.1 Spring
In spring the minimum cluster mean AOT is observed for clusters 7 (<AOT>=0.086±0.009, <α>=1.37±0.10) and 8 (<AOT>=0.087±0.009,<α>=1.46±
20
0.08). Numbers in parenthesis denote average values of AOT and α as well as standard deviations of mean resulting from the variability within clusters. Cluster 7 also shows the lowest value of average Angstroem exponents. In cluster 7 an average advection at 5 km a.s.l. is from the area of the Baffin Sea (5-day trajectory). Eight-day trajectories for individual days reach Greenland and Northern Canada. Directly at
25
ACPD
9, 15423–15451, 2009Cluster analysis of an impact of air back-trajectories
A. Rozwadowska et al.
Title Page
Abstract Introduction
Conclusions References
Tables Figures
◭ ◮
◭ ◮
Back Close
Full Screen / Esc
Printer-friendly Version
Interactive Discussion trajectories advect air mainly from the Barents and Greenland Seas and the Arctic
Ocean crossing over Northern Scandinavia. In cluster 8 an average advection at 5 km is from over the Labrador (5-day trajectory). Eight-day trajectories are mainly from over the Northern Canada. Lower level trajectories bring air from Northern Canada and the Nordic Seas (i.e. the Norwegian, Greenland and Barents Seas) as well as
5
northern parts of Western Siberia and Europe.
The maximum cluster mean AOT in spring is found for clusters 3 (<AOT>=0.123±0.011, <α>=1.46±0.07) and 9 (<AOT>=0.121±0.007,<α>=1.43±
0.03) as well as one-element clusters – 6 (AOT=0.251, α=1.79) and 10 (AOT=0.184, α=1.64). In cluster 3 an average 5-day advection at 5 km is from over the central
10
Siberia. Eight-day trajectories at 5 km a.s.l. come from central and Western Siberia up to China and Turkmenistan. Lower level trajectories bring air mainly from over the Arc-tic Ocean and central and Eastern Siberia. In cluster 9 an average 5-day advections at 5 km a.s.l. are from the northern coasts of the Caspian Sea. Eight-day trajectories bring air from the area of the Black Sea, Caspian Sea, Belarus and East-European
15
Plateau. At lower levels the air flows mainly from the areas of the Kara Sea and the Barents Sea. One-element cluster 6 is an example of advection described by Lund Myhre et al. (2007) (agricultural fires in Eastern Europe, 3 May 2006). A trajectory at 5 km a.s.l. brings air from Romania, while lower ones passes over Western Siberia, Estonia and Scandinavia. In cluster 10 a trajectory at 5 km brings air masses from over
20
the Atlantic, however, the lower ones cross over the central Siberia (e.g. near Norilsk) and they seem to determine high AOT values (one-element cluster). In general in clusters of high AOT air at 5 km a.s.l. comes from Asia and Europe (trajectories reach down to 40◦N); the lower trajectories, not included in this cluster classification, bring air mainly from over the Arctic Ocean, Barents Sea, as well as central and Eastern
25
Siberia. This is consistent with findings by other authors.
ACPD
9, 15423–15451, 2009Cluster analysis of an impact of air back-trajectories
A. Rozwadowska et al.
Title Page
Abstract Introduction
Conclusions References
Tables Figures
◭ ◮
◭ ◮
Back Close
Full Screen / Esc
Printer-friendly Version
Interactive Discussion Also advection from the northern sector (from NW to NE) is typical for these clusters.
3.2.2 Summer
In summer clusters of lowest mean AOT: cluster 3, 4 and 6, show low variability of AOT (no events). Eight-day trajectories are differentiated but advections from over the Arc-tic Ocean, Nordic Seas and the North AtlanArc-tic dominate. Minimum cluster mean AOT
5
and Angstrom exponent values (<AOT>=0.035±0.002, <α>=1.20±0.09) were found for cluster 4. Air flows to the Hornsund station from NW. Fast advection during the last day may have resulted in a relatively lowα. Eight-day trajectories at 1 km come mainly from over the Arctic Ocean, at 2.5 km a.s.l. from over the Arctic Ocean and the Greenland Sea as well as Northern Canada and at 5 km a.s.l. – from over the
Arc-10
tic Ocean, the Greenland Sea, Northern Canada, and Greenland. Some trajectories reach Siberia and the Atlantic Ocean below 40◦N. Cluster 3 is characterized by low AOT values and high Angstroem exponent (<AOT>=0.039±0.002,<α>=1.54±0.07). Air flows to the Hornsund station from SW (one-day trajectories). The Angstroem ex-ponent is high in comparison with cluster 4, but the advection is slower during the day
15
before the air arrival at the station. Eight-day trajectories at 1 km a.s.l. come mainly from over the Greenland and Norwegian Seas but also from Scandinavia, Labrador via Great Britain, and the Arctic Ocean. At altitudes of 2.5 km and 5 km the air flows from Greenland, Barents Sea and from Northern Canada via Atlantic. Cluster 6 also has low AOT and high Angstroem exponent values (<AOT>=0.041±0.005,<α>=1.60±0.06).
20
Air arrives at the station from NNW. Eight-day trajectories at 1 km a.s.l. come from over the Arctic Ocean. Eight-day trajectories at 2.5-km and 5-km levels indicate that respec-tive 8 and 7 days before reaching the station the air was over the Eastern and Central Siberia. Cluster 9 is another cluster with low AOT and high Angstroem exponent val-ues (<AOT>=0.040±0.003,<α>=1.51±0.09). It is a local cluster. During the last day
25
ACPD
9, 15423–15451, 2009Cluster analysis of an impact of air back-trajectories
A. Rozwadowska et al.
Title Page
Abstract Introduction
Conclusions References
Tables Figures
◭ ◮
◭ ◮
Back Close
Full Screen / Esc
Printer-friendly Version
Interactive Discussion over the area of the Nordic Seas. Eight-day trajectories at higher altitudes are very
differentiated.
The maximum mean AOT has been obtained for clusters 7 (<AOT>=0.065±0.015, <α>=1.59±0.09) and 10 (<AOT>=0.071±0.030, α=1.63±0.04) and one-element cluster 2 (AOT=0.085, α=1.75). High mean AOT value for clusters 7 and 10 results
5
from the fact that apart from days with low AOT values around 0.03, 0.04, there are extreme events included in these clusters. This also caused significant standard de-viation. Clusters 7, 10 and 2 also show high Angstroem exponent values. In cluster 7 air flows directly to the station from N (from NE to NW). Eight-day trajectories at all altitudes come mainly from over the Arctic Ocean. Some trajectories are from over the
10
Eastern and Central Siberia but the “events” recorded in this cluster (AOT>0.1) are not associated with advection from Siberia. In cluster 10 direct inflow to the station (1-day trajectories) is from NW at 2.5 km, while at 5 km from N. Eight-day trajectories are very differentiated. A high AOT event in this cluster (AOT=0.159) is related to advection from Western and Central Siberia at altitudes of 2.5 km and 5 km. In one-element cluster 2,
15
8-day trajectories at 1 km come from Canadian Archipelago, at 2.5 km a.s.l. from over the Northern Atlantic and Iceland and at 5 km from over Western Canada and Pacific.
In summer the most abundant clusters involve cluster 1 (14 days out of 60), cluster 4 (9/60), cluster 3 (7/60) and cluster 9 (7/60). Beside cluster 1 all other 3 clusters show low AOT values. Advection from the western sector (from S to N) is typical for these
20
clusters.
Summing up the so-called events occur mainly in northern and “terrestrial” clusters (5, 7 and 10), i.e. when air, especially at 2.5 km and 5 km cross over the Spitsbergen island and also for a marine cluster 1. The “terrestrial” clusters (10, 7, 5, 2) show the highest average AOT values. Cases of air advection from over the continents
(8-25
day trajectories) can be observed in all clusters but in many instances are responsible for only slight increase or no effect in the AOT values. Similarly, not always 8-day trajectories for days with higher AOT lead to over the land.
ACPD
9, 15423–15451, 2009Cluster analysis of an impact of air back-trajectories
A. Rozwadowska et al.
Title Page
Abstract Introduction
Conclusions References
Tables Figures
◭ ◮
◭ ◮
Back Close
Full Screen / Esc
Printer-friendly Version
Interactive Discussion et al., 2003) this clustering comprises of only days when AOT measurements were
possible. Moreover, Eneroth et al. (2003) used ten-year data set of trajectories and applied a single clustering to the whole period, regardless of the season. Our data set is very modest. Despite the differences both classifications are consistent with respect to the dominating directions of advection in spring and summer.
5
3.3 Data collected during the ASTAR 2007 campaign versus trajectory
classification
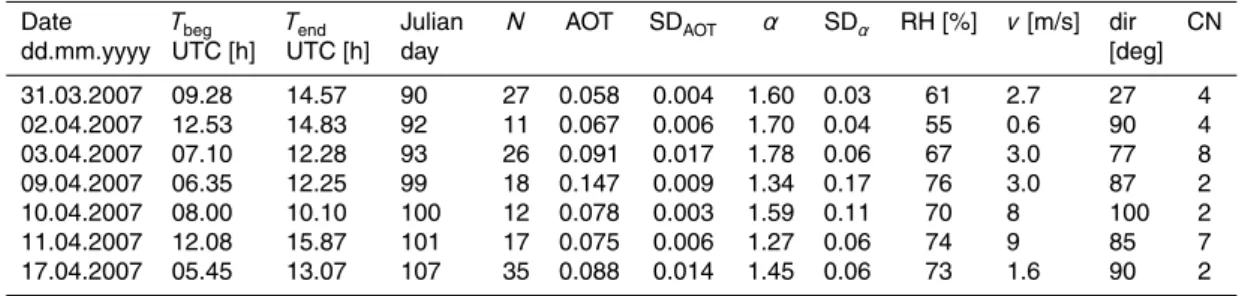
The ASTAR 2007 campaign lasted from 31 March to 16 April 2007. Daily mean aerosol properties, meteorological conditions and 5-day back-trajectory clusters during the campaign are presented in Table 1. The cluster number relates to the cluster
clas-10
sification for spring given in Sect. 3.2. During the AOT measurements at the Hornsund station relative humidity ranged from 55 to 76%, wind speed did not exceed 3 m/s, and wind was mainly from eastern directions. Only during 10 and 11 April mean wind speed was 8 and 9 m/s, respectively. It must be kept in mind that wind direction at the Hornsund station is strongly modified by latitudinal location of the Hornsund fiord and
15
thus it does not represent the air transport in the boundary layer.
During the ASTAR 2007 campaign low AOT values were recorded, ranging from 0.06 to 0.09, with exception to 9 April when AOT(500)=0.147. For comparison the 4-year mean value of AOT(500) in spring in Hornsund is 0.110±0.007 (mean±standard deviation of the mean). Assuming that the average from the lowest 20% of AOT during
20
the spring may be treated as seasonal background, the background AOT equals to 0.067±0.002. With exception to 9 April all daily mean AOT values during ASTAR 2007 were within 40% of the lowest cases of AOT for all spring seasons from the period of 2005 to 2008. The air back-trajectories belonged to the clusters of low (clusters 7 and 8) and average (clusters 2 and 4) cluster mean AOT value (compare Sect. 3.2). Beside
25
the maximum AOT of 9 April, the observed values of the AOT were close to the means for the clusters to which they belong or were lower than the means.
ACPD
9, 15423–15451, 2009Cluster analysis of an impact of air back-trajectories
A. Rozwadowska et al.
Title Page
Abstract Introduction
Conclusions References
Tables Figures
◭ ◮
◭ ◮
Back Close
Full Screen / Esc
Printer-friendly Version
Interactive Discussion to the cluster mean (<AOT>=0.107±0.014) and equals 0.147. The trajectory at 1 km
shows air advection in the boundary layer from the Central Siberian Plateau. Even though the 1-km trajectory does not cross over Norilsk its influence can not be fully ruled out. This is an example to show that although in spring long-range transport in free troposphere dominates, several trajectory levels should be used to analyze the
5
impact of long-range transport on aerosol optical properties.
4 Conclusions
In spring the variability in AOT values over the Hornsund station is influenced by the at least 8-day long history of air, which is advected both in free troposphere and in the boundary layer. The free tropospheric advection is dominating, which is confirmed
10
by the lowest values of rel VAR(AOT) for cluster classification of 5-km trajectories and combined 2.5 and 5 km clustering. One-day trajectories explain only 10% of AOT vari-ance. In summer the AOT variability is created mainly by local conditions, local direction and speed of advection (1-day trajectories). Impact of long-range advection in free tro-posphere (8-day trajectories) on AOT is also visible. The several-day long trajectories
15
explain extreme cases.
The division of cases versus the trajectory type decreases the variance of AOT and Angstroem exponent. The magnitude of the decrease depends on trajectory length, its altitude, number of levels considered in cluster analysis and a number of clusters. With 10 clusters and the AOT data recorded the greatest decrease of variance (about 30%)
20
was obtained with clustering of 5-day trajectories at 5 km (spring) and 1-day trajectories at 2.5+5 km (summer).
In spring the most abundant clusters for Hornsund are the ones of aver-age (cluster 4, <AOT>=0.106±0.017; cluster 2, <AOT>=0.107±0.014, cluster 1 <AOT>=0.113±0.008) and high (cluster 3, <AOT>=0.123±0.011) cluster mean AOT.
25
ACPD
9, 15423–15451, 2009Cluster analysis of an impact of air back-trajectories
A. Rozwadowska et al.
Title Page
Abstract Introduction
Conclusions References
Tables Figures
◭ ◮
◭ ◮
Back Close
Full Screen / Esc
Printer-friendly Version
Interactive Discussion 10) air at 5 km a.s.l. comes mainly from Asia and Europe (trajectories reach down to
40◦N); the lower trajectories bring air mainly from over the Arctic Ocean, Barents Sea, as well as central and Eastern Siberia. This is consistent with findings by other authors for other parts of the Arctic.
In summer for Hornsund station the most abundant clusters are
clus-5
ter 1 (<AOT>=0.049±0.005), cluster 4 (<AOT>=0.035±0.002), cluster 3 (<AOT>=0.039±0.002) and cluster 9 (<AOT>=0.040±0.003). There are a total of 62% of such cases. Except for cluster 1 all these clusters show low AOT values. Advection from the western sector (from S to N) is typical for these clusters. The so-called events (i.e. cases with high daily mean AOT) occur mainly in northern
10
and “terrestrial” clusters (clusters 5, 7 and 10), i.e. when air masses, especially at 2.5 km a.s.l. and 5 km a.s.l. cross over the Spitsbergen island and also for a marine cluster 1. The “terrestrial” clusters (10, 7, 5, 2) have the highest average AOT values (0.071±0.030, 0.065±0.015, 0.057±0.007, 0.085, respectively). Cases of advection from over the continents (8-day trajectories) can be observed in all clusters but in
15
many instances are responsible for only slight increase or no effect in the AOT values. Similarly, not always 8-day trajectories for days with higher AOT lead to over the continent.
During the ASTAR 2007 campaign low AOT values were recorded, ranging from 0.06 to 0.09, with exception to 9 April when AOT(500)=0.147. These values are lower than
20
the 4-year mean AOT(500) for spring (0.110±0.007; mean±standard deviation of the mean) in Hornsund. The back-trajectories belonged to the clusters of low (clusters 7 and 8) and average (clusters 2 and 4) cluster mean AOT values (compare Sect. 3.2). Beside the maximum AOT of 9 April 2007, the observed values of the AOT were close to the means for the clusters to which they belong or were lower than the means.
25
ACPD
9, 15423–15451, 2009Cluster analysis of an impact of air back-trajectories
A. Rozwadowska et al.
Title Page
Abstract Introduction
Conclusions References
Tables Figures
◭ ◮
◭ ◮
Back Close
Full Screen / Esc
Printer-friendly Version
Interactive Discussion ASTAR 2007 campaign. This research has been made partly within the framework of Polish
National Grant MACS/AERONET/59/2007.
References
Abdalmogith, S. S. and Harrison, R. M.: The use of trajectory cluster analysis to examine the long-range transport of secondary inorganic aerosol in the UK, Atmos. Environ., 39(35),
5
6686–6695, 2005.
Dorling, S. R., Davies, T. D., and Pierce, C. E.: Cluster analysis: a technique for estimating the synoptic meteorological controls on air and precipitation chemistry – method and appli-cations, Atmos. Environ., 26A(14), 2575–2581, 1992.
Draxler, R. R. and Rolph, G. D.: HYSPLIT (HYbrid Single-Particle Lagrangian Integrated
Trajec-10
tory) Model, access via NOAA ARL READY Website, http://www.arl.noaa.gov/ready/hysplit4. html, NOAA Air Resources Laboratory, Silver Spring, MD, 2003.
Eneroth, K., Kjellstrom, E., and Holmen, K.: A trajectory climatology for Svalbard; investigating how atmospheric flow patterns influence observed tracer concentrations, Phys. Chem. Earth, 28(28–32), 1191–1203, 2003.
15
Engvall, A.-C., Krejci, R., Str ¨om, J., Treffeisen, R., Scheele, R., Hermansen, O., and Paatero, J.: Changes in aerosol properties during spring-summer period in the Arctic troposphere, Atmos. Chem. Phys., 8, 445–462, 2008, http://www.atmos-chem-phys.net/8/445/2008/. Generoso, S., Bey, I., Atti ´e, J.-L., and Br ´eon F.-M.: A satellite- and model-based assessment
of the 2003 Russian fires: Impact on the Arctic region, J. Geophys. Res., 112, D15302,
20
doi:10.1029/2006JD008344, 2007.
Gogoi, M. M., Moorthy, K. K., Babu, S. S., and Bhuyan, P. K.: Climatology of columnar aerosol properties and the influence of synoptic conditions: First-time results from the northeastern region of India, J. Geophys. Res., 114, D08202, doi:10.1029/2008JD010765, 2009.
Heidam, N. Z., Christensen, J., Wahlin, P., and Skov, H.: Arctic atmospheric contaminants in
25
NE Greenland: levels, variations, origins, transport, transformations and trends 1990–2001, Sci. Total Environ., 331, 5–28, 2004.
ACPD
9, 15423–15451, 2009Cluster analysis of an impact of air back-trajectories
A. Rozwadowska et al.
Title Page
Abstract Introduction
Conclusions References
Tables Figures
◭ ◮
◭ ◮
Back Close
Full Screen / Esc
Printer-friendly Version
Interactive Discussion observations in the Arctic between 1991 and 1999, J. Geophys. Res., 107(D10), 4097,
doi:10.1029/2001JD000536, 2002.
Hillamo, R., Kerminen, V.-M., Aurela, M., M ¨akel ¨a, T., Maenhaut, W., and Leek C.: Modal struc-ture of chemical mass size distribution in the high Arctic aerosol, J. Geophys. Res., 106(D21), 27555–27571, 2001.
5
Katragkou, E., Kazadzis, S., Amiridis, V., Papaioannou, V., Karathanasis, S., and Melas, D.: PM10 regional transport pathways in Thessaloniki, Greece, Atmos. Environ., 43(5), 1079– 1085, 2009.
Khattatov, V. U., Tyabotov, A. E., Alekseyev, A. P., Postnov, A. A., and Stulov, E. A.: Aircraft lidar studies of the Arctic haze and their meteorological interpretation, Atmos. Res., 44(1–2),
10
99–111, 1997.
Law, K. S. and Stohl, A.: Arctic air pollution: Origins and impacts, Science, 315(5818), 1537– 1540, 2007.
Leck, C. and Bigg, E. K.: Biogenic particles in the surface microlayer and overlaying atmo-sphere in the central Arctic Ocean during summer, Tellus B, 57, 305–316, 2005.
15
Lin, C. J., Cheng, M. D., and Schroeder, W. H.: Transport patterns and potential sources of total gaseous mercury measured in Canadian high Arctic in 1995, Atmos. Environ., 35(6), 1141–1154, 2001.
Lund Myhre, C., Toledano, C., Myhre, G., Stebel, K., Yttri, K. E., Aaltonen, V., Johnsrud, M., Frioud, M., Cachorro, V., de Frutos, A., Lihavainen, H., Campbell, J. R., Chaikovsky, A.
20
P., Shiobara, M., Welton, E. J., and Tørseth, K.: Regional aerosol optical properties and radiative impact of the extreme smoke event in the European Arctic in spring 2006, Atmos. Chem. Phys., 7, 5899–5915, 2007, http://www.atmos-chem-phys.net/7/5899/2007/.
Mulcahy, J. P., O’Dowd, C. D., Jennings, S. G., and Ceburnis, D.: Significant enhancement of aerosol optical depth in marine air under high wind conditions, Geophys. Res. Lett., 35,
25
L16810, doi:10.1029/2008GL034303, 2008.
Nagel, D., Herber, A., Thomason, L. W., and Leiterer, U.: Vertical distribution of the spectral aerosol optical depth in the Arctic from 1993 to 1996, J. Geophys. Res., 103(D2), 1857–1870, 1998.
Owega, S., Khan, B. U. Z., Evans, G. J., Jervis, R. E., and Fila, M.: Identification of long-range
30
aerosol transport patterns to Toronto via classification of back trajectories by cluster analysis and neural network techniques, Chemometr. Intel. Lab., 83(1), 26–33, 2006.
ACPD
9, 15423–15451, 2009Cluster analysis of an impact of air back-trajectories
A. Rozwadowska et al.
Title Page
Abstract Introduction
Conclusions References
Tables Figures
◭ ◮
◭ ◮
Back Close
Full Screen / Esc
Printer-friendly Version
Interactive Discussion layer over the North Polar Waters of the Atlantic, J. Geophys. Res., 111, C06039,
doi:10.1029/2005JC003295, 2006.
Quinn, P. K., Miller, T. L., Bates, T. S., Ogren, J. A., Andrews, E., and Shaw, G. E.: A 3 year record of simultaneously measured aerosol chemical and optical properties at Barrow, Alaska, J. Geophys. Res., 107(D11), 4130, doi:10.1029/2001JD001248, 2002.
5
Quinn, P. K., Shaw, G., Andrews, E., Dutton, E. G., Ruoho-Airola, T., and Gong, S. L.: Arctic haze: current trends and knowledge gaps, Tellus, 59B, 99–114, 2007.
Rozwadowska, A., Petelski, T., and Zielinski, T.: Aerosol measurements in Hornsund during XXIX PAS polar expedition, Problemy Klimatologii Polarnej, 18, 161–170, 2008.
Stohl, A., Andrews, E., Burkhart, J. F., Forster, C., Herber, A., Hoch, S. W., Kowal, D., Lunder,
10
C., Mefford, T., Ogren, J. A., Sharma, S., Spichtinger, N., Stebel, K., Stone, R., Stroem, J., Tørseth, K., Wehrli, C., and Yttri, K. E.: Pan-Arctic enhancements of light absorbing aerosol concentrations due to North American boreal forest fires during summer 2004, J. Geophys. Res., 111, D22214, doi:10.1029/2006JD007216, 2006.
Stohl, A., Eckhardt, S., Forster, C., James, P., and Spichtinger, N.: On the pathways and
15
timescales of intercontinental air pollution transport, J. Geophys. Res., 107(D23), 4684, doi:10.1029/2001JD001396, 2002.
Stone, R. S., Anderson, G. P., Andrews, E., Dutton, E. G., Shettle, E. P., and Berk, A.: Incur-sions and radiative impact of Asian dust in northern Alaska, Geophys. Res. Lett., 34, L14815, doi:10.1029/2007GL029878, 2007.
20
Toledano, C., Cachorro, V. E., de Frutos, A. M., Torres, B., Berjon, A., Sorribas, M., and Stone, R. S.: Airmass Classification and Analysis of Aerosol Types at El Arenosillo (Spain), J. Appl. Meteorol. Clim., 48(5), 962–981, 2009.
Tomasi, C., Vitale, V., Lupi, A., Di Carmine, C., Campanelli, M., Herber, A., Treffeisen, R., Stone, R. S., Andrews, E., Sharma, S., Radionov, V., von Hoyningen-Huene, W., Stebel, K.,
25
Hansen, G. H., Myhre, C. L., Wehrli, C., Aaltonen, V., Lihavainen, H., Virkkula, A., Hillamo, R., Stroem, J., Toledano, C., Cachorro, V. E., Ortiz, P., de Frutos, A. M., Blindheim, S., Frioud, M., Gausa, M., Zielinski, T., Petelski, T., and Yamanouchi, T.: Aerosols in polar regions: A historical overview based on optical depth and in situ observations, J. Geophys. Res., 112, D16205, doi:10.1029/2007JD008432, 2007.
30
ACPD
9, 15423–15451, 2009Cluster analysis of an impact of air back-trajectories
A. Rozwadowska et al.
Title Page
Abstract Introduction
Conclusions References
Tables Figures
◭ ◮
◭ ◮
Back Close
Full Screen / Esc
Printer-friendly Version
Interactive Discussion Phys., 7, 3035–3053, 2007, http://www.atmos-chem-phys.net/7/3035/2007/.
Xia, X., Chen, H., and Zhang, W.: Analysis of the dependence of column-integrated aerosol properties on long-range transport of air masses in Beijing, Atmos. Environ., 41(36), 7739– 7750, 2007.
Yan, P., Tang, J., Huang, J., Mao, J. T., Zhou, X. J., Liu, Q., Wang, Z. F., and Zhou, H. G.: The
5
ACPD
9, 15423–15451, 2009Cluster analysis of an impact of air back-trajectories
A. Rozwadowska et al.
Title Page
Abstract Introduction
Conclusions References
Tables Figures
◭ ◮
◭ ◮
Back Close
Full Screen / Esc
Printer-friendly Version
Interactive Discussion Table 1. Daily mean aerosol properties, meteorological conditions and 5-day back-trajectory
clusters during ASTAR 2007 campaign. tbeg andtend are the respective times of the beginning and the end of aerosol measurements. N is number of observations during a given day. AOT andαare respective daily means of AOT(500) andα(440,870). SDAOTand SDαare standard
deviations of AOT andα. RH, v and dir are values of relative humidity, wind speed and wind direction averaged over the time of aerosol measurements. Cluster number (CN) concerns cluster classification for spring, given in Sect. 3.2.
Date dd.mm.yyyy
Tbeg
UTC [h]
Tend
UTC [h] Julian day
N AOT SDAOT α SDα RH [%] v[m/s] dir
[deg] CN
ACPD
9, 15423–15451, 2009Cluster analysis of an impact of air back-trajectories
A. Rozwadowska et al.
Title Page
Abstract Introduction
Conclusions References
Tables Figures
◭ ◮
◭ ◮
Back Close
Full Screen / Esc
Printer-friendly Version
Interactive Discussion
100
150
200
250
Julian day
0.0
0.1
0.2
0.3
0.4
0.5
AOT(500)
2005
2006
2007
2008
ACPD
9, 15423–15451, 2009Cluster analysis of an impact of air back-trajectories
A. Rozwadowska et al.
Title Page
Abstract Introduction
Conclusions References
Tables Figures
◭ ◮
◭ ◮
Back Close
Full Screen / Esc
Printer-friendly Version
Interactive Discussion Fig. 2. Comparison of the impact of trajectory length on relative variance of AOT defined by
ACPD
9, 15423–15451, 2009Cluster analysis of an impact of air back-trajectories
A. Rozwadowska et al.
Title Page
Abstract Introduction
Conclusions References
Tables Figures
◭ ◮
◭ ◮
Back Close
Full Screen / Esc
Printer-friendly Version
Interactive Discussion (a)
(b)
ACPD
9, 15423–15451, 2009Cluster analysis of an impact of air back-trajectories
A. Rozwadowska et al.
Title Page
Abstract Introduction
Conclusions References
Tables Figures
◭ ◮
◭ ◮
Back Close
Full Screen / Esc
Printer-friendly Version
Interactive Discussion (a)
(b)
ACPD
9, 15423–15451, 2009Cluster analysis of an impact of air back-trajectories
A. Rozwadowska et al.
Title Page
Abstract Introduction
Conclusions References
Tables Figures
◭ ◮
◭ ◮
Back Close
Full Screen / Esc
Printer-friendly Version
Interactive Discussion 0.00 0.05 0.10 0.15 0.20 0.25
AOT(500) 0.8
1.0 1.2 1.4 1.6 1.8 2.0
Angstroem exponent
1( 7)
2( 9) 3(10) 4(20)
5( 2)
6( 1)
7( 6) 8( 6) 9( 4) 10( 1)
(a)
0.00 0.02 0.04 0.06 0.08 0.10 AOT(500)
0.8 1.0 1.2 1.4 1.6 1.8 2.0
Angstroem exponent
1(14)
2( 1) 3( 7) 4( 9)
5( 5)
6( 2)
7( 6) 8( 5) 9( 7) 10( 4)
(b)
ACPD
9, 15423–15451, 2009Cluster analysis of an impact of air back-trajectories
A. Rozwadowska et al.
Title Page Abstract Introduction Conclusions References Tables Figures ◭ ◮ ◭ ◮ Back Close
Full Screen / Esc
Printer-friendly Version Interactive Discussion -180 -160 -140 -120 -100 -80 -60 -40 -20
0 20 40 60 80 100 120 140 160 180 40 60 80 1(7) 2(9) 3(10) 4(20) 5(2) 6(1) 7(6) 8(6) 9(4) 10(1) (a) -180 -160 -140 -120 -100 -80 -60 -40 -20
0 20 40 60 80 100 120 140 160 180 70 90 1(14) 2(1) 3(7) 4(9) 5(5) 6(2) 7(6) 8(5) 9(7) 10(4) 1(14) 2(1) 3(7) 4(9) 5(5) 6(2) 7(6) 8(5) 9(7) 10(4) (b)