Marta Alexandra Cardoso Duque
(Licenciatura Pré-Bolonha)
Reconstitution of the failure of the Fonte Santa mine tailings dam.
Modelling of the dam breaching process.
Dissertação apresentada na Faculdade de Ciências e Tecnologia da
Universidade Nova de Lisboa para obtenção do grau de Mestre em
Engenharia Civil Perfil de Estruturas e Geotecnia.
Orientador: Professor Mário Jorge Rodrigues Pereira da Franca Co-orientador: Professor Rui Miguel Lage Ferreira (Instituto Superior Técnico)
Presidente: Professora Maria Teresa Grilo Santana Vogais:
Professor João Gouveia Aparício Bento Leal Professor Mário Jorge Rodrigues Pereira da Franca
Professor Rui Miguel Lage Ferreira
Julho
2011
Marta Alexandra Cardoso Duque
(Licenciatura Pré-Bolonha)
Reconstitution of the failure of the Fonte Santa mine tailings dam.
Modelling of the dam breaching process.
“Copyright” Marta Alexandra Cardoso Duque, FCT/UNL e UNL
A Faculdade de Ciências e Tecnologia e a Universidade Nova de Lisboa têm o direito, perpétuo e sem limites geográficos, de arquivar e publicar esta dissertação através de exemplares impressos reproduzidos em papel ou de forma digital, ou por qualquer outro meio conhecido ou que venha a ser inventado, e de a divulgar através de repositórios científicos e de admitir a sua cópia e distribuição com objectivos educacionais ou de investigação, não comerciais, desde que seja dado crédito ao autor e editor.
ACKNOWLEDGEMENTS
Along these months that I have worked in this thesis and in the preparation of this document, I had the opportunity to be supported by several people who directly or indirectly contributed to the achievement of this dissertation.
First, and the most necessary thanks go to Professor Mário Franca, in more difficult situations he gave me “a push up”, helping me to move on with the thesis. His knowledge, guidance and endless patience for my “snail speed” were essential to finalizing this work. Despite the lack of time, he could always find a bit to clarify my doubts.
To Professor Rui Ferreira, I am grateful for his support and struggle trying to follow my work and for pushing me to higher goals. I would also to mention that it was only thanks to Professor João Leal that this thesis was embedded in Perfil de Estruturas e Geotecnia.
My gratitude also goes to all those who with their knowledge, collaboration and support took time to discuss with me all things related to thesis. Especially to INAG that gave me some days to spend with this thesis.
For his patience with my bad mood in some situations and for the way he motivated me to this work, a special thanks to Tiago.
Finally many thanks to my parents and to all my other relatives especially to my grandfathers. To my friends, I am grateful for their constant support.
I
RESUMO
A 27 de Novembro de 2006 ocorreu a ruptura da barragem de rejeitados das minas de Fonte Santa, provavelmente devida a uma combinação de riscos nomeadamente, precipitação extrema ocorrida nos dias anteriores e eventual obstrução do descarregador de cheias. Uma primeira visita ao local, pouco após o acidente, mostrou que a barragem praticamente desapareceu por completo e que uma parcela de lamas depositadas na albufeira havia sido igualmente transportada para jusante. Numa outra visita de campo, no início de 2007, foi efectuado um levantamento dos danos ocorridos no vale a jusante com registo das alturas máximas do escoamento e caracterização das zonas de erosão e de deposição de material sólido.
Nesta dissertação apresenta-se a reconstituição do acidente da ruptura da barragem de rejeitados das minas de Fonte Santa, incluindo uma descrição da brecha, do processo de ruptura e das consequências no vale a jusante, nomeadamente em termos de alturas máximas de escoamento e alterações morfológicas mais marcantes. A brecha resultante do galgamento do corpo da barragem foi simulada com recurso a um modelo numérico, sendo os dados da ruptura utilizados no processo de calibração e validação deste.
II
ABSTRACT
Fonte Santa mine tailings dam failed on 27th November 2006 probably due to a combination of hazards, an extraordinary rainfall on the previous days and the eventual clogging of the spillway. A first field visit shortly after the failure showed that the dam was completely washed away together with a fraction of the mud retained in the reservoir. In another field visit, in the beginning of 2007, assessment of damages, maximum water levels and erosion and deposition areas in the downstream valley was performed.
In this dissertation the accident of the failure of the Fonte Santa mine tailings dam is reconstructed in detail, including breach characteristics, rupture process and consequences in the downstream valley namely in what concerns maximum water levels and most notorious morphological changes. The breaching process resulting from extreme flood on the day of the event was simulated with a numerical model duly evaluated and calibrated through comparison with the real data.
III
TABLE OF CONTENTS
1. INTRODUCTION ... 1
1.1. GENERAL CONSIDERATIONS ... 1
1.2. FRAMEWORK ... 2
1.2.1. Dams and failures ... 2
1.2.2. Tailings dams ... 4
1.2.3. Portuguese dam safety regulation ... 7
1.3. STATE OF ART ... 8
1.4. OBJECTIVES ... 9
1.5. METHODOLOGY ... 9
1.6. STRUCTURE OF THE DISSERTATION ... 10
2. DESCRIPTION OF THE DAM BREAK ... 11
2.1. CHARACTERIZATION OF FONTE SANTA DAM ... 11
2.1.1. Location and construction methods ... 11
2.1.2. Dam body ... 13
2.1.3. Characterization of the river catchment and the reservoir ... 15
2.2. HYDROLOGY OF THE EVENT ... 16
2.2.1. Extreme flood on the day of the event ... 16
2.2.2. Inflow Hydrograph ... 17
2.2.3. Outflow hydrograph and reservoir routing ... 18
2.3. DAM BREACHING ... 19
2.3.1. Dam breach causes ... 19
2.3.2. Breach geometry ... 19
2.3.3. Estimated water and mud releases ... 20
2.3.4. Estimation of dam breach characteristics based on empirical formulations ... 22
2.4. DISCUSSION ... 24
3. ANALYSIS OF THE DOWNSTREAM VALLEY ... 25
3.1. VALLEY MORPHOLOGY PRIOR TO THE DAM BREAK ... 25
3.2. VALLEY MORPHOLOGY AFTER THE DAM BREAK ... 25
3.3. DISCUSSION ... 33
4. MATHEMATICAL MODELLING OF THE BREACHING ... 35
4.1. DESCRIPTION OF THE NUMERICAL MODEL ... 35
4.2. MODEL PARAMETERIZATION ... 38
4.3. RESULTS ... 39
4.4. DISCUSSION ... 41
5. CONCLUDING REMARKS ... 43
5.1. CONCLUDING REMARKS ... 43
5.2. PROPOSALS FOR FUTURE DEVELOPMENTS... 43
REFERENCES ... 45
IV
LIST OF TABLES
Table 1. Loss of lives resulting from accidents with dams (SINGH,1996 and SANTOS,1995). ... 2
Table 2. Comparison of embankment types (USEPA, 1994) ... 6
Table 3. Main characteristics of dam and spillway. Comparison of the present values with the ones presented in FRANCA et al. (2007). ... 14
Table 4. Water and mud volumes for water elevations of 504.4 m asl and 505.0 m asl. ... 15
Table 5. Dam breach geometric parameters. ... 19
Table 6. Estimated water and wedge mud releases during the breaching process. ... 22
Table 7. Function of reservoir storage. ... 22
Table 8. Breach formation time. ... 23
Table 9. Peak breach outflow solutions. ... 24
Table 10. Distance between the dam section and the last section surveyed where significant impact in river morphology was observed. ... 26
Table 11. Total erosion and deposition volumes of body and mud wedge from the reservoir. .... 32
Table 12. Total erosion and deposition volumes throughout the downstream valley. ... 32
V
LIST OF FIGURES
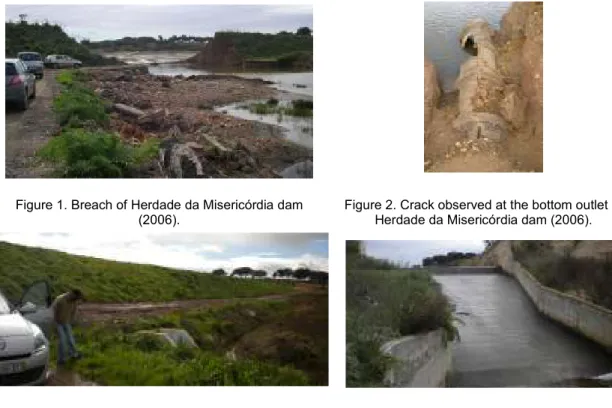
Figure 1. Breach of Herdade da Misericórdia dam (2006). ... 4
Figure 2. Crack observed at the bottom outlet of Herdade da Misericórdia dam (2006). ... 4
Figure 3. Herdade da Misericórdia dam after rehabilitation (2011). ... 4
Figure 4. Spillway of Herdade da Misericórdia dam of the rehabilitation (2011). ... 4
Figure 5. Schematic cross-section of a tailings dam (VICK, 1990). ... 5
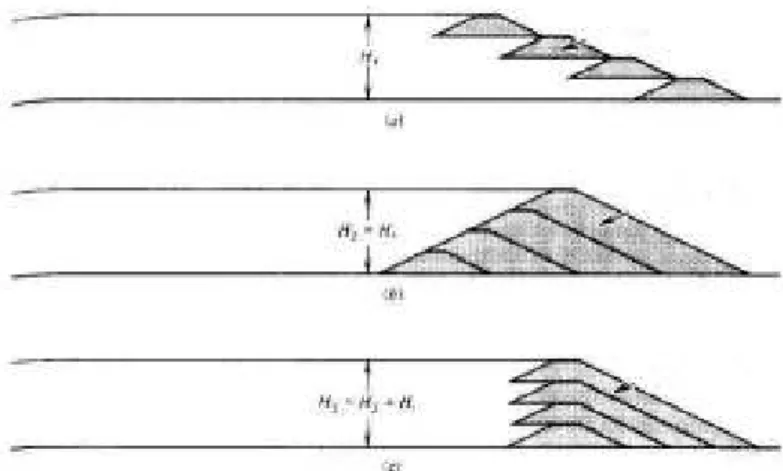
Figure 6. Embankment types of tailings dams according to the construction process: (a) Upstream method, (b) Centered method, (c) Downstream method (VICK, 1990). ... 6
Figure 7. Location of Fonte Santa tailings dam on a map showing the main dams belonging to Douro river basin. ... 11
Figure 8. View from downstream of the dam. A scar in the reservoir bottom is visible. ... 12
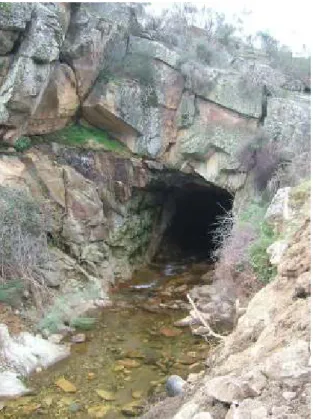
Figure 9. Upstream section of the spillway. ... 13
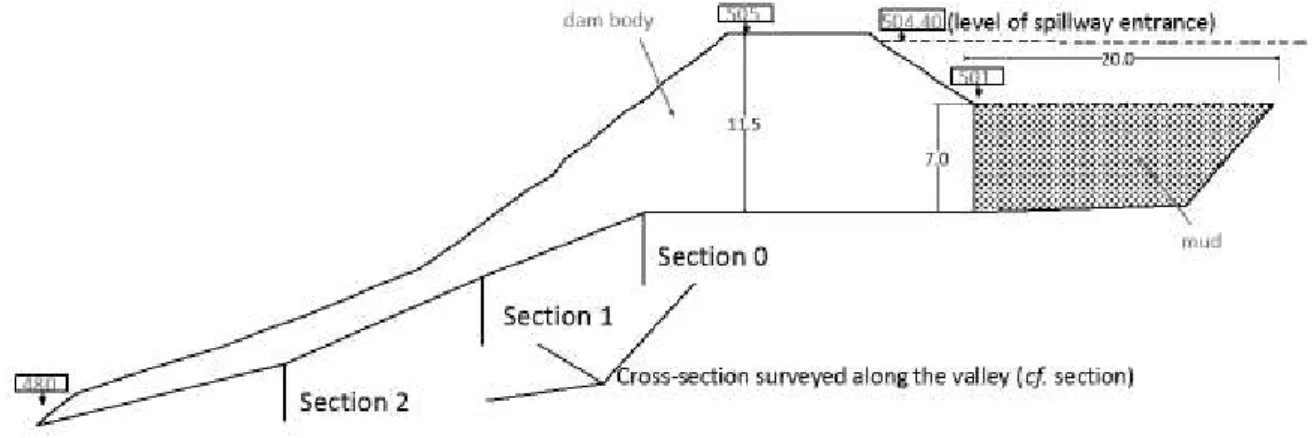
Figure 10. Central cross-section of dam body and the retained mud (with no specific scale). ... 14
Figure 11. Dam catchment represented on the military map (No 120) herein represented (with no specific scale)... 15
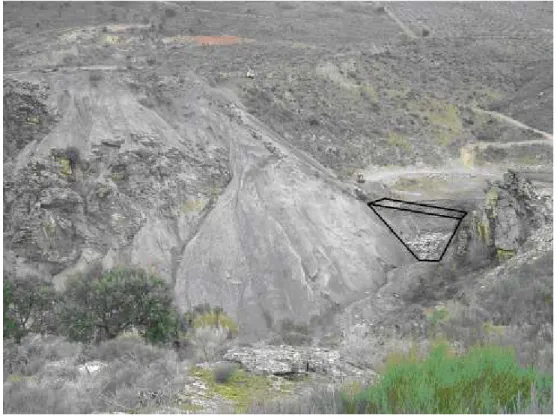
Figure 12. The remains of the dam slope and the wedge mud (at elevation 501 m asl). Dry bushes due to submersion in the winter season indicated with the black line... 16
Figure 13. Low-pressure system formed in Atlantic North on the days: a) 20th of November; b) 24th November 2006. (in: FRANCA et al. (2007)) ... 17
Figure 14. Inflow hydrograph. ... 18
Figure 15. Dam breach, view from downstream. The rock formation from the riverbed is visible. 20 Figure 16. Breach dam geometric (no specific scale). ... 20
Figure 17. Reservoir capacity, with sludge. ... 21
Figure 18. Dam breach, view from upstream. The wedge of mud is visible. ... 21
Figure 19. Cross-section 6, example of the detailed survey (cf. Annex IV). ... 27
Figure 20. Lateral extension of the morphological impacts of the flood wave. ... 28
Figure 21. View from the bridge to downstream ... 28
Figure 22. View from the bridge from upstream (Section 29). ... 28
Figure 23. Maximum flood levels observed in field. ... 29
Figure 24. Valley profile with the maximum flood levels observed in field. ... 30
Figure 25. Estimated erosion and deposition volumes of the river bed and banks throughout the downstream valley (body dam and wedge mud are not included). ... 31
Figure 26. Section with high erosion. ... 31
Figure 27. Section with high deposition. ... 31
V
Figure 29. Sketch of the stratified flow idealized in the numerical model. The more relevant flow regions described earlier are indicated. ... 35 Figure 30. Definition of discretized areas. ... 35 Figure 31. Discretization of the dam: 3D grid. Initial time. ... 38 Figure 32. Comparation of the reservoir level (Nres) with the breach level (Zbreach) (Λ = 30000). ... 39 Figure 33. Breach level for different attenuation factors. ... 40 Figure 34. Outflow for different attenuation factors. ... 40
VI
SYMBOLS
A channel section area m2
Ab the remaining of the dam area m2
Ac area of the transport layer m2
Acrit critical flow area m2
Al area of deposition of slopes lateral instability m2
Bv valley average width m
Bcrit channel critical width m
Cb function of reservoir storage m
Cc concentration on the transport layer [-]
D deposition volume m3
E (bed+banks) volume of the erosion in bed and in the banks m3
g gravity acceleration m/s2
h elevation in relation to the bottom of channel m
hw depth of water m
I inflow from the reservoir m3/s
pb bed porosity [-]
Q outflow from the reservoir m3/s
Qb breach outflow m3/s
Ql liquid flow m3/s
Qp peak breach outflow m3/s
Qs solid discharge m3/s
Qs* solid discharge in equilibrium m3/s
Sf energy slope
t time s
tf breach formation time hours
VI
V volume of water on the reservoir m3
Ve volume of the dam and mud released m3
Vs balance between volume of the erosion in bed + banks and dam + mud released and the deposition
m3
Vz volume at elevation (z) m3
Vw initial water volume above the final breach bottom position m3 Zb geometry elevation to a reference plan m
VII
ACRONYMS
AMC Average Humidity of the soil ANPC Civil Protection Authority
CADAM European Union Concerted Action on Dam Break Modelling
EDM Mining Development Company
GPS Global Positioning System HEC-HMS Hydrologic Modeling System
ICOLD International Commission on Large Dam
INAG Institute of Water
LNEC National Laboratory of Civil Engineering IEP Internal Emergency Action Plan
RANS Reynolds-Average Navier-Stokes RoDaB Rockfill Dam Breaching
RSB Portuguese Dam Safety Regulation STAV-breach Strong Transients in Alluvial Valleys
1
1. INTRODUCTION
1.1. GENERAL CONSIDERATIONS
Natural disasters may constitute catastrophic events especially when they cause structural and personal damage to society. Dams induce an additional risk on river valleys due to the massif destructive potential of the volume of water storage on the reservoir flows thus in case of an accident with serious consequences the reduction of the impacts is necessary. Despite all the devices and security measures implemented nowadays, in practical terms it is impossible to eliminate all risks (ALMEIDA, 2011).
Not all accidents with dams occur after natural extraordinary events. Until 1972 it was referenced that 50% of accidents with dams were due to human error at different stages of their life period (ICOLD, 1972). Failure mechanisms of dams can be a combination of effects associated with actions of nature, the type of the dam and the construction methods. Major causes of failures identified by COSTA (1985) [apud WAHL (1998)] are overtopping due to inadequate spillway capacity (34%), foundation problems (30%) and pipping and seepage (28%). Reduced reliability of dams is due to various causes, namely those related to developer, type of financing, project, construction and conservation during exploration.
In 1990 the first Portuguese regulation was created, which imposed dam break studies and elaboration flooding maps to all new and existing structures, which included the flooding maps (FRANCA et al., 2011). Today these flooding maps are being used by planners on the implementation of dam´s IEP (Internal Emergency action Plans). The IEP it’s a requirement of the new regulation, RSB, published on October 2007 substituting the previous regulation dated from 1990.
Property damage is certain when a dam breaks whereas loss of human lives is related with the extent and travelling time of the flood wave, with the number of the population in the near area and with the existence or not of a warning system.
The consequences of dam break accidents include these amongst the most feared flood hazards. Within the dam safety context, tailings dams from abandoned mines present added risk given the lack of surveying and maintenance (FRANCA et al., 2007) and increase the probability of environmental risks in the downstream valley.
2
1.2. FRAMEWORK
1.2.1. Dams and failures
A set of dam breaks have forced to reflect on the downstream valleys risks and in the prevention of potential effects (ALMEIDA, 2001). Examples of the most important dam breaks in Europe include:
• Malpasset dam, concrete, in France, broke in 1959 and caused 421 deaths;
• Vega de Tera dam, concrete, in Spain, partially broke in 1959 and caused 144 deaths;
• Vajont dam, concrete, in Italy, was overtopped and caused a landslide of about 240 x 106 m3 of rock, resulting in 2600 deaths.
SERAFIM (1989) presents statistical data on accidents with 142 dams, indicating: characteristics of the dam and reservoir; the year of construction and of the accident; the life stage of the dam when the accident occurred and the type of breakdown.
LEMPÉRIÈRE (1993) states that accidents with dams caused the loss of about 10000 people in 130 years (excluding China), 90 percent of these resulted only in 10 dam breaks. Table 1 summarizes some of the major accidents with dams and their consequences.
Table 1. Loss of lives resulting from accidents with dams (SINGH,1996 and SANTOS,1995).
Country Name Date of
aciddent
Dam height
(m) Loss of live
Spain Puentes 1802 50 600
U.S.A. Lynde Brook 1876 - -
United Kingdom Dale Dyke 1884 - 250
Japan Iruka 1888 - 1200
U.S.A. South Fork 1889 21.9 2200
France Bouzey 1895 15 86-100
U.S.A. Austin 1911 14 80-700
Italy Gleno 1923 22 100-600
United Kingdom Eigian 1925 10.5 16
U.S.A. Saint Francis 1928 55 450
U.S.A. Brokaw 2 1938 - -
Spain Vega de Terra 1959 34 144
France Malpasset 1959 66.5 421
3
Table 1. Loss of lives resulting from accidents with dams (SINGH,1996 and SANTOS,1995).
Country Name Date of
aciddent Dam height (m) Loss of live Korea Hyokiri 1961 - 250 Italy Vajont 1963 265 2600-3000 Colombia Quebrada la Chapa 1963 - 3
U.S.A. Baldwin Hills 1963 - 3
U.S.A. Mayfield 1965 - -
U.S.A. Wyoming 1969 - -
U.S.A. Buffalo Creek 1972 - 125
Colombia Del Monte 1976 - 80
U.S.A. Teton 1976 120 6-11
A well documented and analyzed case-study was the drainage of the Lake Ha! Ha! consequence of the overtopping and erosion of the cut-away dyke (located across the head of separate bays just to the south of the dam), which occurred over a period of many hours. The overtopping of the dyke was caused by insufficient available capacity of the spillway at the time of extraordinary rainstorm and because the elevation of the dyke crest was below that of the concrete dam controlling the reservoir level. The flood produced morphologic changes downstream of the reservoir along the Ha!Ha! (BROOK et al.,1998).
As it appears, in Portugal most of the accidents occurred in earth dams with small dimensions (FARIA, 2001). In the same year of the failure of Fonte Santa dam (2006), another accident occurred in Portugal, the failure of Herdade da Misericórdia dam in Aljustrel (Alentejo). This was an earth dam and it was assumed that the dam was overtopped due to an extraordinary rainfall event and insufficient capacity of the spillway discharge. Nonetheless main reasons to the break were piping induced by a longitudinal crack on the bottom outlet (cf. Figure 1 and Figure 2), thus introducing water within the embankment. This dam had a reservoir with a capacity about 761500 m3 which, together with half of the embankment, were washed away downstream. There were no human lives affected, only the lost some arable land without economical relevance was referenced as consequence. Recently the embankment and the spillway have been subjected to improvements (Figure 3 and Figure 4).
4
Dam ruptures are usually classified in terms of its consequences (ALMEIDA, 2001 and SINGH, 1996). A dam failure may be gradual or almost instantaneous (SINGH, 1996), typically embankment dams have a gradual break whereas in concrete dams the rupture is practically instantaneous. When the rupture is gradual a shock wave may not occur, and the breaching process may be gradual and slow. In a quasi instantaneous rupture, a shock wave is formed propagating downstream valley, with height and water speed much higher than the flow above the bedrock layer (FRANCA, 2002).The failure mechanism type is a determinant key for applying a simulation model of the breach.
1.2.2. Tailings dams
In the mining process the metal content is removed from the extracted minerals and the remains constitute a waste product - the tailings. Usually tailings are pumped through a mud form into a sedimentation basin, which can be a natural depression or a man-made dam. These dams are frequently built on an informal fashion with the continuous deposition of tailings.
Historically, tailings were disposed in the most convenient and cost-effective places, often in flowing water valleys. The use of cyanide and other toxic reagents in mill processing has raised special concerns for some tailings and is leading to a prior treatment as well as increased attention to their containment, resulting in a growing research and emerging concepts of
long-Figure 1. Breach of Herdade da Misericórdia dam (2006).
Figure 2. Crack observed at the bottom outlet of Herdade da Misericórdia dam (2006).
Figure 3. Herdade da Misericórdia dam after rehabilitation (2011).
Figure 4. Spillway of Herdade da Misericórdia dam of the rehabilitation (2011).
5 term control or mitigation (USEPA, 1994). Tailings impoundments are designed to perform a number of functions, including treatment functions (USEPA, 1994):
• Removal of suspended solids by sedimentation. • Precipitation of heavy metals as hydroxides. • Permanent containment of tailings.
• Stabilization of oxidizable constituents (e.g. cyanides). • Storage and stabilization of process of water recycling. • Retention of flow from storm flows.
Tailings retention dams are similar to water retention dams in what regards soil properties, surface water and ground water controls and stability considerations. Tailings dam are suitable for any type of tailings and deposition methods (USEPA, 1994). A schematic cross-section of a typical tailings dam is given in Figure 5:
Figure 5. Schematic cross-section of a tailings dam (VICK, 1990).
Associated with the above presented solution, also called the traditional solution, three different profiles can be drawed, according to the heightening and construction process (SERRA (2001) [apud USEPA (1994)] ) (Figure 6):
• Upstream method profile (Figure 6 a) • Centered method profile (Figure 6 b) • Downstream method profile (Figure 6 c)
6
Figure 6. Embankment types of tailings dams according to the construction process: (a) Upstream method, (b) Centered method, (c) Downstream method (VICK, 1990).
Table 2 shows a comparison between the different embankments types above mentioned:
Table 2. Comparison of embankment types (USEPA, 1994)
Traditional Upstream method Downstream
method Centered method T a il in g s c h a ra c te ri s ti c s Suitable for any type of tailings.
At least 60% sand in whole tailings.
Low pulp density for grain-size segregation.
Suitable for any type of tailings. Sands. D is c h a rg e re q u ir e m e n ts Any discharge procedure is suitable.
Peripheral discharge, well-controlled beach necessary.
Varies according to design detail. Peripheral discharge of at least nominal beach. necessary. W a te r-S to ra g e s u it a b il it
y Good. Not suitable for significant
water storage. Good. Not recommended for permanent storage. S e is m ic re s is ta n c
7
Table 2. Comparison of embankment types (USEPA, 1994)
Traditional Upstream method Downstream
method Centered method E m b a n k m e n t fi ll re q u ir e m e n ts Natural soil borrow.
Native soil, sand tailings, waste rock. Sand tailings, waste rock, native soils. Sand tailings, waste rock, native soil. R e la ti v e e m b a n k m e n t c o s t
High. Low. High. Moderate.
U s e o f L o w p e rm e a b il it y c o re s
Possible. Not possible. Possible (inclined cone).
Possible (central cone).
1.2.3. Portuguese dam safety regulation
The present portuguese dam safety regulation (RSB, DL n.º344/07) was published on October 2007 substituting the previous regulation dated from 1990. The new regulation applies to large dams (height ≥ 15 m) and also to dams with reservoir capacity larger than 100000 m3, being it’s application mandatory to existent dams as well as other dams depending on the downstream hazard classification. Portuguese dams which are under the scope of RSB have to be classified and the final opinion is given by the Institute of water (INAG), approving or disapproving that proposal (PINHEIRO et al., 2010).
According to RSB dams are classified according to their hazards into three degrees, depending on to the number of persons and on the economic and environmental values affected by the flood wave due to a dam failure. Dwellers may be permanent residents or temporary occupants of the valley. Temporary dwellers are people occupying facilities only during limited periods of time (e.g. recreational activities in fluvial beaches during summer time); these are accounted as a third since an occupation equivalent to 8 h/day is considered.
Class 1 dams correspond to the highest potential hazard and this is attributed to dams that, in case of failure, will affect 25 or more resident. These dams must be monitored by LNEC (National Laboratory of Civil Engineering) and they should have a IEP (Internal Emergency action Plan). Class 2 corresponds to a significant hazard associated to the dams which affect at least one
8
resident. Third class dams have low hazard, being this classification attributed to dams whose failure will not affect any human life (PINHEIRO et al., 2010). The IEP, as referred before is a requirement of the new regulation and it is demanded to dam owners to be implemented under the supervision of Dam Authority (INAG). It is related to the reservoir and downstream valley safety in the area of self-rescue (ZAS). It should include studies of accidents, flood wave, identification and implementation of the ZAS and the implementation of warning systems (ANPC & INAG, 2009). Within the boundaries of the flooding map but outside of ZAS, it is ANPC (National Civil Protection Authority) responsibility, warn and evacuate the population by the activation of EEP (External Emergency Plan) (ANPC & INAG, 2009).
1.3. STATE OF ART
Nowadays innumerous tools are available to model dam breaks including their outflow hydrographs and the propagation of the consequent flood wave traveling downstream. Dam break analysis is thus subdivided into two distinct problems:
• Prediction of outflow hydrograph; • Modelling the consequent flood wave.
The first one is assessed in this work. Modelling the outflow hydrograph includes: routing the reservoir depletion; simulating the breach formation process where breach characteristics are important (e.g., shape, depth, width, breach formation time, material erodability) and computing the outflow through hydraulics principles (WAHL, 1998).
RECLAMATION (1988) [apud WAHL (1998)] as defined four approaches to predict breach parameters: physically based methods, parametric models, predictor equations, comparative analysis. Many data or case studies for breaching process exists and different investigators had proposed numerous relations for estimating breach parameters or peak discharges. SINGH (1996), CADAM (2000) and ALMEIDA (2001) are some examples where modelling dam breach technology is approached and vastly described. In laboratory, many researchers studied dam failures by overtopping, (e.g. TINGSANCHALI and CHINNARASRI (2001)), all concerning homogeneous non-cohesive earth dams. These research efforts provided mainly outflow hydrographs, very useful data for model validation, but these theories failed to produce detailed phenomenological information: description of the geotechnical failures phases during the breaching process; interaction between hydrodynamic erosion and geotechnical failure and the influence of the saturation degree on shear strength of fill materials. Deterministic models (SINGH, 1996) covers only breaching process in homogeneous earth dams and e.g. TINGSANCHALIandCHINNARASRI (2001) among others, began to admit the main problem in these models is their inability to consider the hydrodynamic and geotechnical phenomena and for that it was necessary to create a link between these two principles.
9 FRANCA and ALMEIDA (2002) performed the first laboratorial study on outflows hydrographs in case of rockfill dams with upstream impervious layer.
Examples of dam breaching models include, the National Weather Service BREACH (FREAD, 1988) and RoDaB (Rockfill Dam breaching) lumped model. RoDaB model (FRANCA and ALMEIDA, 2004) aims at providing a consistent continuous hydrograph appropriated for downstream flood simulation. The methodology used in this latter is based on the governing equations of reservoir routing and depletion, breach erosion (Exner modified equations). FERREIRAet al. (2009) used the dense limit Chapman-Enskog´s kinetic theory developed non-newtonian conceptual models for geomorphic dam-break flows. The model developed by FERREIRA et al. (2009) is applicable to the morphologic evolution of rivers subjected to the transport of poorly sorted sediment mixtures at low shear stress and to geomorphic flows featuring intense sediment transport at high shear stresses. These model present numerical solutions to idealized situations of variable flow with nonequilibrium transport. The main equations of this model applied on the simulation of earth dam breaching process is explained in chapter 4, where it is applied to predict the evolution of the failure of Fonte Santa tailings dam.
1.4. OBJECTIVES
This thesis aims at analyzing the causes associated to the rupture of Fonte Santa tailings dam, the breaching process and the consequences of the passage of the flood wave through the downstream valley. Therefore, all the elements raised in field surveys made in 2007 shortly after the accident are herein organized and thus an analysis of the downstream valley prior and after the dam break is made; some of the data collected is used to calibrate a numerical model of the breaching process that provides a prediction of the dam break evolution. Finally modelling results are compared with empirical formulas.
1.5. METHODOLOGY
This work contains the reconstruction of the dam failure and an application of a computational model of the rupture process. The first results are based on data from field visits made in early 2007, shortly after the accident, namely a topographic survey made during the visits and topographic maps. The authors of the field visits (FRANCA et al., 2007) and the dam owner (EDM) provided essential data for this study, namely:
• Photos.
• Topographic map 1:1000, which contained the dam before the break. • Hydrological data (inflow hydrograph data).
10
• Qualitative description of valley characteristics (estimate of erosion and deposition quantities and identification of hydrodynamics features).
The first part of the accident reconstruction includes the dam characterization before and after the break. Topographic maps at 1:25000 and 1:1000 scales were used. Topographic maps at scale 1:25000 allowed to profiling the creek Ribeiro da Ponte (where the Fonte Santa dam is located) and comparing the sections raised in 2007 where adequate topographic GPS were used.
Through the survey of 2007 the amount of the eroded and deposited material in the downstream valley was quantified and compared with the volume of landfill and wedge of sludge that were washed with the rupture.
The topographic map 1:1000 was used to characterize the dam body and reservoir, namely evaluate their volumes including the storage water and mud. The new results herein presented are compared with those presented preliminarily in FRANCA et al. (2007).
Field information of the accident is used as an input to a computational model. The model of the breaching process simulates dynamically the failure progress due to overtopping of the structure as a function of the dam characteristics. The model is calibrated taking into account the observed final breach geometry. A detailed description of the numerical model used in this dissertation can be found in FERREIRA et al. (2009) and FERREIRA et al. (2010).
1.6. STRUCTURE OF THE DISSERTATION
The dissertation is organized into five chapters, including this introduction. Chapter 2 presents a description of the events connected with the breaking, i.e. hydrological events and the characterization of the dam and reservoir before and after the accident. The analysis of the downstream valley before and after the breaking including the morphological consequences and inundation area are presented in chapter 3. In order to assess the consequences in the downstream valley this was discretized in sections. The estimates of erosion and deposition were assessed as well as the maximum flood levels. Chapter 4 contains the mathematical simulation and calibration of the breaching process. The main conclusions are drawn and proposals for future studies are presented in chapter 5 and a list of references is presented subsequently. Finally the annexes are displayed as follows:
• Annex I – Location of dam transept, reservoir transept and valley cross-section after the dam
• Annex II – Reservoir transepts • Annex III – Dam transepts • Annex IV – Cross-sections • Annex V – Inundation map • Annex VI – Topographic map
11
2. DESCRIPTION OF THE DAM BREAK
2.1. CHARACTERIZATION OF FONTE SANTA DAM
2.1.1. Location and construction methods
Fonte Santa dam is situated on the municipality of Freixo de Espada à Cinta (Bragança), in the Northeast of Portugal, north of the Douro river (Figure 7).
Figure 7. Location of Fonte Santa tailings dam on a map showing the main dams belonging to Douro river basin.
The Fonte Santa tailings dam, belonging to a mining complex abandoned for more than 30 years, was used mainly to retain the mud resulting from the washing process of extracted minerals. The minerals that came from the miner activity were scheelite and some wolframite. Fine gravel (tout-venant) and tailings were the material used to construct the dam on an informal fashion. The
12
Fonte Santa dam had an irregular shape, with a large amount of the fine gravel spreading downstream along the valley banks (FRANCA et al., 2007).
The crest was not object of a special design and it didn’t have a constant level; the construction was made progressively with coarse and fine material resulting from the mining works which were deposited randomly.
The construction was a dynamic process; the tout-venant was placed progressively as well as the mud. The initial sludges were placed after the landfill construction. As referred in FRANCA et al. (2007), the mud deposited in the reservoir, with D50 of 0.0186 mm, contributed to keep the dam body impermeable along the years, as this material leaned against the body of the dam, practically embedded with the upstream slope. The photos taken in 2007 are fairly illustrative of this detail (see Figure 8 and later in the text Figure 12).
Figure 8. View from downstream of the dam. A scar in the reservoir bottom is visible.
The dam is located in a section of the valley where a rock formation exists (Figure 8). There is no knowledge of a dam project; apparently the dam material was placed to contain the sludge without any specific criteria. An embankment road was built along the downstream valley providing access to dam toe and in the field visit it was possible to see its remains on the first 400 m of the valley. This road allowed local contractors to access the dam gravel and to explore the embankment material illegally (fine gravel used as a construction material), excavating
13 directly from the downstream dam toe. A spillway excavated in the rock exists in a valley adjacent to the reservoir (Figure 9) with a roughly circular section of 2 m diameter (FRANCA et al., 2007).
Figure 9. Upstream section of the spillway.
The spillway entrance level located on the reservoir left bank discharge was 504.4 m asl, which can be considered the normal operating level (cf. Annex VI).
2.1.2. Dam body
Fonte Santa tailings dam was an embankment of about 11050 m3 volume, approximately 12 m high, with crest length of roughly 30 m, crest width of roughly 5 m and the valley width at the bottom is about 11 m.
Some of these values are ensuing from the present detailed and through analysis different from the ones given in FRANCAet al. (2007) as shown in Table 3. As referred earlier, the dam was not object of an adequate project and planning, being the construction method informal and evolutional. Thus, dam geometry is not regular.
14
Table 3. Main characteristics of dam and spillway. Comparison of the present values with the ones presented in FRANCA et al. (2007).
In present study FRANCA et al. (2007)
Dam height, in average (m) 12 25
Crest length (m) 30 35
Valley width at the bottom (m) 11 11
Volume (m3) 11049 4500
Crest elevation (m asl) 505.0 505.0
Spillway entrance(m asl) 504.4 504.4
The present analysis was based on the map with scale 1:1000, where the dam layout was represented. Cross-sections in the dam body were made every 2 meters, obtaining thus 16 sections (cf. Annex I and Annex III), to allow volume estimation. The dam height was measured from the top to the bedrock; upstream, the dam body was bounded by roughly 7 m of sludge (cf. Annex III). As mentioned above, this tailings dam was constructed as a progressive process; the dam height eventually increased while the waste material of the mining activity deposited in the reservoir almost reached the dam crest. Therefore, the wedge of sludge is assumed adjacent to the dam body (cf. Figure 10). Figure 10 displays the central section representative of what was herein described; 16 transepts of the dam body were made to evaluate the dam volume integrating the cross-section by using the trapezoidal method, these are represented in the Annex III.
15
2.1.3. Characterization of the river catchment and the reservoir
The Fonte Santa tailings dam is located on the creek Ribeiro da Ponte; the creek changes its name in the dam section, and upstream it is called Ribeiro das Caravelas. This creek belongs to river Douro basin (Figure 11). The dam creates a basin of approximately 14.0 km2, see Figure 11, and its main watercourse is the Ribeiro das Caravelas which is about 7.9 km long, qualified as torrential, attending to its longitudinal profile.
Figure 11. Dam catchment represented on the military map (No 120) herein represented (with no specific scale).
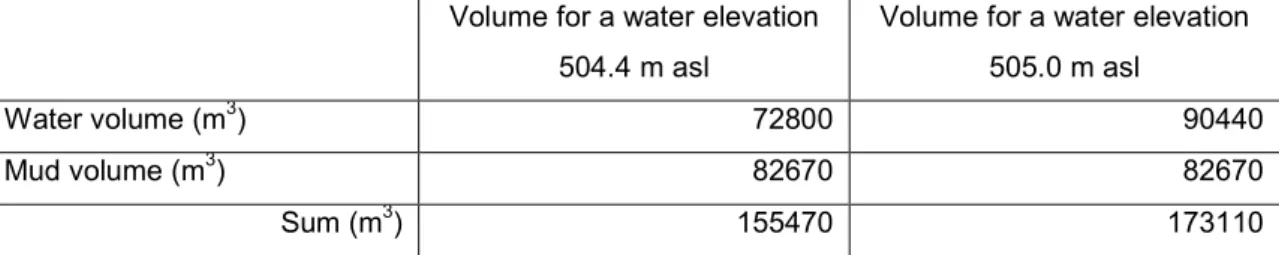
The reservoir occupies approximately a superficial area of 2.20 ha calculated for 504.4 m asl and 2.57 ha for 505.0 m asl. The reservoir volume was recalculated because the values obtained in 2007 seemed unrealistic, obtaining thus about 155500 m3 for level 504.4 m asl and for a water elevation of 505.0 m asl about 173100 m3 (Table 4). To estimate the volume a method using the cross-sections assigned to an influence area was used (cf. Annex II). Knowing that the mud was roughly at elevation 501.0 m asl, it was possible to separate the water area and the area of mud through the cross-sections and get the volumes using influence areas of each transept.
Table 4. Water and mud volumes for water elevations of 504.4 m asl and 505.0 m asl.
Volume for a water elevation 504.4 m asl
Volume for a water elevation 505.0 m asl
Water volume (m3) 72800 90440
Mud volume (m3) 82670 82670
16
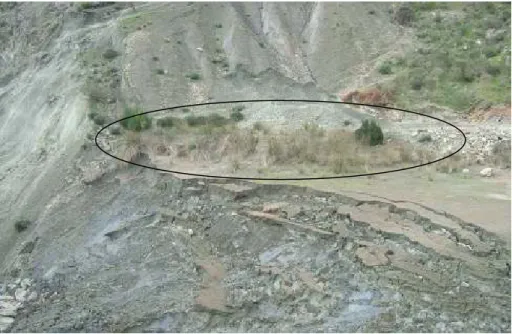
Probably in the summer the water level was low and the mud was visible. The explanation to this observation is based on the photos taken in 2007. In the winter season, the normal water level was at 504.4 m asl or above this. The difference between normal operating level and mud level of 3.4 m was inferred from the photos collected during survey. Figure 12 corroborates such analysis, showing that the bushes in the dam body grew eventually in the summer and had been under water in the winter season (deduction by the dry bushes).
Figure 12. The remains of the dam slope and the wedge mud (at elevation 501 m asl). Dry bushes due to submersion in the winter season indicated with the black line.
2.2. HYDROLOGY OF THE EVENT
2.2.1. Extreme flood on the day of the event
In FRANCA et al. (2007), the concentration time adopted to the river catchment was 3 h and the basin area soil occupation was characterized by a curve number of 90, considering the most humid antecedent conditions (AMCIII). This parameter was obtained from the CN (AMCII). According to FRANCA et al. (2007), on 20th November 2006 a large low-pressure system was centered in the Atlantic North near Iceland. From the 20th till the 24th of November this system moved towards the west coast of Ireland affecting the Portuguese territory. In the area of the Fonte Santa dam basin, a sea level pressure drop of approximately 25 mbar was observed between the days 20th and 24th of November (Figure 13). After the 24th, the system moved away from Ireland western coast, causing a pressure ascent in all Portuguese territory. The 25 mbar
17 pressure drop observed along those four days on the basin area was the cause of the extreme precipitation occurred on the 24th of November in all Portuguese territory.
Figure 13. Low-pressure system formed in Atlantic North on the days: a) 20th of November; b) 24th
November 2006. (in: FRANCA et al. (2007))
2.2.2. Inflow Hydrograph
The hydrology data provided to characterize the event were measured at meteorological station located in a village named Mogadouro, 12.5 km distant from Fonte Santa dam, the only station located in the interest area with useful precipitation registers of the event. Running the software HEC-HMS 3.1.0 (developed by U.S. Army Corps of Engineers and adequate to simulate precipitation-runoff processes of watershed systems) and having as input data the above mentioned river basin characteristics, the output data is the flood hydrograph in Figure 14. According to information, kindly provided in 2007 by the Portuguese Instituto de Meteorologia I.P., between the 23rd and the 25th of November 2006, a total rainfall of about 112.8 mm occurred on the basin area and 77% of this precipitation took place on the 24th, occurring 7% of the remaining precipitation on 23rd and 16% on 25th November. The peak flow of the hydrograph (19.5 m3/s) at the Fonte Santa dam was obtained on the 24th of November at 8:50 am. The total volume of water inflow into the reservoir for the three days of rain was of 1985 m3.
18
Figure 14. Inflow hydrograph.
2.2.3. Outflow hydrograph and reservoir routing
As referred before, there are two main tasks in the analysis of dam break events: the prediction of the reservoir outflow hydrograph and the routing of that hydrograph through the downstream valley (WAHL, 1998). The difference between lumped and distributed reservoir routing is that in a lumped system model, the flow is calculated as a function of a time alone at a particular location, whereas in a distributed system routing the flow is calculated as a function of space and time throughout the system (CHOWet al., 1988).
For a hydrologic system the continuity equation may take the simplified form:
)
(
)
(
t
Q
t
I
dt
dS
=
−
(2.1) I – the inflow into the reservoir as function of timeQ – the outflow from the reservoir
dt
dS
– rate of change of storage volume
A number of procedures and methods have been proposed for calculating the outflow hydrograph from a reservoir during a dam break (CHOWet al., 1988). In this work the inflow hydrograph, to be used later on the numerical modelling of the dam breach process, was considered null because the dam accident only occurred on the 27th November and as seen in Figure 14, the inflow after 26th November is negligible.
19
2.3. DAM BREACHING
2.3.1. Dam breach causes
As mentioned above, an extraordinary rainfall event took place in the region on the 23rd and 24th November 2006 and the dam failure happened only on the 27th November. The description of a loud sound heard on that day by local residents at a distance of 1000 m suggests a rather sudden wave travelling across the valley (FRANCA et al., 2007).
It is not clear how the breaking process occurred in this case. However, two situations may have occurred simultaneously: 1) the water level in the reservoir should be slightly below the dam crest (< 505.0 m asl) and with the high precipitation during three days the dam may have been overtopped for an unknown period and suddenly on the 27th the destabilization of the body dam and the complete failure occurred; 2) The spillway discharged eventually got clogged on the 27th, which induced the overflowing of the reservoir and consequent overtopping of the dam with subsequent dam failure.
The breaching dynamic process will be simulated and discussed in chapter 4, using the numerical model presented in FERREIRA et al.( 2009).
2.3.2. Breach geometry
WAHL (1998) affirmed that the parameters of an idealized dam breach in an embankment are the width, the depth, the side slope factor and the formation time. During the survey the breach parameters were obtained. The dam did not have a symmetrical and homogeneous shape as mentioned before. The final geometry has a nearly trapezoidal shape. The main geometric characteristics of breach geometry are shown in Table 5 and Figure 16
Table 5. Dam breach geometric parameters.
Top width (m)
30
Bottom width (m)
11
Approximate height (m)
12
Right riverbank slope (angle with the horizontal)
9.5 : 15.4
Left riverbank slope (angle with the horizontal)
9.5 : 11.5
These parameters are similar to the others proposed in FRANCA et al. (2007); only the height is quite different. The trapezoidal shape and the dam symmetry inferred in the 2007 survey are different, since the latter did not take into count the bedrock level. The breach parameters are
20
used later in the text for applying the numerical model; this will allow an estimation of the breach formation time.
Figure 15. Dam breach, view from downstream. The rock formation from the riverbed is visible.
Figure 16. Breach dam geometric (no specific scale).
2.3.3. Estimated water and mud releases
As evidenced at the spot in the first field visit, the dam body and a wedge of sludge and the reservoir water were washed to the downstream valley (Figure 8, Figure 12 and Figure 18). After the failure, residual water, fed by valley base flow, continued running downstream, opening a path on the reservoir sludge allowing the visualization of deposited layer through more sediments were transported downstream the valley. Only the sludge washed away during the failure was relevant to quantify the breach consequences in the downstream valley.
Here the water and sludge released at the time of the breach are estimated. The maximum water in the reservoir (505.0 m asl) corresponds to the maximum capacity of water in the reservoir. Figure 17 shows the stage-volume curve for the Fonte Santa reservoir, with sludge. The relation between the reservoir storage capacity and the water elevation from bedrock (not from sludge elevation) may be approximated by the following non-linear equation:
1
;
494
1134
2
))
(
92
.
691
(
1134
4
9
.
2166
1134
)
(
2 2=
+
×
−
×
×
−
+
−
=
V
z
R
z
h
(2.2)Vz – the volume at elevation (z) (m 3
21 y = 1134x2 + 2166,9x + 691,92 R2 = 1 0 20000 40000 60000 80000 100000 120000 140000 160000 180000 0 2 4 6 8 10 12
Elevation above the level 494 (m)
V o lu m e ( m 3 )
Figure 17. Reservoir capacity, with sludge.
The eroded amount of sludge from the upstream deposits in the reservoir is evidenced by a scar in the reservoir bottom (cf. Figure 8, Figure 12, Figure 15 and Figure 18)
Figure 18. Dam breach, view from upstream. The wedge of mud is visible.
The total volume (dam body and wedge mud) eroded and transported to the downstream valley are shown in Table 6:
22
Table 6. Estimated water and wedge mud releases during the breaching process.
Estimated water volume in the reservoir from 501 m asl to 505.0 m asl (m3) 90440
Estimated wedge mud volume 3500
2.3.4. Estimation of dam breach characteristics based on empirical formulations
There are several theoretical methods for estimating breach formation time (cf. WAHL (1998)), VONTHUN and GILLETTE (1990) proposed:
25
.
0
02
.
0
+
=
w fh
t
(2.3)tf – breach formation time (hours)
hw – depth of water (m)
They found a stronger correlation between the lateral erosion rate and depth and then for a total breach formation time versus depth. Using lateral erosion rate data, VONTHUN and GILLETTE (1990) obtained: w f
h
B
t
4
=
(2.4) b wC
h
B
=
2
.
5
+
(2.5)Cb a function of reservoir storage (m), as follows:
Table 7. Function of reservoir storage.
Reservoir size (m3) Cb (m)
< 1.23 x 10⁶ 6.1
1.23 x 10⁶ – 6.17x 10⁶ 18.3 6.17x 10⁶ – 1.23 x 10⁷ 42.7
> 1.23 x 10⁷ 54.9
FROEHLICH (1995) related the peak outflow to a power equation of both the breaching head and outflow volume, using case study data for 22 dam failures:
23 24 . 1 295 . 0
607
.
0
w w pV
h
Q =
(2.6)Qp – peak breach outflow (m3/s)
Vw – initial water volume above the final breach bottom position (m3)
WEBBY (1996) used dimensional analysis techniques to develop a similar equation for peak outflow using Froehlich´s data:
40 . 1 367 . 0 5 . 0
0443
.
0
w w pg
V
h
Q =
(2.7) g – gravity acceleration (m/s2)For instant breaks with a complete removal of the dam and without dissipation of energy, the peak breach outflow corresponds to the RITTER solution, which is an upper bound of the real outflow discharges. RITTER (1892):
2 3
27
8
w v pB
g
h
Q =
(2.8)Bv – valley average width (m)
The following tables give the results by applying these mentioned empirical formulations to Fonte Santa dam.
Table 8. Breach formation time.
VONTHUN and GILLETTE (1990). First equation.
VONTHUN and GILLETTE (1990). Second equation.
Tf (s) 1800 2880
hw (m) 11.35 11.35
Cb (m) - 6.1
24
Table 9. Peak breach outflow solutions.
FROEHLICH (1995) WEBBY (1996) RITTER (1892)
Qp (m3/s) 358 274 972
Vw (m 3
) 90440 90440 -
Bv (m) - - 27.40
The time to the breach formation is between 30 minutes and less than one hour and outflow peak by FROEHLICH (1995) is 358 m3/s and by WEBBY (1996) solution is 274 m3/s, both bounded by RITTER solution results.
2.4. DISCUSSION
As referred, there is no knowledge of a dam project; the dam shape wasn’t regular and it didn’t have a horizontal crest level. This was a tailings dam without any formal approval for its construction. The description of a loud sound heard on that day by local residents at a distance of 1000 m suggests a rather sudden wave travelling across the valley (FRANCA et al., 2007), and for that it is believed that the dam failure happened only on the 27th November, although the rainfall event took place in the region on the 23rd and 26th November 2006. It is not clear how the breaking process occurred. However, as described before two situations may have occurred simultaneously, situation that may had weakened the embankment. This study contributes positively in order to obtain data from hydrologic, hydraulics and geometric data of Fonte Santa mine tailings previously unknown.
25
3. ANALYSIS OF THE DOWNSTREAM VALLEY
3.1. VALLEY MORPHOLOGY PRIOR TO THE DAM BREAK
This chapter aims at updating and improving the accuracy of the estimates of the previous field survey FRANCA et al. (2007) after the dam break, in what concerns hydrodynamic impact and morphological changes in the downstream valley. 39 sections were surveyed after the dam break, relevant to the present analysis where important morphological changes in the valley occurred corresponding mainly to areas of significant deposition/erosion patterns.
To analyse the valley morphology prior to the dam break, cross-section at the same locations studied in the field visit in 2007 (after the dam break) were made, based on the 1:25000 military topographic map No. 120 (Annex IV) . 39 sections data were overlapped with the 1:25000 topographic map showing that the sections 0,1,2 were coincident with the dam body; thus, for this study, these sections were included in the dam body and the downstream valley analysis started from section 3 (cf. Annexes III and VI).
To define the thalweg of the surveyed valley transepts, the minimum value of the cross-sections obtained by the topographic map 1:25000 were used instead the 2007 field survey data. The profiles obtained for these 39 sections were roughly similar to the profiles raised for the same sections in field visit (2007). The differences between these two surveys are probably due to the fact that distances and slopes inclination raised in the field were estimated locally.
3.2. VALLEY MORPHOLOGY AFTER THE DAM BREAK
During 2007 surveys, data were collected by means of GPS Fast Static Surveying by a rover Leica-GS20 as mentioned in FRANCA et al., (2007); for post-processing, the Leica GISDataPro was used with a reference station based in Mirandela (coordinates inWGS84: Lat 41◦31_00.41592__N; Long 07◦11_10.19545__O; Ellipsoidal height 332.019 m; Mean Sea Level height 275.954 m). The reference station belongs to the GPS/GNSS network, managed by the Portuguese Geographic Institute. The results of the post processing reveal a mean position and height quality of approximately 20 cm FRANCA et al. (2007).
The extensive field visit in 2007 to the downstream valley was supported by adequate topographic GPS. GPS provided data: for the coordinates of the 39 sections (sections with relevance in the analysis of valley) regarding the dam and relevant points that defined erosion/deposition and maximum water levels for each section, covering a total of 2525 m . According to local accounts, the dispersion of the mud released from the reservoir, however, was observed at the creek outlet at Sabor river (more than 17.5 km downstream the dam), although with no significant impact on the river morphology.
26
In this work, the first section defined as the dam section corresponds to the second section, i.e. cross-section 2 (Table 10) defined in the field visit. Now, the distance between the dam section and the last section (cross-section 34) is reduced by 26.5 m (distance among section 0 – 2, see Table 10). Sections with the same number (6´, 10´, 22´, 29´) (see Annex IV) correspond to a widening or an important structure and they were included to better detail these valley singularities. Table 10 shows the sections numbers and their corresponding distance relatively to the dam section:
Table 10. Distance between the dam section and the last section surveyed where significant impact in river morphology was observed.
Cross-section 2007 Distance (m) Distance from the dam section herein adopted (m) Cross-section 2007 Distance (m) Distance from the dam
section herein adopted (m) 0 0 18 1053.47 1026.99 1 11.12 19 1085.26 1058.78 2 26.49 0 20 1124.36 1097.88 3 46.25 19.76 21 1185.81 1159.33 4 68.58 42.1 22 1233.38 1206.9 5 100.42 73.94 22´ 1241.73 1215.25 6 159.54 133.06 23 1303.67 1277.19 6´ 182.64 156.16 24 1349.74 1323.26 7 246.81 220.34 25 1459.90 1433.42 8 327.02 300.54 26 1509.19 1482.71 9 377.19 350.71 27 1792.12 1765.64 10 482.86 456.38 28 1844.19 1817.71 10´ 524.73 498.25 29 1941.17 1914.69 11 567.89 541.41 29´ 2039.27 2012.79 12 674.61 648.13 30 2058.10 2031.61 13 780.74 754.26 31 2165.46 2138.98 14 837.67 811.2 32 2261.53 2235.05 15 900.60 874.13 33 2305.06 2278.58 16 946.05 919.58 34 2524.88 2498.39 17 990.25 963.78
For each section a schematic drawing was made (Annex IV). Figure 19 shows one of these, sections; corresponding to section 6. This section is near the dam containing the road to access to the dam toe previously mentioned and that was eroded.
27
Figure 19. Cross-section 6, example of the detailed survey (cf. Annex IV).
In Figure 20 the channel width is presented along the valley; this is herein defined as the locally observed lateral extension of the dam break reach, i.e. the width of the actual active channel during the passage of maximum flood discharge. After the first section, the channel width decreases; sections 9 (distance about 350 m after the dam), 10´ (distance about 498 m after the dam) present an increase relatively to the adjacent sections (prior and after); those with a large increase were: 7 →9 (distance about 220 m and 350 m after the dam, respectively); 18→22 (distance about 1026 m and 1206 m after the dam, respectively); 29´→30 (distance about 2012 m and 2031 m after the dam, respectively). In section 20 (distance about 1097 m after the dam) it was observed an isle in the middle of the channel, eventually made by the flood wave which formed a channel near the left bank isolating a portion of soil and vegetation (cf. AnnexIV).
28
Figure 20. Lateral extension of the morphological impacts of the flood wave.
It is important to refer that about 2000 m downstream the dam there is a bridge, where a reduction of the channel width exists (Figure 21 and Figure 22). This constitutes a control section and during the flood a reservoir was created upstream.
Figure 21. View from the bridge to downstream (Section 29).
Figure 22. View from the bridge from upstream (Section 29).
The largest width corresponds to section 31 (distance about 2138 m after the dam), where water level decreased (Figure 23) as downstream sections (32, 33, and 34) had a wall on the left bank
29 of the river that reduced the width. In these latter river sections it was also observed thick vegetation on the river banks.
Figure 23. Maximum flood levels observed in field.
In Figure 24 the maximum water level along the valley profile and the thalweg elevation are shown. The thalweg elevation was calculated through 1:25000 topographic map. The water depths were as high as about 6 m and this occurred in the first sections, just after the dam where the valley is narrower.
30
Figure 24. Valley profile with the maximum flood levels observed in field.
In Annex V an inundation map consequence of the dam break occurrence where the maximum limits of the flood are visible, is presented. Erosion/deposition volumes were estimated taking into account the erosion/deposition areas surveyed in the field visit at each section and multiplied by the influence lengths that each section had. The amount of total erosion by section was the result of bed and banks erosion (lateral erosion). Figure 25 shows erosion and deposition volumes along the valley; this starts at the first section after the dam and does not account for the amounts corresponding to the dam body and the mud eroded from the reservoir.
31
Figure 25. Estimated erosion and deposition volumes of the river bed and banks throughout the downstream valley (body dam and wedge mud are not included).
Figure 26. Section with high erosion. Figure 27. Section with high deposition.
The main erosion occurs in the first 300 m downstream the dam (see Figure 28). This part of the valley was filled with an informal road to keep access to the dam downstream slope for illicit gravel extraction (see chapter 2.1.1). Consequently, the discharge outflowing from the dam break washed this road which constitutes the main source of the eroded material in the valley. The lower width channel, the maximum water level and the eventual large flow velocity, consequently
32
eroded vastly the road material (Figure 26). After 300 m, the main erosion observed results from bank erosion and not specifically from bed erosion.
The deposition occurred essentially where the available flow area increased offering conditions to lower flow velocities lowering thus transport capacity (Figure 27).
Downstream the dam it is possible to see that the fraction of deposition is nearly the double of the erosion, this last one is concentrated near the dam section, where the valley was filled with the illicit road referred previously. Downstream, mainly deposition of the dam material is verified due to the immense volume of fine gravel that composed the informal dam body (Figure 28). It was verified locally that some part of the deposited material throughout the valley is originated from the same material of the dam body.
Figure 28. Example of a local where large deposition occurred (roughly at section 10´).
On the next tables, estimation of eroded and deposited volumes are given.
Table 11. Total erosion and deposition volumes of body and mud wedge from the reservoir.
Body dam (m3) 11050
Mud wedge from the reservoir (m3) 3510
Total (m3) 14560
Note that the volume of body dam includes the erosion volume of section 0, 1 and 2.
Table 12. Total erosion and deposition volumes throughout the downstream valley.
Total erosion in the valley (bed+ banks) (m3) 4575
33 With these values one obtains the total volume balance along the valley:
3 ) (
D
0
10
%
V
9765
m
E
V
V
s=
∆
e+
bed banks−
≈
≤
⇔
∆
s=
∆
+ (3.1)∆Vs – balance between volume of the erosion in bed + banks and dam + mud released and the
deposition (m3)
∆Ve – volume of the dam and mud released (m 3
)
E (bed+banks) – volume of the erosion in bed and in the banks along the downstream valley (m 3
)
D – deposition volume (m3)
There is a difference of 9765 m3 between erosion and deposition estimates (Table 11 and Table 12). Mud wedge volume was estimated by photos; this value can be unrealistic and it is possible that the sludge travelled downstream more than 2500 m. The greatest erosion, as seen in Figure 25 is concentrated in the first 300 m; probably these values obtained ‘in situ’ are overestimated. If one considers the distance between the study reach and Sabor river, roughly 15 km, and taking into account that fine sediments reached this river according to local accounts (a layer of roughly 0.10 m deposited along de valley), this could arguably represent this difference.
3.3. DISCUSSION
The inundation reach and the main morphological impacts of dam break were reconstructed. The 35+4 cross-sections along the downstream valley were considered sufficient to characterize Ribeiro da Ponte creek. A clear symmetric pattern between maximum water depths and river widths is observed, i.e. larger valley correspond to lower water depths.
The main erosion happened at the first 300 m and after this distance there was only little bank erosion. The deposited material volume is twice the eroded material without accounting for the body dam and wedge mud. Adding the body dam + wedge mud it was not possible to obtain equilibrium of the erosion/volume with the deposition/volume, within this study reach of 2500 m.
35
4. MATHEMATICAL MODELLING OF THE BREACHING
4.1. DESCRIPTION OF THE NUMERICAL MODEL
The model STAV-breach simulated the breaching progress due to overtopping of the dam as a function of the dam characteristics and it is herein applied after calibration based on the observations in the field. A detailed description of STAV (Strong Transients in Alluvial Valleys) breach model can be found in FERREIRA et al. (2009). The model is to provide a consistent and continuous outflow hydrograph, adequate as a upstream boundary condition for flow propagation calculations.
The flow is assumed 2D and considered stratified where a mixture of water and granular material removed from the bottom is considered. The granular phase is assumed to be composed by quasi-elastic and slightly rough and nearly spherical sediment grains. The fluid is viscous and incompressible. The model considers three layers in the flow (Figure 29): A) a layer of clean water or with suspended sediments where turbulent stresses are dominant (RANS equations are used within this layer); B) a transport layer where stresses source are mainly collisional effects (mass conservation equation, movement quantity equation and a closure defining the energy associated to the particles fluctuation are used within this layer, deducted from the context of the theory of Chapman-Enskog); C) bed-sediment layer with insignificant horizontal movement (FERREIRA et al., 2009).
Figure 29. Sketch of the stratified flow idealized in the numerical model. The more relevant flow regions
described earlier are indicated.
Figure 30. Definition of discretized areas.
The model is based in four essentials equations (4.1, 4.2, 4.3 and 4.4). Total mass conservation equation of the embankment, FERREIRA et al. (2009):