TOOL FOR WORK PLANNING USING
EVM (E
ARNED
V
ALUE
M
ANAGEMENT
)
METHOD
A
NAA
LEXANDRAR
AMALHOM
ATEUSDissertation submitted for partial fulfilment of the requirements for the degree of
MASTER IN CIVIL ENGINEERING — BUILDING CONSTRUCTION
Dissertação submetida para satisfação parcial dos requisitos do grau de
MESTRE EM ENGENHARIA CIVIL — ESPECIALIZAÇÃO EM CONSTRUÇÕES
Supervisor: Professor João Pedro da Silva Poças Martins
JULHO DE 2012
Tel. +351-22-508 1901 Fax +351-22-508 1446
miec@fe.up.pt
Editado por
FACULDADE DE ENGENHARIA DA UNIVERSIDADE DO PORTO Rua Dr. Roberto Frias
4200-465 PORTO Portugal Tel. +351-22-508 1400 Fax +351-22-508 1440 feup@fe.up.pt http://www.fe.up.pt
Reproduções parciais deste documento serão autorizadas na condição que seja mencionado o Autor e feita referência a Mestrado Integrado em Engenharia Civil - 2009/2010 - Departamento de Engenharia Civil, Faculdade de Engenharia da Universidade do Porto, Porto, Portugal, 2009.
As opiniões e informações incluídas neste documento representam unicamente o ponto de vista do respectivo Autor, não podendo o Editor aceitar qualquer responsabilidade legal ou outra em relação a erros ou omissões que possam existir.
Este documento foi produzido a partir de versão electrónica fornecida pelo respectivo Autor.
i ACKNOWLEDGMENTS
Foremost, I would like to thank my supervisor Prof. João Pedro Poças Martins for the guidance and patience, not to mention his unsurpassed knowledge of IT application on the construction industry. This thesis would not have been possible without the support and knowledge of Eng. Pedro Vieira e Moreira from AdP.
I am most grateful to fellow and brief colleagues at AdP, Eng. Rita Cunha, Eng. Inês Alves, Eng. Arménio Miranda and Eng. Helena Rodrigues for the new found friendship, support and kindness. I would like to acknowledge the developer Valdemar Freitas at AdP without his work and continuous support, and everyone who embrace my work at AdP.
I would like to thank my parents, for all the kindness, generosity, hard work throw out my childhood and now continuing throw out the beginning of my adulthood.
Above all, I would like to thank my grandfather, who among many other traits nurtured, from an early age, my love for the English language.
iii ABSTRACT
Today's unpredictable economic environment, propel the late change on how the construction industry see the added value to their companies by combining IT and management processes.
Collaborative tools are posing to be a satisfactory response in low levels of productivity oversee throw-out the industry. Collaborative construction project management IT tools are still in development but have already proven to be suitable answer to control of project cost and time overruns.
While the EVM (Earned Value Management) technique has been used in other industries such as software and product development to a wide extent, its applicability within the construction industry is still overlooked as a common practice in project management.
The aims of this research were to design and develop a framework for a collaborative tool to give feedback on project performance using the EVM (Earned Value Management) method.
With this study, the framework for performance reporting developed at the company Águas do Porto (AdP) has two different formats, Up-to-Date and Monthly. A satisfactory response to the content and use of the developed reports was analyzed.
KEYWORDS: EVM, Collaborative Tools, Project Management, System Development, Performance Reporting.
v RESUMO
A imprevisibilidade característica do ambiente económico atual leva a que as empresas do sector da construção vejam o valor acrescentado que advém da combinação das Tecnologias da Informação (IT) com processos de gestão.
As ferramentas colaborativas tornam-se imperativas na resposta aos baixos níveis de produtividade que caracterizam o sector. A integração das ferramentas colaborativas com as IT, aplicadas à gestão de projeto no sector da construção ainda se encontra numa fase de desenvolvimento, mas já deram provas de que podem ser aplicadas como resposta para controlo de derrapagem, tanto de custos de projeto como de tempo.
Enquanto o recurso à técnica EVM (Earn Value Management) tem sido largamente utilizado noutros sectores industriais, tais como o desenvolvimento de software e de produto, a sua aplicabilidade na indústria da construção é ainda subvalorizada como prática corrente na gestão de projeto.
O objetivo deste trabalho passou pelo desenvolvimento e concepção de uma framework para uma ferramenta colaborativa de forma a conhecer-se a performance de um dado projeto utilizando o método EVM.
Com este estudo, a framework para a obtenção de relatórios de desempenho, desenvolvida na empresa Águas do Porto (AdP) assume dois formatos diferentes, dividindo-se no formato em tempo real, e relatórios em formato mensal. Foi analisada uma resposta satisfatória do conteúdo e utilização dos relatórios resultantes.
PALAVRAS-CHAVE: EVM, Ferramentas Colaborativas, Gestão de Projeto, Desenvolvimento de Sistemas, Relatórios de Performance.
TABLE OF CONTENTS
ACKNOWLEDGMENTS ... i
ABSTRACT ... iii
RESUMO ... v
1. INTRODUCTION
... 11.1.BACKGROUND TO THE PROBLEM ... 1
1.2.RESEARCH GOALS AND METHODOLOGY ... 2
1.3.DISSERTATION CONTENTS ... 2
2. EARNED VALUE MANEGEMENT
... 32.1.THE EVMMETHOD ON MONITORING PROJECT EXECUTION ... 3
2.2.KEY COMPONENTS ... 3
2.3.HOW EVMWORKS ... 4
2.3.1.SCOPE MANAGEMENT ... 5
2.3.1.1DefineScope ... 6
2.3.1.2CreateWorkBreakdownStructure(WBS) ... 6
2.3.1.3.ControlScope ... 7
2.3.2.TIME MANAGEMENT ... 7
2.3.2.1.ProjectScheduleDeveloping ... 7
2.3.2.2.ControlSchedule ... 8
2.3.3.COST MANAGEMENT ... 9
2.3.3.1.EstimatedCost ... 9
2.3.3.2.ControlCost ... 9
2.4THE EVMMETHOD PUT TO GOOD USE –PERFORMANCE REPORTING ... 12
2.5.THE SIGNIFICANT ADDITION OF EVMCONSTRUCTION PROJECTS... 14
3. COLLABORATIVE TOOLS
... 173.1.TO CONSTRUCT IS TO COLLABORATE ... 17
3.2.UNDERSTANDING THE VALUE OF COLLABORATING TECHNOLOGIES IN CONSTRUCTION ... 17
3.2.1.WHAT IS A COLLABORATIVE TECHNOLOGY ... 17
3.2.2.THE RELATIONSHIP BETWEEN IT AND THE CONSTRUCTION INDUSTRY ... 18
viii
3.3.ROAD TO ASUCCESSFUL ADOPTION... 21
4.
CASE
STUDY
... 234.1.COMPANY BACKGROUND ... 23
4.2.PROBLEM DISCUSSION ... 23
4.3.UNDERSTANDING MANAGEMENT PROCESSES ... 24
4.3.1.EXISTING IT INFRASTRUCTURES SUPPORTING WORK PLANNING ... 26
4.3.2.EXISTING COLLABORATIVE WORK PLANNING PRACTICES ... 27
4.3.2.1.EVMMetrics ... 27
5.
COLLABORATIVE
EVM
SYSTEM
... 315.1GENERAL MODEL REQUIREMENTS ... 31
5.2TECHNOLOGY EMPLOYED... 32
5.3.MONTHLY EVMREPORT ... 33
5.3.1.OVERALL STATUS REPORTING ... 33
5.32.PROGRESS REPORTING ... 34
5.33.FORECASTING ... 34
5.4. UP-TO-DATE EVM REPORT ... 35
5.4.1TIME MANAGEMENT ... 35
5.4.2. COST MANAGEMENT ... 36
5.4.2.1. Real Cost Incurred Parameter - α1 ... 36
5.4.2.2. Real Cost Incurred Parameter – α2 ... 36
5.4.2.3. Real Cost Incurred Parameter – α3 ... 37
6. SYSTEM’S IMPLEMENTATION AND EVALUATION
... 396.1. EVM REPORT PUT INTO PRATICE ... 39
62MONTHLY EVMREPORT –PC142/2011 ... 39
6.2.1 OVERALL STATUS REPORTING RESULTS ... 42
6.2.2 PROGRESS REPORTING RESULTS ... 43
6.2.3 FORECASTING RESULTS ... 44
6 3 UP TO DATE EVMREPORT –PC142/2011 ... 46
7. CONCLUSION
... 497.1. CLOSING NOTES ... 49
7.2. FUTURE RESEARCH ... 50
LIST OF FIGURES
Figure 1 - EVM Graphical Representation ... 3
Figure 2 – CAP concept in EVM [adapted from (FLEMING and KOPPELMAN, 1999a) ... 6
Figure 3 – WBS example [extracted from (PROJECT MANAGEMENT, 2004) ... 7
Figure 4 – Examples of Project Schedules [extracted from (PROJECT MANAGEMENT, 2004) ... 7
Figure 1 – Illustrative integrated project management approach of the EVM method [extracted from(FLEMING and KOPPELMAN, 1999b) ... 12
Figure 6 – Illustrative status graphical display [extracted from (PROJECT MANAGEMENT, 2004) ... 13
Figure 7 – Example of a the “traffic light approach” graph ... 13
Figure 8 – EAC graph over time [extracted from (ANBARI, 2003) ... 14
Figure 9 – The technology adoption curve [extracted from (NITITHAMYONG and SKIBNIEWSKI, 2004) ... 19
Figure 10 – IT Related Process Innovation in 18 industries [extracted from (W@ATCH, 2010) ... 19
Figure 11 - Project Life Cycle to building new system at AdP ... 24
Figure 12 – Extract from a urban watershed project ... 25
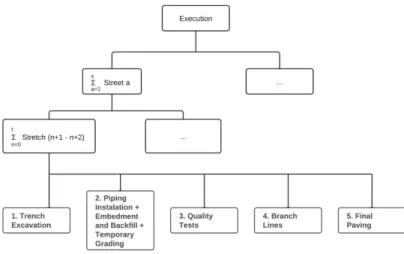
Figure 13 – Execution phase e WBS ... 26
Figure 14 – EV framework ... 29
Figure 15 – Framework for the life cycle of Information Flow of the EVM method ... 29
Figure 16 – Framework correlating the standard Project Life Cycle and the EVM model ... 31
Figure 17 – Collaborative Platform Interface ... 33
Figure 18 – EVM Graphical Representation for the “Up-to-date EVM Report” ... 36
Figure 19 – Monthly EVM Report Cover for PC142/2011-MONTH3 ... 40
Figure 20 – Monthly EVM Report Page 1 for PC 142/2011-MONTH3 ... 40
Figure 21 – Monthly EVM Report Page 2 for PC142/2011- MONTH3 ... 41
Figure 22 – Monthly EVM Report Page 3 for PC142/2011- MONTH3 ... 42
Figure 23 – Graphical Display of the S-curves for the EVM report: PC142/2011- MONTH 3 ... 44
Figure 24 – Graphical variation of the cumulative CPI and SPI values for the EVM report: PC142/2011- MONTH 3 ... 45
x
Figure 26 – Graphical Display of TEAC and DAC over time: PC142/2011- MONTH 3 ... 46 Figure 27 – Graphical Display of the S-curves for the up-to-date EVM report: PC142/2011 – day 120 46 Figure 28 – Extract for the Time Management forecast for the Up-to-Date EVM Report
PC142/2011-DAY 120 ... 48 Figure 29 – Extract for the Cost Management forecast for the Up-to-Date EVM Report PC142/2011-DAY 120 ... 48
LIST OF TABLES
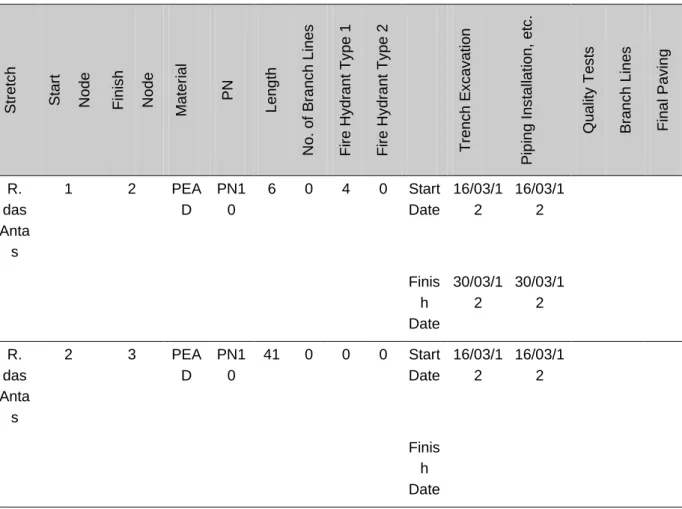
Table 1 – Example of the structure of the daily on-site report for a water supply project ... 27
Table 2 – Example of the payment percentage structure ... 28
Table 3 – Information on the case study project ... 39
Table 4 - Overall Status Reporting Results (cumulative data) PC142/11 ... 42
Table 5 - Progress Reporting Results PC142/11 ... 43
Table 6 – CPI and SPI thresholds ... 44
Table 7 - Forecasting Results (cumulative data) PC142/11 ... 44
LIST OF ABBREVIATIONS
IT – Information Technology EVM - Earned Value Management CPM – Critical path Method PV - Planned Value
BCWS – Budgeted Costs for Works Scheduled AC - Actual Cost
ACWP – Actual Cost for Works Performed EV - Earned Value
BCWP – Budgeted Costs for Work Performed BAC - Budget at Completion
DAC - Duration at Completion
DoD - United States Department of Defense
C/SCSC – Cost and Schedule Control Systems Concepts ANSI/EIA - American National Standards Institute WBS - Work Breakdown Structure
PMB - Performance Measurement Baseline
PMBOK GUIDE - Guide to the Project Management Body of Knowledge CAP - Control Account Plan
PERT - Program Evaluation and Review Technique SV - Schedule Variance
SV% - Schedule Variance Percentage SPI - Schedule Performance Index TEAC - Time Estimate at Completion TVAC - Time Variance at Completion CPI - Cost Performance Index CV – Cost Variance
CV% - Cost Variance Percentage EAC - Estimate at Completion VAC - Variance at Completion CR – Critical Ratio
ETC – Estimate at Complete
TCPI – To be Complete Performance Index PVRate – Planned Accomplished Rate
xiv
A/E/C – Architecture/Engineering/Construction
KDSS-CPM - Knowledge Based Decision Support System for Construction Project Management AdP – Águas do Porto
DN – Nominal Diameter PN – Nomimal Pressure CAD - Computer-Aided Design BOQ – Bill of Quantities
VBA – Visual basic for applications
1
INTRODUCTION
1.1.BACKGROUND TO THE PROBLEM
Delays in construction projects have negative effects for all parties involved. Various studies on causes for such delays have been conducted and it has been shown that approximately one-third of all construction projects are exceeding both time and budget limits. (YEO and NING, 2002) Time and budget deliveries are key competitive factors for any construction organization, setbacks in such factors have negative effects both for owners and contractors. While owners might suffer loss of revenue or damages to the company’s image, contractors might face higher overhead costs, longer work periods and also decreased chances in future bids. Thus, having a tool capable of foreseen such delays and overruns is in the interest of every party involved (DAVE and KOSKELA, 2009).
Several studies indicate planning and monitor of a project as cause for delays and overruns. Current practices in project planning consider the integration of all project phases into a single schedule, application of CPM, resource-loading of project schedule, detailed review of the schedule, resource allocation and cost estimates per activity. Such techniques force the project team to break down the project into smaller pieces of work and defining relations between activities, helping reduce project delays. The resulting baseline of the work scope could be used for project controlling during execution, and this is where the EVM (Earned Value Management) method is brought into play. Formatting a basis for corrective action to take place, if necessary, to prevent foray of cost, time and scope is also a necessary step towards effective project management in construction (FLEMING and KOPPELMAN, 1999a).
Construction’s multidisciplinary aspect as lead, now more than ever before, to a high level of integration required from the several participants involved in the process. Pressures to reduce lead times, cost overruns, using fewer resources have increased. In addition, such high level of integration leads to pressures to improve communication platforms among colleagues and to establish consistency in tools and procedures used (GARNER and MANN, 2003, NITITHAMYONG and SKIBNIEWSKI, 2004). In order to tackle the above issues, organizations try to incorporate some form of computer-supported collaborative tool into routinely practices of their professionals. Even though such collaborative tools are widely incorporated into the professionals work and have been viewed as a strategic solution to increase competitiveness, reports still challenge the industry to reduce construction costs by up to 30% (MARSH and FLANAGAN, 2000). Aside from increasing values of IT spending and usage in most of the organizations, the sector still is challenged when it comes to information technology acceptance, even being labeled as a low-tech industry when compared with IT related process innovation levels on other industries (MARTINS, 2009).
2
1.2.RESEARCH GOALS AND METHODOLOGY
To design and develop a framework for a collaborative tool to manage project performance using the EVM (Earned Value Management) method applicable in a work environment was the main goal of this research. The methodology used was action and participatory research on the case study environment.
1.3.DISSERTATION CONTENTS
The text is subdivided in seven chapters. Literature review on the subjects EVM and Collaborative tools was outlined in the second and third chapters accordingly. The case study organization characterization is detailed in the fourth chapter. The developed model is represented in the fifth chapter. Implementation and model’s evaluation was analyzed in the sixth chapter. Closing notes and future research was overviewed in the seventh chapter.
2
EARNED VALUE MANAGEMENT
2.1.THE EVMMETHOD ON MONITORING PROJECT EXECUTION
Feedback is crucial for maintaining projects within their schedule and cost baseline. Cost control tools help project managers get a handle on project plan execution with budget updates and forecasting of final results. (CHOU [et al.], 2010) With its bottom-up approach, Earned Value allows data collection to take place during the entire duration of the project’s lifecycle, while requiring in depth information on three main project inputs: scope, time, cost, are required from its users full project’s scope definition and detailed time-cost planning (MARSHALL, 2007). It calculates cost and schedule variances, performance indices, and it also forecasts project cost and schedule at completion. Evaluating work packages performance can be measured in euros, hours, worker days, or any other similar unit. Underrated and underutilized, in the construction industry EVM might play a crucial role in tackling many problems associated with the sector’s work practices (FLEMING and KOPPELMAN, 2002).
The current chapter will start by giving the reader a comprehensive read on the project management knowledge areas where EVM steps in, and how it is able to give its performance indicators. The last subchapter will be focused on reviewing whether it might be useful in a construction organization specifically the organizations focused on horizontal repetitive projects (exp. water supply systems), as the company studied throughout this research.
2.2.KEY COMPONENTS
EVM employs three base parameters to evaluate work accomplishment. These three dimensions enable EVM to incorporate project’s scope, schedule and cost on a unified basis for the purpose of monitoring and forecasting project performance (ANBARI, 2003, PROJECT MANAGEMENT, 2004). The three metrics are, as illustrated by figure 1:
4
Planned Value (PV) - Approved time-phase budget baseline to accomplish the entire project. It can be viewed as the value to be earned (or spend) as a function of project work accomplishments up to a given point in time. It can be also named Budgeted cost of Work Scheduled (BCWS); the PV can be achieved through cost estimation, see section 2.4.3.1; Actual Cost (AC) - Cumulative cost spends, to actually achieve a work activity within a project. It can be also named Actual Cost of Work Performed (ACWP); example of how AC can be achieved in the owner’s perspective are the monthly payments issued to the contractor; Earned Value (EV) - Represents the amount budgeted for performing the work that was produced up to a given point in time. It can be obtained by multiplying the activity’s total budget by its completed portion. It can be also named Budgeted Cost of Work Performed (BCWP).
Other primary elements are:
Budget at Completion (BAC) - The highest value of the cumulative Planned Value curve, and the total budget baseline assigned to complete the entire project’s work;
Duration at Completion (DAC) – The approved time frame for project completion.
Another element that combines both BAC and DAC, called the planned value rate, PV rate, and can be defined by the average PV per time period, and given by the formula 1 (ANBARI, 2003):
DAC BAC
PVRate= (1)
2.3.HOW EVMWORKS
Originally, dating back from the late 1800s, the concept came from industrial engineers who, on the factory floor, have used the three-dimensional approach listed above to assess cost performance, in its most basic form. Industrial engineers compared their earned standards, the physical factory output, against the actual costs incurred. Then actual costs were compared with planned standards, the original physical work planned to be accomplished to estimate the schedule results and cost variances (FLEMING and KOPPELMAN, 1998).
A formal concept of Earned Value was introduced by the United States Department of Defense (DoD) around 1967. Completed with a selection of 35 criteria of cost schedule control, C/SCSC was used in large acquisition programs to retain “risk” of cost growth (FLEMING and KOPPELMAN, 1999a). The use of earned value by other governments has been largely reported over the last 30 years. However the set of strict criteria has intimidated the private industry for years, inhibiting a broader implementation of the concept. To encourage wider use, the C/SCSC criteria were abandoned and a more flexible use of the concept was formally issued as the Earned Value Management System in December 1996. Project Management Institute’s A Guide to the Project Management Body of Knowledge (PMBOK GUIDE) provided the simplified terminology and formulas. EVM was finally codified by the American National Standards Institute (ANSI/EIA) as Standard #748, in July 1998 (ANBARI, 2003, MARSHALL, 2007).
Over the last two decades, rapid change of this presumption has been documented. Both global competition and technological developments propel this change. Popular project management software packages also play an essential role when it comes to persuade established mindsets. Companies want
to give a reliable response to their project control growing demands, changing EVM’s image into a widely spread system (ABBA, 1997).
EVM is an inclusive methodology used to monitor efforts within a project. The methodology comprises many fields of project management, including project organization, planning, scheduling and budgeting, accounting, analysis, reporting, and change control (FLEMING and KOPPELMAN, 1999b). To do so EVM requires a thoroughly defined project scope articulated with allocated resources, all shaped into a significant project schedule for performance. Generally these terms are referenced as bottom-up project baseline plan (MILOSEVIC and KNOVEL, 2003).
To extend its analysis through the several levels of project management, EVM incorporates specific mechanics to include the use of the work breakdown structure (WBS), performance curves (S-curves), as well as a defined set of performance key components and metrics (MARSHALL, 2007).
The methodology begins with setting up a project baseline. This enables project managers, to determine how much of the planned work you have accomplished as of any point in time in the form of Performance Reports (MILOSEVIC and KNOVEL, 2003, PROJECT MANAGEMENT, 2004). To achieve such common language, a time-phased sum of detailed tasks to be accomplished, outlining scope, schedule and cost need to be put into place initially (FLEMING and KOPPELMAN, 1999a). The EVM mechanics will monitor any project efficiently against a firm baseline.
In the following subchapters the EVM principles and mechanics will be briefly overviewed. 2.3.1.SCOPE MANAGEMENT
Scope Baseline defining is essential in accomplishing performance assessment of future works when it comes to using EVM as an evaluation technique. According to The PMBOK® Guide (PROJECT
MANAGEMENT, 2004), project scope management “includes the processes required to ensure that
the project includes all the work required, and only the work required, to complete the project successfully”. The scope management plan provides guidance on how project scope will be specified,
documented, and controlled. The output of the scope management processes will need a sound integration with the three other knowledge area management processes.
The extent and following characteristics of such management plan may be informal, formal, highly or briefly detailed according to the needs of the project. The processes necessary to manage the scope of a project thoroughly are briefly described in this section according to The PMBOK® Guide guidelines
and adapted to the work developed over this text (PROJECT MANAGEMENT, 2004).
EVM provides a single integrated management control system for projects during their full life cycle, bounding all levels of management with a common performance language. Its integrated approach gives management the ability to accurately measure performance while the project moves from zero to 100 percent completion rate.(MILOSEVIC and KNOVEL, 2003)
Summation of work scope is accomplished using a device called Work Breakdown Structure (WBS) and their subsequent Control Account Plan (CAP). The most important purpose of WBS is providing a method to extensively delineate and then decompose a project into manageable fragments in an integrated fashion. Level one of WBS framework is known as Control Account Plan (CAP), and integrates technical scope, budget and schedule up to the lowest level of a WBS structure. Definition of CAPs is necessary because its aggregation will constitute the total project, being the lowest point at which performance will be attained (FLEMING and KOPPELMAN, 1999a).
6
2.3.1.1. Define Scope
The first step in scope management is broadly defining the project’s scope through the process of developing a description of the project and its major deliverables. The concept of CAP introduced by Fleming and Koppelman is clarified here, as a tool to facilitate scope characterization. (FLEMING and KOPPELMAN, 1999a)
Given that a project has several components within various levels, management control points needs to be set for work package control. These points are called CAP. A CAP is a building block of EVM, a point where project performance will be monitored. The essence of the CAP is to group sequential and homogenous work elements making them manageable (MILOSEVIC and KNOVEL, 2003). The desire result is to focus project manager’s attention on fewer but more vital points of their projects making EVM easier to use and more time-efficient. Figure 2 illustrates the CAP concept in EVM (FLEMING and KOPPELMAN, 1999a).
Figure 2 – CAP concept in EVM [adapted from (FLEMING and KOPPELMAN, 1999a)]
2.3.1.2. Create Work Breakdown Structure (WBS)
A WBS framework is used to outline work definition and allocation of resources into a project schedule for performance. The Project Management Institute defines Work Breakdown Structure as (PROJECT MANAGEMENT, 2004): “a work breakdown structure is a deliverable-oriented grouping
of project elements that organizes and defines the total scope of the project: work not in the WBS is outside the scope project. As with the scope statement, the WBS is often used to develop or confirm a common understanding of project scope. Each descending level represents an increasingly detailed description of the project elements.” Figure 3 illustrates an example of an WBS.
Achieving a WBS framework underlies the decomposition of major components within a project’s scope into manageable work elements, defined in sufficient detail, capable of supporting forthcoming actions such as project planning, executing and monitoring. Judge whether cost and duration estimates can be established for each work element, at the current level of detail – decomposition of an element that will be produced further down the project’s direction, might not be adequate estimated on the current phase.
Breaking down a project into a WBS, helps organize work and it creates a framework from which management of a project can be fully accommodated. WBS facilitates project team members while organizing work into small deliverables that can be manageable and accounted for when it comes to measuring performance(MILOSEVIC and KNOVEL, 2003).
Figure 3 – WBS example [extracted from (PROJECT MANAGEMENT, 2004)]
However, creating a WBS structure may also become a liability, with excessive work required from project’s team members while generating new hierarchical trees to help in project monitoring. Large WBS may cause time-consuming and resource-wasting efforts, later in the project (MILOSEVIC and KNOVEL, 2003). WBS templates may be used to increase productivity, while every project is unique, WBSs can often be reused since project’s within a given company will resemble another project to some extent having similar or the same project life cycles enabling decomposition into similar or the same deliverables required from each stage (PROJECT MANAGEMENT, 2004).
2.3.1.3. Control Scope
During project execution, is necessary to overview control points and check whether work being performed is within the approved scope and instate changes if needed. EVM, by being a project performance measurement technique also helps in keeping the project under the previously defined scope baseline if necessary.
2.3.2.TIME MANAGEMENT
Management processes that lead up to the timely project completion. Activity definition, finding precedence relations to those same activities, allocation of resources to such activities, estimation of duration, are all processes within time management.
2.3.2.1. Project Schedule Developing
Defining a baseline of schedule where activities are defined sequenced and with allocated resources is the first step in time management of a project. A number of techniques is available to enable schedule developing. Common techniques used in the construction industry are, the critical path method (CPM), program evaluation and review technique, (PERT) or Gantt charts, etc.
8
All these techniques are focused on time oriented objectives and network diagrams when activity durations and precedence relations are known and deterministic. For further reading on the subject see
Total Project Management (RITZ, 1993). Figure 4 illustrates examples of several project schedules
formats.
2.3.2.2. Control Schedule
One of the techniques used to measure schedule performance is EVM. The method helps project manager’s in quickly assessing the magnitude of schedule variations. Crucial to project schedule control is to evaluate whether schedule variation requires corrective action, for example a large delay on an activity not part of the critical path may have a small effect on the global project schedule whilst a smaller delay on a critical activity may depend upon prompt action.(PROJECT MANAGEMENT, 2004)
Schedule performance is assessed by correlating the EV to the PV. This can be achieved by computing the variances, the variances percentages, the performance indices and the forecasting parameters at the desired levels of the WBS (ANBARI, 2003). Over the next paragraphs the analysis parameters for time management in EVM will be examined.
Variance Analysis
Schedule variation calculations are generally based on project-to-date data and assess the magnitude of variation to the original schedule baseline. The following formulas are used to calculate both the time variance and the time variance percentage (ANBARI, 2003, PROJECT MANAGEMENT, 2004). The schedule variance (SV) and the schedule variance percent (SV%) are both “measures of the
conformance of actual progress to the schedule” with the following formulas:
PV
EV
SV
=
−
(2) And, PV SV SV%= (3)In both formulas, a 0 value indicates that project performance is in accordance with the baseline. A positive value indicates good performance, and a negative value indicates poor performance.
Performance Indices
The variance indicators can be translated into efficiency indices to reflect schedule performance of any project. The indices are effective for evaluating project status and providing a basis for estimating schedule outcome (PROJECT MANAGEMENT, 2004).
According to Anbari, the schedule performance index (SPI) is a “measure of the conformance of
actual progress to the schedule” with the following formula:
PV EV
SPI= (4)
In the above formula, 1,00 indicates that project performance is in accordance with the baseline and at an efficient rate. A value above 1,00 indicates a highly efficient performance, less than 1, 00 indicates poor schedule performance.
Forecasting Parameters
Forecasting and predicting future outcomes in project management is crucial. The EVM technique incorporates in its methodology forecasting parameters, based on actual project performance and, capable of calculating time of project at completion. Even though EVM has not been extensively used to estimate total time at completion, according to Anbari and using logic similarity of other forecasting parameters in the EVM method, several formulas were achieved. Time estimate at completion (TEAC) and time variance at completion (TVAC) can be calculated based on the time-phased budget, the DAC and the project’s performance indicators. (ANBARI, 2003). Again according to Anbari (ANBARI, 2003), following the assumptions made on future project performance and related to the EAC estimates, as explained in section 2.4.3.3., TEAC estimates are calculated according to the following formulas:
TEAC1 – when current analysis describe previous project performance, as a not good predictor
of future project performance, implying that past problems affecting the project will not intervene in future performance, TEAC is calculated according to the equation 5,
PVRate SV DAC
TEAC1 = − (5)
TEAC2 - when current analysis describe previous project performance, is a good predictor of
future project performance, implying that past problems affecting project schedule will intervene in future performance, TEAC is calculated, using the schedule efficiency ratio, SPI,
SPI DAC
TEAC2 = (6)
Another forecasting parameter, the time variance at completion, TVAC, gives an indication of the estimated time frame to which the project will be complete ahead or behind schedule.
TEAC
DAC
TVAC
=
−
(7)In the above formula, a value below 0 indicates that the project will finish ahead of schedule; a value equal to 0 indicates that the project will be complete according to schedule; finally a value above 0 will indicate that the project will be complete behind schedule.
2.3.3.COST MANAGEMENT
Management processes that lead up to project completion within the previously approved budget. Those processes being, the ones involved in estimating, budgeting, and controlling costs, and will be briefly overviewed within the appropriate context on the section below.
2.3.3.1. Estimate Cost
Processes involving the calculation of the quantities of various work activities and their respective allocated resources. Detailed estimates, are usually prepared using either the unit quantity method or the total quantity method. For further reading on this subject please Total Project Management (RITZ, 1993).The sum of estimated costs assigned to each activity or work package is the funds authorized to execute the project, hence the budget.
2.3.3.3. Control Cost
Status monitoring of the project, is keeping the project on track according to the authorized budget. Cost control also involves keeping track of what is being spent and the amount of work that is being physically executed. Comparing previously assign project funds and project expenditures is key for
10
not only to the cost control process but the success of the entire management process. And this is where once again, EVM comes in. Cost performance is assessed by correlating the EV to the AC, essentially cost performance parameters express how much is being spent on turning PV into EV. Thus, it can be achieved by computing the variances, the variances percentages, the performance indices and the forecasting parameters at the desired levels of the WBS (ANBARI, 2003). Over the next paragraphs the analysis parameters for time management in EVM will be examined.
Variance Analysis
Cost variation calculations are generally based on project-to-date data and assess the magnitude of variation to the original cost baseline. The following formulas are used to calculate both the cost variance and the cost variance percentage (ANBARI, 2003, PROJECT MANAGEMENT, 2004). According to Anbari (ANBARI, 2003), the schedule variance (CV) and the schedule variance percent (CV%) are both “measures of the budgetary conformance of actual cost of work performed” with the following formulas:
AC
EV
CV
=
−
(8) And, EV CV CV%= (9)In both formulas, a 0 value indicates that project performance is in accordance with the baseline. A positive value indicates good performance, and a negative value indicates poor performance.
Performance Indices
The variance indicators can be translated into efficiency indices to reflect cost performance of any project, in a report overview. The indices are effective for evaluating project status and providing a basis for estimating cost outcome (PROJECT MANAGEMENT, 2004).
According to Anbari, the cost performance index (CPI) is a “measure of the budgetary conformance of
actual cost of work performed” with the following formula:
AC EV
CPI = (10)
In the above formula, 1,00 indicates that project performance is in accordance with the baseline and efficient. A value above 1,00 indicates a highly efficient performance, less than 1, 00 indicates poor inefficient schedule performance.
The CPI is characterized by The PMBOK® Guide (PROJECT MANAGEMENT, 2004) as “the most critical EVM metric” measuring cost efficiency ratio for the work already completed.
Forecasting Parameters
Work planning is mainly concerned with decision making affecting future performance. Thus, projections on what will happen are extremely important. EVM method has the ability to forecast both cost and time of the project at completion, using actual performance data, from roughly start to finish of a project. Time forecasting parameters were overviewed on section 2.4.2.2. Below, will be reviewed the cost forecasting parameters, starting with the estimate at completion, EAC and going from there.
EAC and estimate to complete, ETC (the original budget for the remaining work) rates, may vary according to assumptions made on future project performance, the PMBOK® GUIDE (PROJECT MANAGEMENT, 2004) gives project teams, a range of three estimates to choose from, according to adequate project criteria:
EAC1 and ETC1 – when current analysis describe previous project performance, as a not good
predictor of future project performance, implying that past problems affecting the project will not intervene in future performance, EAC and ETC are calculated according to the equations 11 and 12, EV BAC AC EAC1 = + − (11) And, EV BAC ETC1 = − (12)
EAC2 and ETC2 - when current analysis describe previous project performance, is a good
predictor of future project performance, implying that past problems affecting the project will intervene in future performance, EAC and ETC are calculated according to the equations 13 and 14, CPI BAC EAC2 = (13) And, EV EAC ETC2 = 2− (14)
EAC3 and ETC3 – also with past performance intervening in future behavior but this time also
incorporating schedule efficiency rate up to this point, the schedule performance index or SPI, (on section 2.4.2.2, equation 4,) , EAC and ETC are calculated according to the equations 15 and 16, SPI CPI EV BAC AC EAC ⋅ − + = 3 (15) And,
EV
EAC
ETC
3=
3−
(16)The variance at completion, VAC, gives an indication, of estimate cost overrun or underrun, at project at completion. VAC is given by the above formula:
EAC
BAC
12
In the above formula, a value below 0 indicates that the project will experience a cost overrun; a value equal to 0 indicates that the project will be completed according to budget, finally a value above 0 indicates a project underrun.
Another useful forecasting parameter of the EVM method for cost control is the to-complete performance index, TCPI, giving project managers a cost efficiency rate that needs to be met in order to accomplish certain goals. TCPI is given by the formulas below,
TCPI1 – cost efficiency rate necessary in order to meet the BAC
AC BAC EV BAC TCPI − − = 1 (18)
TCPI2 – cost efficiency rate necessary in order to meet EAC
AC EAC EV BAC TCPI − − = 2 (19)
2.4.THE EVMMETHOD PUT TO GOOD USE –PERFORMANCE REPORTING
Fleming and Koppelman (FLEMING and KOPPELMAN, 1999a), on their extensive EVM research studies, have identified the method’s enabling characteristics of channeling a single integrated management control system to all the projects within an organization. Easiness, of use once the method was employed was also related to the method. When the methods outputs were generally available to the management teams, a sound basis for only calling for attention if corrective action was needed is another advantage of a successfully employed EVM method within an organization. Performance reporting associated with the method, displaying only needed information, in form of graphical displays or color schemed thresholds is an effective way, of using the technique methodology within the information busy industry like the construction sector (ANBARI, 2003). The Project Management Institute explains the concept of performance reporting (PROJECT MANAGEMENT, 2004): “performance reporting involves collecting and disseminating performance
information in order to provide stakeholders with information about how resources are being used to achieve project objectives.”
Figure 5 – Illustrative integrated project management approach of the EVM method [extracted from (FLEMING and KOPPELMAN, 1999b)]
The information contained in those reports can be computed through several tools and techniques, one example being the EVM method. It uses status parameters in graphical displays of EV, AC and PV of the project, it uses variances and performance indices to report progress, and finally it can also compute accurate forecasting parameters of future project’s performance. This capacity of the EVM to provide accurate data to clarify performance information will be discussed over the next paragraphs. Figure 5 tries to illustrate the integrated project management approach briefly described here.
Status reporting is describing where the project stands at the current date. EVM metrics and their graphical displays using S-curves can be used to give immediate update on project’s current situation, giving managers the possibility to assert if corrective measures need to be put into place (FLEMING and KOPPELMAN, 1998). Easy to read information of EVM on the three areas of management, is a quick and effective way to know whether the project is on track.
To achieve EV and AC values, is important to synchronize data and gather all information on invoices, and percentages of work complete (ANBARI, 2003). Graphical displays of how work is progressing let management teams know whether any micromanagement decision making have affected the course of time and cost of the project. Figure 6 illustrates an example of an EVM graphical display.
Figure 6 – Illustrative status graphical display [extracted from (PROJECT MANAGEMENT, 2004)]
As an example Anbari (ANBARI, 2003), exemplifies the “traffic light approach”, by using meaningful thresholds to the company, project performance can be highlighted through the use of graphical displays with assigned colors according to performance ranges and critical limits, as is illustrated in Figure 7. According to Anbari (ANBARI, 2003), it helps ensure, that when decision making is needed it is highlighted, minimizing tampering and micromanagement. He also proposed a new parameter capable of characterize project health according to both schedule and cost, the critical ratio, CR, given by the formula:
CPI SPI
CR = ⋅ (20)
14
Another valuable indicator of trends in performance reporting, are graphs of EAC or TEAC over time. The impact of any corrective actions is clearly reviewed. Figure 8 illustrates a graphical display of EAC evolution over time.
Figure 8 – EAC graph over time [extracted from (ANBARI, 2003)] 2.5.THE SIGNIFICANT ADDITION OF EVM TO CONSTRUCTION PROJECTS
Both Project Management and Construction are challenging subjects, combining the two only makes matters worse (MARSHALL, 2007). Costs overruns of 25 to 33 percent are not uncommon in the industry (PRIEST, 2004) . Construction projects ending in either dispute or litigation have been increasing (LEVIN, 1998). Considering the amount of information about under-performing projects, or common talks about troubled projects in the workplace, construction project managers need effective tools to monitor work progress in order to meet escalating challenges (MARSHALL, 2007). Over the next paragraphs the EVM contribution to effective work progress management in construction will be critically reviewed.
Regarding literature on the subject, Marshall (MARSHALL, 2007) states there are three kinds of knowledge on the contribution of EVM to project success. First, ‘propositional’ knowledge research, while logical and meaningful, they are limited to providing theoretical beliefs and assertions: Works of such type (ANBARI, 2003, CHRISTENSEN, 1998, FLEMING and KOPPELMAN, 1998) suggest EVM benefits are felt across all project management stages from planning to monitor. Second, knowledge contribution, ‘experiential accounts of project practitioners’, unlike propositional knowledge such research offers empirical evidence of clear contribution of the method towards project success in more than one management stages, based on personal experience and observations. Third and final, ‘research-oriented’ work, relying on qualitative methods to make relevant points, they emphasize EVM contribution to project planning and project control (BENJAORAN, 2009, CHOU [et al.], 2010). Thus, Marshall (MARSHALL, 2007) concluded, EVM contributes to:
project planning;
to project control, but perhaps more or less so than planning;
to project management processes that are believed to positively affect project performance. Another basic utility of EVM is containing cost risk associated with projects. From the owner’s point of view reassuring the level of acceptable cost risks, on contracted efforts, while the project is under execution is necessary to lead to success. The literature review on the benefits of EVM to work monitoring will be focused on fixed-price type of contracts for linear construction projects from the owner’s point of view since it will be needed while designing a tool applicable to the case study organization line of work, for further analysis on other type of contracts or non-repetitive projects refer to adequate literature such as the ones by author Quentin W. Fleming (FLEMING and KOPPELMAN, 2002).
Mitigating risks on non-repetitive projects, due to their unique nature, using EVM might be a challenge even to the most dedicated project management team. Not an impossible task, since most construction projects fit the characteristics where EVM is applicable (clearly defined objective, high labor content, formalized management structure, cost and time limitations, etc). Formal assessment of work complete might be challenging at first, whereas repetitive projects such as highways, tunnels, storm water systems, sewage systems and pipeline networks might be easier due to their nature, where activities are repeatedly performed from unit to unit, work complete can be easily measures upon work package completion (EL-RAYES and HYARI, 2004, WEBB, 2003).
On horizontal repetitive projects, also called linear projects according to their linear nature of geometrical layout, project progress is measured in terms of horizontal length, i.e. number of work activities completed one after another linearly. Since a horizontal repetitive project has a clearly defined baseline of work packages, most of the basic data needed to perform EVM might be already available on such construction jobs, diminishing the hurdle related to employing a tool or technique from scratch. Work planning and decision making practices, for the class of projects where significant work repetitions are necessary, as is the case with the construction projects promoted by the case study company, pipeline networks or sewage systems, include maximizing the efficiency of resource usage by ensuring continuous, non-interrupted work for all construction crews and it also includes minimizing construction duration to reduce service disruption time during execution. Endowing work continuity, improves overall productivity, by minimizing idle time during frequent movements on site, and also maximizes benefits from learning curve effects. However, research studies indicate that tolerating interruptions of work by constructions crews can lead to shorter project durations. Besides, long disruption times, or having many construction crews working at the same time on the same construction site can cause discontent from several stakeholders, especially if the project is targeted to an urban area (EL-RAYES and HYARI, 2004). Strike a happy medium, when it comes to these conflict objectives is a challenging task and it also requires a strong basis for decision making, this where the EVM method comes into play.
Under a fixed-priced arrangement, the contractors are usually given progress payments based on percentage of work complete, together with what was agreed on the contract, and even though the terminology might not be present this is basic use of EVM. Situations were owners overpay contractors should be avoided since it’s the quickest way to increase the risks. Closely monitoring the physical percentage of work accomplished by the contractors should be the main focus on progress payments arrangements. EVM can mitigate the process.
After analyzing statistical data, Marshall (MARSHALL, 2007), investigated the direct relationship between EVM mechanisms, such as WBS or S-curves, with project success, he also investigated the relationship between EVM use and success in two different types of contracted efforts, fixed-priced and cost-plus. His findings reinsure what has been said by other authors when it comes to EVM conducting projects towards success. Higher the risk associated with the project the more likelihood the project has to benefit from the EVM employment nevertheless lower risk projects such as fixed-priced when compared with cost-plus, will also benefit from a monitoring technique such as EVM while at execution phase.
On the other hand when prices are fixed, performance is more at risk, thus the use of EVM in payment planning in such contracted efforts both incentivizes performance and guarantees work accomplishment, mitigating performance risk. In order to accurately structure payments a PV needs to be established, methods like Schedule of Values or Critical path Method (CPM) could be employed. A time-phase budget baseline comes from the financial schedule submitted by the contractor and approved by the owner; against such baseline project performance can be measured. Unlike cost-plus
16
contracts, the fixed-priced contracts focus more on schedule compliance, and work accomplishment by the contractor, than on cost mitigation, since the agreed BAC will be what will be paid to the contractor at completion, overlooking contractor price margins, or overheads.
EVM will help owners in scheduling their payments to the contractor monthly and without putting themselves at risk by overpaying the contractor, with EV values being always what is paid to the contractor monthly since is the sum of the physical work complete on site. Even though, payments always need to follow contract agreements and not always there is the situation where the owner pays exactly what he has measured in EV. And, this leads to the problem of the fixed-priced type of contracts and the EVM, not always the AC values are available, because from an owner’s perspective the payments are schedule to have a monthly time frame (FLEMING and KOPPELMAN, 2002). Thus, the problem is in between months there is no AC data available, which prevents important project performance measurements such as CPI. And this is a setback resulting from using EVM in some construction scenarios. In most situations, regardless of terminology it is a cohesive basis for quick decision making in work planning (MARSHALL, 2007).
Another issue related to using EVM to control construction projects and work execution is the ability to incorporate changes to the baseline when project is undergoing. Occasionally, might be necessary to include scope changes, or perhaps project management decides the agreed schedule or budget no longer are adequate with the work being executed, so a change in project baseline is needed and this to be relocated with the EVM method. Different ways to overcome the issue strongly vary from case to case, relies on project management judgment, goals and aims (PROJECT MANAGEMENT, 2004). Overall, it might be added that EVM method is adequate for work planning decision making.
3
COLLABORATIVE TOOLS
3.1.TO CONSTRUCT IS TO COLLABORATE
Extensive cooperation is required from several organizations when undertaking a project in the construction industry. Unique characteristics of the sector make each project unique, bringing to the table a number of stakeholders, which need to cooperate at different levels of the project lifecycle regardless of their individual practices, resources and aims (HARTY, 2005, XUE [et al.], 2012). While analyzing those unique characteristics each construction project can be seen as a multidisciplinary organization which may or may not continue to collaborate once the project is completed. The transitory nature of the sector and its largely documented fragmentation add to an already complex industry, with low profitability when compared with many other industry sectors (KANAPECKIENE [et al.], 2010).
Another challenge to practitioners is, and part of any cooperative work is the large amount of information circulating among the various stakeholders involved while undertaking a project, making construction an information intense industry. Both fragmentation and high level of information sharing make effective work planning in construction a very difficult task to carry out resulting in poor efficiency of the process (DAVE and KOSKELA, 2009).
Within this context, integrating not only information management tools, but bringing knowledge management concepts into the already existing collaborative platforms of an organization, all within a web-based context. Following that path might enhance work planning and multidisciplinary action, consequently transforming the management of their construction projects (NIKAS [et al.], 2007). Over this chapter all the concepts above will be discussed through an extensive literature review on the subject matters.
3.2.UNDERSTANDING THE VALUE OF COLLABORATIVE TECHNOLOGIES IN CONSTRUCTION 3.2.1.WHAT IS A COLLABORATIVE TECHNOLOGY?
Team work in construction has existed long since. Across times, the collaborative approach to construction has taken several formats from social knowledge and information transfer to paper-based workflow systems (DAVE and KOSKELA, 2009). The Oxford Advanced Learner’s Dictionary defines technology as ‘scientific knowledge used in practical ways in industry’ which is quoted here to help define the meaning of a collaborative technology in construction. Concerns on information management and explicit knowledge transfer in work practices have led to the automation of common operations. Thus, such tools function as the backbone of the information infrastructure for coordinating project activities, and has the definition quoted above states, enable practicality and give support to teamwork processes (MARTINS, 2009, NIKAS [et al.], 2007).
Collaboration technologies, as defined by Nikas et al, ‘include, at a minimum, a virtual workplace that
provides a repository recording of the process of the group, electronic information-sharing (such as though file sharing, email, audio-video conference and electronic whiteboards), meta-information on the entries in the repository (such as date, sequence, and author of each contribution), and easy
18
access and retrieval, form the repository’. Advantages found include, easy access, creation,
processing, storage, retrieval, distribution and analysis of data with no boundaries of physical location and time, providing a basis for cooperation between geographically disperse organizations (DAVE and KOSKELA, 2009).
The Internet is the key technology among all IT applications for collaborative working in construction. Corporate intranets and collaborative extranets enable relevant information sharing on a web based platform, taking form of an important collaborative knowledge sharing technology in most organizations as a virtual workplace. Such corporate structures store company information such as contact lists, standards forms and databases, company news, procedure manuals, organizations maps, WBS, financial data, procurement databases, project related information, etc. (DAVE and KOSKELA, 2009). In his 2006 research paper van Leuween and Fridqvist (VAN LEEUWEN and FRIDQVIST, 2006), subdivided the current practice of computer support collaborative work in centralized project databases, systems for workflow management, and electronic document management. Problems related to such systems were also studied, describing the centralized data systems as isolated from business processes, and also stating that tools for document management in organizations lack in consistency of information and have redundantly repeated data in several documents compromising information transfer throughout the project’s life cycle.
Xue et al. (XUE [et al.], 2012) argued in their research with the retrieval of 83 papers form well known construction journals, indicating that several collaborative technologies have been widely investigated by many scholars from different construction standpoints. Such systems have been applied to different stages of a project cycle and to different organizational levels to ease collaborative work in A/E/C firms. Various summarized examples include: Internet-based systems, wireless technologies, artificial intelligence such as intelligent agent, and virtual inter-organizational systems. The rapid development of IT technologies experienced over the last decade has boosted the advancement of such applications in collaborative work in construction projects. They also proposed a subdivision on the main focuses areas of collaborative IT application in construction work, that being: collaborative design, integrated inter-organizational management systems, and collaborative construction project management.
3.2.2.THE RELATIONSHIP BETWEEN IT AND THE CONSTRUCTION INDUSTRY
Information Technology adoption in the construction industry is now and in most cases a routinely used tool and is seen as a problem solving mechanism of the observed fragmentation concerns. As documented, the adoption of such mechanisms improves coordination and collaboration between parties taking part in a construction project, leading to better communication procedures. Its benefits include improving document quality and diminishing of documentation errors, enhancing speed of work and data access, increasing capacity of financial control, overall better information and communication management, simplifying many stages of the construction life-cycle process when successfully instated. (NITITHAMYONG and SKIBNIEWSKI, 2004)
Architecture/Engineering/Construction (A/E/C) firms have seen a growth, over the last decade, in IT spending, (NITITHAMYONG and SKIBNIEWSKI, 2004) indicating that organizations have raised their interest in such systems to ease construction projects. The use and its related time-frame for collaborative IT tools adoption could be explained using Geoffrey Moore’s technology adoption curve, adapted to the domain of the construction industry, as seen in Figure. 9. The year 1998, has seen a major breakthrough on the initiation of generalized use of computer supported applications in the industry. Between the same year and 2001, innovators and early adopters tested those applications and found them to bring significant benefits into their projects. Well known construction companies
started to adopt these applications from 2002 to 2003 on their major projects pushing them out to their business partners. From 2004, these applications have seen a wide spread with its adoption by small and medium A/E/C firms, after seeing their benefits on other business companies. Such firms have implemented to some extend these applications in the majority of their projects. Small and medium A/E/C firms can be regarded as the late majority within the technology adoption curve. (NITITHAMYONG and SKIBNIEWSKI, 2004)
Figure 9 – The technology adoption curve [extracted from (NITITHAMYONG and SKIBNIEWSKI, 2004)]
Practitioners from several professions within construction have experience a number of pressures (DAVE and KOSKELA, 2009). Such pressures indicate a demand in higher productivity from firms and their employees within the multidisciplinary context of the practice. Professionals have been asked to lower lead-time, to lower defects, to lower costs, to reduce environmental impact in order to increase productivity and client satisfaction. Additionally, there are pressures to refine communication among co-workers and to establish accuracy in tools and procedures. The combination of these pressures culminates in the higher usage, by professionals to some extent, of computer supported applications to ease such shears, causing IT spending to observe such growth over the last decade. (GARNER and MANN, 2003)
Figure 10 – IT Related Process Innovation in 18 industries [extracted from (W@ATCH, 2010)]
It has also been debated over the years that the construction industry has been relatively slow in adopting the innovative solutions offered by the developments in the IT sector. The construction
20
industry has always maintained a skeptical view of the IT offerings, while other industries, such as automobile and manufacturing, have successfully used IT to improve the efficiency of its processes. However in the last decade the construction industry has made significant efforts to embrace IT solutions (DAVE and KOSKELA, 2009). Figure 10 illustrates how construction by 2010 is still far behind many industries when it comes to IT related process innovation (W@ATCH, 2010).
3.2.3.WHY THEY MIGHT BE THE SOLUTION ORGANIZATIONS ARE LOOKING FOR
New challenges faced by project management teams in construction have prompted companies to seek new solutions in order to regain competiveness. Finding the organizational asset that might keep the company ahead of the competition has proven to be effective if mastered properly. Most of the pressures discussed earlier result of critical mistakes that keep being made project after project. It has been argued over the years, that work planning in construction must require a backbone structure made of both explicit and tacit knowledge to support decision making. Regarding such, during the last decade, the construction industry has taken a step forward embracing the concept of managing construction projects using web-based techniques. Given the nature of collaborative systems they seem the most appropriate solution to identify, capture, process and share the knowledge gathered during a construction project, providing companies competitive advantage if used effectively (DAVE and KOSKELA, 2009, KANAPECKIENE [et al.], 2010, NIKAS [et al.], 2007).
Quoted advantages of online collaborations tools, by Nikas et al. (NIKAS [et al.], 2007) include: ‘can
facilitate easier management of construction projects, easier access to project information from anywhere at any time, faster transaction time, better transparency in the exchange of project information, savings on project cost, and streamlined construction business processes.’ Benefits from
collaboration tools as a form of an information infrastructure might include automational, informational or transformational effects of both operational and management processes, if approached as a sociotechnical system where people, systems and processes form ‘culture bed’ for it. Thus, with this novel system adoption every component of the human and technological infrastructure of organizations might be affected in a positive way if done accordingly (MARSH and FLANAGAN, 2000, NIKAS [et al.], 2007).
Approaching construction and its future and present collaboration tools from a knowledge management point of view might help on identifying potential benefits for the lifecycle of projects. The unique and dynamic nature of construction projects and their lifecycle pose many opportunities to capture information in the form of knowledge. If this valuable information can somehow be captured, processed and reused for future decision making, it will reduce the waste caused by repeated critical mistakes and improve the process efficiency in general. Although, heavy fragmentation of the industry as a whole makes the knowledge capture process seem utopian, and as a result valuable knowledge is being lost. With the increasing options available to organizations to apply tailored solutions of collaborative knowledge management tools, the process might no longer be seen as utopian but as the strategy to be adopted (DAVE and KOSKELA, 2009, KANAPECKIENE [et al.], 2010). With their research Dave and Koskela identified some key benefits of collaborative knowledge management strategies of applied accordingly to the construction industry:
‘Enable knowledge transfer’ - construction project lifecycle’s require knowledge to flow through various stages, from requirements capture to design, from design to procurement, from procurement to construction and so on, using a collaborative toll to manage knowledge transfer across various stages of a project facilitating smooth transaction between processes. ‘Capture and reuse project knowledge’ – it has been argued over the years that the industry fails to retain project knowledge for future reuse, regardless of the factors leading to such
![Figure 2 – CAP concept in EVM [adapted from (FLEMING and KOPPELMAN, 1999a)]](https://thumb-eu.123doks.com/thumbv2/123dok_br/15705912.1068115/23.892.258.603.433.675/figure-cap-concept-evm-adapted-fleming-koppelman-a.webp)
![Figure 3 – WBS example [extracted from (PROJECT MANAGEMENT, 2004)]](https://thumb-eu.123doks.com/thumbv2/123dok_br/15705912.1068115/24.892.350.587.128.339/figure-wbs-example-extracted-project-management.webp)
![Figure 5 – Illustrative integrated project management approach of the EVM method [extracted from (FLEMING and KOPPELMAN, 1999b)]](https://thumb-eu.123doks.com/thumbv2/123dok_br/15705912.1068115/29.892.370.483.769.1065/figure-illustrative-integrated-management-approach-extracted-fleming-koppelman.webp)

![Figure 10 – IT Related Process Innovation in 18 industries [extracted from (W@ATCH, 2010)]](https://thumb-eu.123doks.com/thumbv2/123dok_br/15705912.1068115/36.892.314.627.701.1046/figure-related-process-innovation-industries-extracted-w-atch.webp)