DIAGNOSTIC NEURORADIOLOGY
Evolution of diffusion tensor imaging parameters after acute
subarachnoid haemorrhage: a prospective cohort study
Isabel Fragata1,2 &Patrícia Canhão3,4&Marta Alves5&Ana Luísa Papoila5&
Nuno Canto-Moreira6
Received: 20 September 2016 / Accepted: 6 December 2016 / Published online: 27 December 2016 # Springer-Verlag Berlin Heidelberg 2016
Abstract
Introduction Few studies assessed diffusion tensor imaging (DTI) changes in the acute phase of subarachnoid haemor-rhage (SAH). We prospectively evaluated DTI parameters in the acute phase of SAH and 8–10 days after and analysed whether changes could be related to SAH severity or to the development of delayed cerebral ischemia (DCI).
Methods Apparent diffusion coefficient (ADC) and fractional anisotropy (FA) changes over time were assessed in a prospec-tive cohort of patients with acute SAH. Two MRI studies were performed at <72 h (MRI-1) and 8–10 days (MRI-2). DTI parameters were recorded in 15 ROIs. Linear mixed regres-sion models were used.
Results Forty-two patients were included. Subtle changes in DTI parameters were found between MRI-1 and MRI-2. At the posterior limb of internal capsule (PLIC), a weak evidence of a 0.02 mean increase in FA (p = 0.064) and a 17.55 × 10⁻⁶mm2/s decrease in ADC (p = 0.052) were found in MRI-2. Both FA and ADC changed over time at the
cerebellum (increase of 0.03; p = 0.017; decrease of 34.73 × 10⁻⁶mm2/s; p = 0.002, respectively). Patients with DCI had lower FA values on 1 and lower ADC on MRI-2, although not reaching statistical significance, compared to non-DCI patients. DTI parameters on MRI-1 were not corre-lated to clinical admission scales.
Conclusion ADC and FA values show subtle changes over time in acute SAH at the PLIC and cerebellum although not statistically associated with the severity of SAH or the occur-rence of DCI. However, DTI changes occurred mainly in DCI patients, suggesting a possible role of DTI as a marker of DCI. Keywords Diffusion tensor imaging . Subarachnoid
haemorrhage . Delayed cerebral ischemia
Background and purpose
Subarachnoid haemorrhage (SAH), usually caused by rupture of intracranial aneurysms, is a devastating clinical condition, with high mortality and morbidity that reaches 50 and 20%, respectively [1,2]. The prognosis after SAH is determined by the initial insult as translated into clinical scales, such as the Hunt and Hess grade, but also by the occurrence of complica-tions like vasospasm and delayed cerebral ischemia (DCI) [1,
3–5]. Besides these well-known factors, the occurrence of early brain injury at the time of haemorrhage is emerging as a leading cause of mortality [2].
Diffusion tensor imaging (DTI) is an MRI technique that uses motion of water molecules to provide two different kinds of information: (a) quantitative information on water move-ment across cellular membranes—diffusion weighted imaging (DWI) including the calculated apparent diffusion coefficient (ADC) and (b) anatomical integrity of white matter tracts based on anisotropic diffusion of water along axons—
* Isabel Fragata
1 Serviço de Neurorradiologia, Centro Hospitalar Lisboa Central,
Hospital São José, Rua José António Serrano, Lisbon 1150-045, Portugal
2
NOVA Medical School, Lisbon, Portugal
3
Department of Neurosciences and Mental Health, Neurology, Hospital de Santa Maria, CHLN, Lisbon, Portugal
4 Faculty of Medicine, University of Lisbon, Lisbon, Portugal 5
Epidemiology and Statistics Unit, Centro Hospitalar Lisboa Central, Lisbon, Portugal
6 Neuroradiology Section, Centre for Imaging and Function,
fractional anisotropy (FA) [6,7]. FA and ADC vary inversely in the brain [8] and represent different physiologic parameters, albeit measured by the same sequence.
When cerebral parenchymal damage occurs in SAH, either due to early brain lesion (cortical spreading depolarization, blood-brain barrier dysfunction and ultimately neuronal cell death) [9,10] or to DCI [11], these changes affect water dif-fusion and anisotropy and may lead to abnormal DWI param-eters. It is known, for instance, that ADC values are affected in white matter not only in the acute [12] but also in the subacute phase of SAH [13].
Regarding FA measurements in SAH patients, however, the literature is scarce, with only a few studies that refer to specific tracts and that studied patients several weeks or months after SAH [14–16].
In our study, we evaluated FA and ADC values in several brain regions during the acute phase of SAH (<72 h, before vasospasm period) and 8–10 days after ictus (during the va-sospasm period), trying to answer the following questions: (1) Do DTI parameters change over time in the acute phase of SAH? and (2) Is there an association of changes in ADC and/ or FA values with DCI and severity of SAH?
Material and methods
PopulationAll patients with acute spontaneous SAH admitted at Centro Hospitalar de Lisboa Central between May 2013 and November 2014 were enrolled in a prospective cohort study. Institutional review board approval was obtained. Inclusion criteria for the main study were as follows: (1) age >18 years, (2) acute non-traumatic SAH diagnosed by CT and/or lumbar puncture, (3) imaging studies performed within the first 72 h of SAH onset and (4) informed consent obtained from patient or legal representative. Patients in a very poor clinical condition (GCS 3), pregnant women, patients with renal insufficiency and patients with any con-traindication to perform MRI or whose time of onset of SAH was unknown were excluded. For the current analy-sis, only patients who underwent sequential MRI within the first 72 h of ictus and at 8–10 days were included. Clinical and imaging data
Demographic data and clinical presentation were collected from the patients’ medical records. Neurological status at ad-mission was evaluated using the Glasgow coma scale (GCS), World Federation of Neurosurgeons scale (WFNS) and Hunt and Hess scale (HH). The amount of blood in brain CT scan was assessed using the modified Fisher scale [17] and the Hijdra scale [18].
Patients were classified as having DCI if (1) they presented with a new focal neurological deficit/decrease in level of con-sciousness not attributable to other causes (e.g., hydrocepha-lus, seizures, metabolic derangement, infection or sedation), (2) there was a new infarct on follow-up CT/MR imaging or (3) both 1 and 2, after 4 days post-ictus [19,20].
DCI and other relevant variables such as the presence of hydrocephalus and surgical/endovascular approach and timing for aneurysm treatment were collected for analysis. Hydrocephalus was defined as a bicaudate index above the 95th percentile for age, occurring at any time between admis-sion and discharge.
MRI protocol
The imaging protocol included two MRI studies: MRI-1 and MRI-2. The first (baseline) was performed on days 0–3 and the second (follow-up) on days 8–11 after SAH. All MRIs were performed on the same 1.5T scanner (Magnetom Avanto; Siemens Medical Systems, Erlangen, Germany). The imaging protocol included T1, T2, T2*, fluid attenuation inversion recovery (FLAIR) and DTI. In the DTI sequence, for each of the 20 non-collinear diffusion-sensitizing gradi-ents, we acquired 84 contiguous slices. Imaging parameters were as follows: matrix = 128 × 128, field of view = 230 mm, TE = 95 ms, TR = 2800, EPI factor = 128, b = 1000 s/mm2, NEX = 1 and 5-mm slice thickness.
Postprocessing
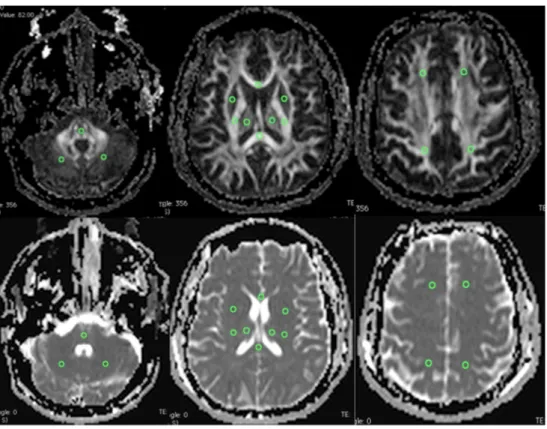
OLEA software (La Ciotat, France) was used to select regions of interest (ROIs) bilaterally and symmetrically (each ROI with 20 mm2) at the following locations: frontal and parietal centrum semiovale, posterior limb of the internal capsule (PLIC), lentiform nucleus, thalamus, genu and splenium of corpus callosum, midpons and subcortical cerebellar hemi-spheres (Fig.1). Mean FA and ADC were measured for each ROI. An average of left and right ROIs for each anatomical location was considered representative, after no significant differences were observed between the two sides. The mean whole-brain FA and ADC were also calculated for each pa-tient. Measurements avoided areas of parenchymal hematoma and ventricular drainage trajectory.
Statistical analysis
The characteristics of study patients were described using the mean (standard deviation) or median (minimum, maximum) for continuous variables and the frequencies (percentages) for categorical variables. To compare FA and ADC ROI values between the left and right hemispheres, Wilcoxon signed rank test was used. Non-parametric Fisher’s exact test and Mann-Whitney test were used, as appropriate.
Correlation between DTI parameters at admission and se-verity of SAH (GCS, HH WFNS and Fisher scale as contin-uous variables) was studied with Spearman correlation coefficient.
Linear mixed effects regression models were used to take into account the correlation structure between measures in time and to explore the association between each DTI param-eter and relevant clinical data. Clinical and imaging scales were dichotomized for regression analysis: Hunt and Hess grades 1, 2 and 3 versus grades 4 and 5; WFNS I, II and III versus IV and V; GCS >8 versus≤8 and Modified Fisher 1, 2 and 3 versus 4.
A level of significanceα = 0.05 was considered. Data were analysed using STATA 13.0 (StataCorp. 2013. Stata Statistical Software: Release 13. StataCorp LP, College Station, TX) and SPSS version 21.
Results
Study sampleOne hundred twenty-nine patients with spontaneous non-traumatic SAH were admitted during the inclusion period. Eighty patients fulfilled the inclusion criteria for the main prospective cohort. For the present study, patients were further excluded if they did not perform brain MRI in two different moments in the course of SAH or if the images were not
readable because of technical reasons. In total, 42 patients were included (Fig.2).
The median age of the patients was 63 years (range 35–86), and 59.5% were female. The median HH grade was 2 (range 1–5), 24 patients were WFNS grade I and 8 patients were WFNS grade IV; only 2 patients had GCS <8 at admission (Table1). In 31 patients, one or more than one aneurysm was diagnosed: 6 were clipped (14.3%) and 26 were coiled (61.9%). Seven patients (16.7%) developed hydrocephalus and 12 patients (28.6%) were considered to have DCI. There were no significant differences between patients with and without DCI regarding age, gender, neurological status at ad-mission, modified Fisher grade or presence of hydrocephalus (Table2).
Evolution of DTI parameters in acute SAH
Whole-brain mean FA and ADC showed no significant differ-ences between baseline and follow-up MRI, as shown in Table3. However, and from the specific ROIs analysed, subtle regional changes in DTI parameters were observed at the pos-terior limb of the internal capsule (PLIC) and subcortical cer-ebellum between the two times of evaluation. Also, a slight mean increase in ADC values at the lentiform nucleus was present on MRI-2 compared with MRI-1 (coefficient estimate 26.05 × 10⁻⁶mm2/s, 95% CI: 2.29, 49.81; p = 0.032), but not in FA values.
Fig. 1 Transverse FA and ADC maps show ROIs that were drawn bilaterally in brain parenchyma. Top and bottom left: ROIs in pons and cerebellar white matter. Top and bottom middle: ROIs in lentiform nucleus, thalamus, PLIC, splenium and genu of corpus callosum. Top and bottom right: ROIs in frontal and parietal centrum semiovale
DTI measurements at the PLIC
The univariable analysis comparing DTI parameters on MRI-1 and MRI-2 showed a weak evidence of a mean increase of 0.02 in FA values (95% CI 0.00, 0.04; p = 0.064) and of a mean decrease of 17.55 × 10⁻⁶mm2/s in ADC values (95% CI −35.27, −0.17; p = 0.052).
Fig. 2 Flow chart demonstrating the number of patients screened and reasons of exclusion in the study
Table 1 Demographic and clinical characteristics of patients enrolled Characteristics
Age (median; range) 63 (35–86) Female gender, n (%) 25 (59.5) Comorbidities, n (%)
Smoking 7 (17)
Hypertension 19 (45)
Diabetes 3 (7)
Clinical grade at admission, n (%) GCS <8 GCS 8–15 2 (4.8) 40 (95.2) WFNS I 24 (57.1) WFNS II 7 (16.7) WFNS III 1 (2.4) WFNS IV 8 (19) WFNS V 2 (4.8)
Hunt & Hess 1 2 3 4 5 15 (35.7) 9 (21.4) 11 (26.2) 5 (11.9) 2 (4.8) Imaging at admission, n (%) Modified Fisher 2 3 4 4 (9.5) 11 (26.2) 27 (64.3) Cisternal Hijdra grade (median; range) 14 (0–26) Ventricular Hijdra grade (median; range) 2 (0–12) Aneurysmal SAH, n (%) 31 (73.8)
Anterior circulation 25 (80.6) Posterior circulation 6 (19.4) Non-aneurysmal SAH, n (%) 11 (26.2%)
Perimesencephalic SAH
Non-aneurysmal non-perimesencephalic SAH
10 (23.8) 1 (2,4)
Table 2 Clinical and demographic characteristics of patients by DCI group
DCI (n = 12) No DCI (n = 30) p value Age (years) 61 (36–84) 64 (35–86) 0.706b Female gender 8 (66.7) 17 (56.7) 0.731a GCS 15 (10–15) 14.5 (4–15) 0.367b WFNS (IV-V) 1 (8.3) 9 (30.0) 0.233a Hydrocephalus 1 (8.3) 6 (20.0) 0.651a Modified Fisher (grade 4) 8 (66.7) 19 (63.3) 1.000a Values are expressed as median and range (minimum–maximum) or n (%)
GCS Glasgow coma scale, WFNS World Federation of Neurosurgeons scale
a
Fisher’s exact test
b
The remaining univariable regression analysis showed that FA changes were not associated with other variables, like age, DCI, severity of SAH, hydrocephalus, aneurysmal versus non-aneurysmal SAH and type of aneurysm treatment (clip/coil) (Table4).
Changes in ADC values were also associated with the pres-ence of hydrocephalus, GCS scale at admission, Fisher grade and surgical treatment of the aneurysm (Table5).
However, no multivariable model was achieved for either FA or ADC.
DTI measurements at the cerebellum
The univariable analysis comparing the DTI parameters ob-tained by MRI-1 and MRI-2 showed a slight mean increase in FA values of 0.03 (95% CI 0.00, 0.05; p = 0.017) and a mean decrease of 34.73 × 10⁻⁶ mm2/s in ADC values (95% CI −56.97, −12.49; p = 0.002). The remaining univariable regres-sion analysis showed that besides time of assessment, FA and ADC values were also associated with the presence of hydro-cephalus (Tables4and5).
Regarding FA, the multivariable analysis showed a mean increase of 0.03 between the two times of evaluation (95% CI 0.01, 0.05; p = 0.017). Regarding ADC, the multivariable analysis showed a mean decrease of 34.73 × 10⁻⁶mm2/s be-tween the two times of evaluation (95% CI−56.97, −12.49; p = 0.002).
Also, patients with hydrocephalus had lower mean FA values (coefficient estimate −0.06; 95% CI −0.09, −0.02; p = 0.001) and higher mean ADC values (coefficient estimate 55.11 × 10⁻⁶mm2/s; 95% CI 15.61, 94.62; p = 0.006).
DTI parameters: relation to SAH severity and DCI
DTI parameters on the first 72 h (MRI-1) were not correlated with clinical scores at admission. However, when clinical and imaging scales were dichotomized, linear regression analysis showed evidence of higher ADC values at the PLIC in pa-tients with GCS >8 and higher ADC values at the cerebellum in patients with WFNS IV and V (Table5).
There were no associations between DTI parameters on the first MRI and amount of blood on CT measured by the mod-ified Fisher scale.
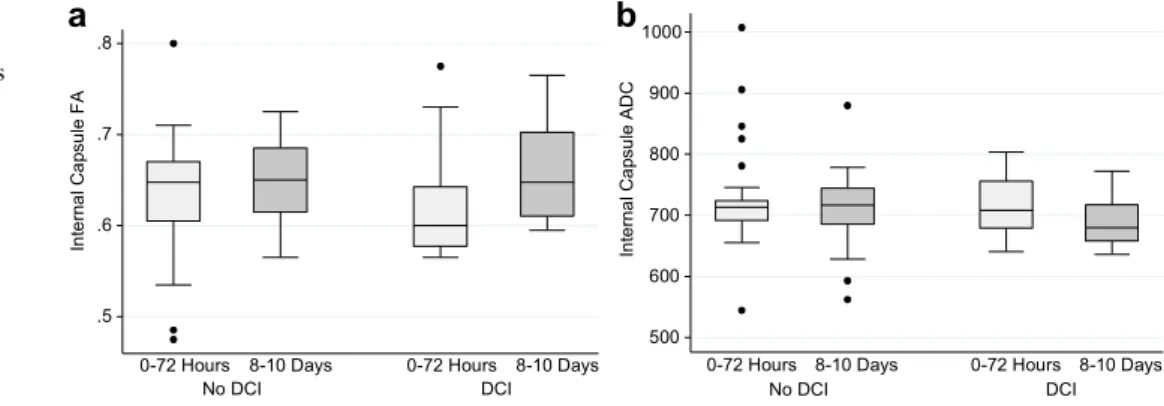
DTI parameters were compared in patients with and with-out DCI (Figs.3and4). Changes in DTI parameters between MRI-1 and MRI-2 seem to have occurred in all patients with DCI. FA in DCI patients (versus non-DCI patients) was lower on the first days of SAH (MRI-1), whilst ADC was lower later in the course of disease (MRI-2), during the vasospasm peri-od, although not reaching statistical significance.
Discussion
In this exploratory study, we tried to assess DTI changes in the acute phase of SAH, as to our knowledge, there are no previ-ous reports regarding this time frame.
We found an increase of FA values in the posterior limb of the internal capsule (PLIC) and in the cerebellum from the acute phase MRI (0–72 h) to the follow-up MRI (8–10 days after SAH) and a parallel decrease of ADC values in the same locations.
The physiopathologic mechanisms of brain injury in acute SAH are still incompletely understood. Delayed cerebral
Table 3 FA and ADC values
obtained at MRI-1 and MRI-2 FA ADC
MRI1 MRI2 p MRI1 MRI2 p
FCSO 0.49 (0.07) 0.48 (0.07) 0.892 704.39 (72.56) 716.87 (53.98) 0.260 PCSO 0.47 (0.07) 0.46 (0.06) 0.469 733.27 (50.57) 735.38 (55.58) 0.826 L 0.21 (0.05) 0.19 (0.05) 0.221 725.23 (68.12) 751.28 (84.36) 0.032 T 0.30 (0.04) 0.30 (0.04) 0.860 813.96 (171.7) 778.62 (81.34) 0.183 PLIC 0.63 (0.07) 0.65 (0.05) 0.064 723.68 (74.12) 706.13 (57.38) 0.052 GSCC 0.69 (0.13) 0.68 (0.13) 0.752 790.03 (134.4) 791.26 (112.6) 0.950 C 0.35 (0.06) 0.38 (0.07) 0.017 706.35 (79.32) 671.62 (46.87) 0.002 P 0.34 (0.11) 0.35 (0.11) 0.844 675.36 (77.51) 673.45 (59.40) 0.871 Whole-brain 0.43 (0.04) 0.44 (0.04) 0.687 734.04 (56.66) 728.08 (42.83) 0.405 Values are expressed as mean (standard deviation); p values were obtained by linear mixed effects regression models
ADC apparent diffusion coefficient, C subcortical cerebellar hemispheres, FA fractional anisotropy, FCSO frontal centrum semiovale, GSCC genu and splenium of corpus callosum, L lentiform nucleus, MRI magnetic resonance imaging, P midpons cerebellar hemispheres, PCSO parietal centrum semiovale, PLIC posterior limb of the internal capsule, T thalamus
ischemia has classically been associated with vasospasm and with the amount of blood present in the subarachnoid space [21,22]. However, the changes in intracranial pressure, auto-regulation, cortical spreading depolarization, blood-brain bar-rier opening and neuronal apoptosis that exist in the first 72 h after rupture lead to early brain injury and also contribute to the occurrence of DCI [23].
As FA values indicate the directionality of water diffusion, and indirectly reflect the integrity of axons, myelin and micro-tubules [,24], it is fair to extrapolate that FA could be a po-tential marker of acute neuronal lesion in SAH patients.
Some reports exist on FA changes in SAH, namely regard-ing the mammillothalamic tract [15], the corticospinal tract [16] and the ascending reticular activating system [14]. However, these reports focused only at the chronic stages of
SAH, thus probably reflecting the late secondary injury to the neuronal tracts and not any acute changes.
ADC values are also derived from diffusion-weighted sequences and represent the diffusion of water molecules across cell membranes. Early ischemia leads to cytotoxic oedema, which is due to a decrease in normal diffusion of water molecules from the intracellular to the extracellular compartment, secondary to energetic failure at the cell membrane [25].
Our analysis showed subtle regional changes in the PLIC and subcortical cerebellum. A previous study in an animal model that focused on DTI changes in the acute phase of SAH [26] found an acute reduction of ADC in the cerebral cortex in the first minutes/hours after SAH, in association with a subsequent depolarization of brain tissue. These changes
Table 5 Univariable regression analysis results for ADC values considering the PLIC and cerebellum locations
PLIC Cerebellum
β-estimate (95%CI) p β-estimate (95%CI) p Agea 7.71 (−3.81,19.24) 0.190 2.47 (−8.10,13.05) 0.647 DCI −15.09 (−54.04,23.86) 0.448 −21.73 (−56.48,13.03) 0.221 HH (grades 4 and 5) −23.84 (−70.82,23.14) 0.320 22.42 (−15.53,60.37) 0.247 WFNS (IV–V) 17.78 (−23.47,59.02) 0.398 40.92 (5.50,76.34) 0.024 GCS (>8) 90.03 (26.87,153.19) 0.005 −9.44 (−71.42,52,53) 0.765 Fisher (grade 4) 31.69 (−4.02,67.40) 0.082 6.99 (−26.28,40.28) 0.680 Hydrocephalus 41.83 (−3.98,87.65) 0.074 55.11 (15.61,94.62) 0.006 Clipped aneurysm −44.48 (−93.28,4.32) 0.074 −4.90 (−50.54,40.74) 0.833 Coiled aneurysm 16.04 (−20.11,52.20) 0.384 −11.08 (−43.81,21.66) 0.507 Aneurysmal SAH −3.08 (−43.36,37.20) 0.881 −4.94 (−41.25,31.38) 0.790 p values obtained by linear mixed effects regression models
ADC apparent diffusion coefficient, CI confidence interval, DCI delayed cerebral ischemia, PLIC posterior limb of the internal capsule
a
For each 10 years increase in age Table 4 Univariable regression
analysis results for FA values considering the PLIC and cerebellum locations
PLIC Cerebellum
β-estimate (95%CI) p β-estimate (95%CI) p Agea 0.01 (−0.01, 0.01) 0.860 0.00 (−0.01, 0.01) 0.915 DCI 0.00 (−0.04, 0.03) 0.817 0.00 (−0.04, 0.03) 0.772 HH (grades 4 and 5) 0.04 (0.00, 0.07) 0.061 −0.02 (−0.05, 0.02) 0.424 WFNS (IV–V) 0.01 (−0.03, 0.04) 0.761 −0.02 (−0.06, 0.01) 0.206 GCS (>8) −0.02 (−0.08, 0.03) 0.415 0.03 (−0.03, 0.08) 0.328 Fisher (grade 4) −0.02 (−0.05, 0.01) 0.227 −0.01 (−0.04, 0.02) 0.494 Hydrocephalus 0.01 (−0.03, 0.05) 0.751 −0.06 (−0.09, −0.02) 0.001 Clipped aneurysm −0.01 (−0.05, 0.03) 0.601 0.00 (−0.04, 0.04) 0.997 Aneurysmal SAH −0.02 (−0.05, 0.02) 0.341 0.02 (−0.01, 0.06) 0.141 p values were obtained by linear mixed effects regression models
CI confidence interval, DCI delayed cerebral ischemia, FA Fractional Anisotropy, PLIC posterior limb of the internal capsule
a
were attributed to acute vasospasm, related to the affected arterial territory.
Another study that analysed ADC values in the subacute stage of SAH [13], in comparison to normal controls, found a global increase in ADC values affecting both white and grey matter. This seems to contradict our results, but there are fun-damental differences in study design that might explain this discrepancy in findings, as no measurements of the internal capsule were taken, and patients with vasospasm were exclud-ed. However, the increase of ADC at the lentiform nucleus in our cohort of patients, at the follow-up MRI, is in line with the changes described by Liu et al. in the subacute phase.
The particular engagement of the PLIC that we found is not surprising, as this is a sensible area that incorporates major motor and sensory pathways to and from the cortex and the spinal cord, as well as fibres from the thalamus connecting to most regions of the cortex. Indeed, the impact that FA and ADC values in this region have on outcome after ischemic injuries has been extensively described in neonates [27,28].
Likewise, the cerebellum is particularly sensitive to ische-mia, even if it seldom reflects on CT or MR imaging. Involvement of the cerebellum in ischemic lesions secondary to DCI has been described in a few studies [29–31], affecting up to 20% of patients [32]. However, DTI changes observed the cerebellum of patients with SAH do not appear to be related the location of the ruptured aneurysm and more prob-ably reflect a global parenchymal insult.
Changes found in DTI parameters in our study population could therefore reflect different physiopathologic mecha-nisms, either due to the initial insult or to the complications developing during the first days after SAH: hydrocephalus, vasospasm or treatment-induced lesions.
The modification of FA and ADC along time appears to occur mainly in the group of patients that developed DCI, so we question whether these MRI parameters could be used as biomarkers of DCI, even if the real significance and impact on outcome remains to be addressed in larger studies. It is also of note that in patients with DCI, these changes in FA (when comparing with non-DCI patients’ values) appear to have oc-curred on the first days of SAH, whilst changes in ADC were more visible only later in the course of disease, during the vasospasm period, although these results did not reach statis-tical significance in this small cohort. We realize that our find-ings may reflect different mechanisms occurring at separate times in the acute course of SAH. The changes in FA that exist early in the course of SAH possibly reflect the cascade of events in early brain injury. The lower ADC values that occur in the vasospasm time window might be related to late ische-mia, secondary to vasospasm.
We recognize limitations to our study that are worth discussing.
First, this is a small cohort of patients, considering the complexity of this disease and the existence of many con-founding variables, and therefore this study is exploratory.
.2 .3 .4 .5 .6 No DCI DCI
0-72 Hours 8-10 Days 0-72 Hours 8-10 Days 500 600 700 800 900 1000
b
a
No DCI DCI0-72 Hours 8-10 Days 0-72 Hours 8-10 Days
C er ebe llum F A C ere be llu m AD C Fig. 4 Comparison of cerebellum FA (a) and ADC (b) values between evaluations times according to DCI .5 .6 .7 .8 No DCI DCI
0-72 Hours 8-10 Days 0-72 Hours 8-10 Days
500 600 700 800 900 1000
b
a
No DCI DCI0-72 Hours 8-10 Days 0-72 Hours 8-10 Days
Int er nal C ap sul e FA Int er nal C ap sul e A D C
Fig. 3 Comparison of internal capsule FA (a) and ADC (b) values between evaluation times according to DCI
We have no external control group, which may render the interpretation of FA and ADC values at the baseline difficult, since we are not able to determine if DTI values are already affected on the first 72 h after SAH.
We could not perform sequential MR imaging of some poor-grade SAH patients due to logistical and patient safety reasons. In fact, only two patients had GCS <8, so it might be argued that our results are more representative of patients with less severe SAH. The prevalence of DCI in our population however was in the range of DCI reported in other series [33,34].
Limitations on DTI should also be considered, especially for FA measurements. DTI analysis is known to be operator dependent, and regions where fibres cross may modify FA values [24]. We did not analyse tract volume, which has been shown to be associated with lesion of white matter tracts [14,
15], sometimes more significantly than FA values. Our interest was more on measuring whole-brain DTI and different re-gions of interest in the brain, other than analysing specific tracts. Finally, the magnitude of changes in FA is very small, which is a direct consequence of the narrow physiologic in-tervals of FA values (0–1), also reported in other studies [15].
Conclusion
In this series of acute SAH patients, we report changes in DTI parameters at the posterior limb of the internal capsule and cerebellum, occurring along the first 10 days after haemor-rhage. There was no significant statistical association of DTI parameters and SAH severity or the occurrence of DCI. However, in patients with DCI, changes in FA appear to have occurred on the first days of SAH, whilst changes in ADC were visible only later in the course of disease, probably reflecting different mechanisms.
Our results encourage further research to better understand the physiopathological mechanisms in SAH and to determine the possible usefulness of DTI parameters as markers of prognosis.
Acknowledgements We would like to thank the medical and nursing staff of Serviço de Cuidados Neurocríticos and Unidade Cerebro-Vascular at Hospital de São José, and the Neuroradiology Department physicians and technicians for collaboration during patient inclusion. We also thank Dr.Rui Marcelino for helping with the database. Dr. Fragata was supported by a grant of the Sociedade Portuguesa de AVC (SPAVC) sponsored by Tecnifar.
Compliance with ethical standards We declare that all human and animal studies have been approved by the CHLC Ethics Committee and have therefore been performed in accordance with the ethical standards laid down in the 1964 Declaration of Helsinki and its later amendments. We declare that all patients gave informed consent prior to inclusion in this study.
Conflict of interest We declare that we have no conflict of interest..
References
1. Helbok R, Kurtz P, Vibbert M, et al. (2013) Early neurological deterioration after subarachnoid haemorrhage: risk factors and im-pact on outcome. 266–270. doi:10.1136/jnnp-2012-302804
2. Connolly ES, Rabinstein a a, Carhuapoma JR et al (2012) Guidelines for the management of aneurysmal subarachnoid hem-orrhage: a guideline for healthcare professionals from the American Heart Association/American Stroke Association. Stroke 43:1711– 1737. doi:10.1161/STR.0b013e3182587839
3. Hackett ML, Anderson CS (2000) Health outcomes 1 year after subarachnoid hemorrhage: an international population-based study. The Australian Cooperative Research on Subarachnoid Hemorrhage Study Group. Neurology 55:658–662
4. Rinkel GJE, Algra A (2011) Long-term outcomes of patients with aneurysmal subarachnoid haemorrhage. Lancet Neurol 10:349– 356. doi:10.1016/S1474-4422(11)70017-5
5. Pegoli M, Mandrekar J, Rabinstein AA, Lanzino G (2015) Predictors of excellent functional outcome in aneurysmal subarach-noid hemorrhage. J Neurosurg 122:414–418
6. Jellison BJ, Field AS, Medow J et al (2004) Diffusion tensor imaging of cerebral white matter: a pictorial review of physics, fiber tract anatomy, and tumor imaging patterns. Am J Neuroradiol 25:356–369 7. Mori S, Zhang J (2006) Principles of diffusion tensor imaging and its applications to basic neuroscience research. Neuron 51:527–539 8. Provenzale JM, Isaacson J, Chen S et al (2010) Correlation of apparent diffusion coefficient and fractional anisotropy values in the developing infant brain. Am J Roentgenol 195:W456–W462. doi:10.2214/AJR.10.4886
9. Pluta RM, Hansen-Schwartz J, Dreier J et al (2009) Cerebral vaso-spasm following subarachnoid hemorrhage: time for a new world of thought. Neurol Res 31:151–158. doi:10.1179/174313209 X393564
10. Leng LZ, Fink ME, Iadecola C (2011) Spreading depolarization. Arch Neurol 68:31–36. doi:10.1001/archneurol.2010.226
11. Yuksel S, Tosun YB, Cahill J, Solaroglu I (2012) Early brain injury following aneurysmal subarachnoid hemorrhage: emphasis on cel-lular apoptosis. Turk Neurosurg:529–533. doi:10.5137/1019-5149. JTN.5731-12.1
12. Condette-Auliac S, Bracard S, Anxionnat R et al (2001) Vasospasm after subarachnoid hemorrhage: interest in diffusion-weighted MR imaging. Stroke 32:1818–1824. doi:10.1161/01.STR.32.8.1818
13. Liu Y, Soppi V, Mustonen T et al (2007) Subarachnoid hemorrhage in the subacute stage: elevated apparent diffusion coefficient in normal-appearing brain tissue after treatment. Radiology 242: 518–525
14. Jang SH, Kim HS (2015) Aneurysmal subarachnoid hemorrhage causes injury of the ascending reticular activating system: relation to consciousness. 667–671
15. Jang SH, Choi BY, Kim SH et al (2014) Injury of the mammillothalamic tract in patients with subarachnoid haemor-rhage: a retrospective diffusion tensor imaging study. BMJ Open 4:e005613–e005613. doi:10.1136/bmjopen-2014-005613
16. Yeo SS, Choi BY, Chang CH et al (2012) Evidence of corticospinal tract injury at midbrain in patients with subarachnoid hemorrhage. Stroke 43:2239–2241. doi:10.1161/STROKEAHA.112.661116
17. Frontera JA, Claassen J, Schmidt JM et al (2006) Prediction of symptomatic vasospasm after subarachnoid hemorrhage: the mod-ified fisher scale. Neurosurgery 59:21–27. doi:10.1227/01. NEU.0000218821.34014.1B
18. Hijdra a, Brouwers PJ, Vermeulen M, van Gijn J (1990) Grading the amount of blood on computed tomograms after subarachnoid hem-orrhage. Stroke 21:1156–1161. doi:10.1161/01.STR.21.8.1156
19. Frontera J a, Fernandez a, Schmidt JM et al (2009) Defining vasospasm after subarachnoid hemorrhage: what is the most
clinically relevant definition? Stroke 40:1963–1968. doi:10.1161/STROKEAHA.108.544700
20. Vergouwen MDI, Vermeulen M, Muizelaar JP, et al. (2010) Definition of delayed cerebral ischemia after aneurysmal subarach-noid hemorrhage as an outcome event in clinical trials and obser-vational studies proposal of a multidisciplinary research group. doi:
10.1161/STROKEAHA.110.589275
21. Fisher CM, Kistler JP, Davis JM (1980) Relation of cerebral vaso-spasm to subarachnoid hemorrhage visualized by computerized to-mographic scanning. Neurosurgery 6:1–9
22. Kistler JP, Crowell RM, Davis KR et al (1983) The relation of cerebral vasospasm to the extent and location of subarachnoid blood visualized by CT scan: a prospective study. Neurology 33: 424–436
23. Sehba FA, Pluta RM, Zhang JH (2011) Metamorphosis of sub-arachnoid hemorrhage research: from delayed vasospasm to early brain injury. Mol Neurobiol 43:27–40. doi: 10.1007/s12035-010-8155-z
24. Nucifora PGP, Verma R, Lee S, Melhem ER (2007) Diffusion-tensor MR imaging. Radiology 245:367–384. doi:10.1148/radiol.2452060445
25. Ebisu T, Naruse S, Horikawa Y et al (1993) Discrimination between different types of white matter edema with diffusion-weighted MR imaging. J Magn Reson Imaging 3:863–868
26. Busch E, Beaulieu C, Crespigny A De, Moseley ME (1998) Diffusion MR imaging during acute subarachnoid hemorrhage in rats
27. Brissaud O, Amirault M, Villega F et al (2010) Efficiency of frac-tional anisotropy and apparent diffusion coefficient on diffusion tensor imaging in prognosis of neonates with hypoxic-ischemic
encephalopathy: a methodologic prospective pilot study. Am J Neuroradiol 31:282–287. doi:10.3174/ajnr.A1805
28. Hunt RW, Neil JJ, Coleman LT et al (2004) Apparent diffusion coefficient in the posterior limb of the internal capsule predicts outcome after perinatal asphyxia. Pediatrics 114:999–1003. doi:10.1542/peds.2003-0935-L
29. Schmidt JM, Wartenberg KE, Fernandez A et al (2008) Frequency and clinical impact of asymptomatic cerebral infarction due to va-sospasm after subarachnoid hemorrhage. J Neurosurg 109:1052– 1059. doi:10.3171/JNS.2008.109.12.1052
30. Wartenberg KE, Sheth SJ, Michael Schmidt J et al (2011) Acute ischemic injury on diffusion-weighted magnetic resonance imaging after poor grade subarachnoid hemorrhage. Neurocrit Care 14:407– 415. doi:10.1007/s12028-010-9488-1
31. Frontera JA, Ahmed W, Zach V et al (2015) Acute ischaemia after subarachnoid haemorrhage, relationship with early brain injury and impact on outcome: a prospective quantitative MRI study. J Neurol Neurosurg Psychiatry 86:71–78. doi:10.1136/jnnp-2013-307313
32. Sviri GE, Lewis DH, Correa R et al (2004) Basilar artery vasospasm and delayed posterior circulation ischemia after aneurysmal sub-arachnoid hemorrhage. Stroke 35:1867–1872. doi:10.1161/01. STR.0000133397.44528.f8
33. Qureshi AI, Sung GY, Razumovsky AY et al (2000) Early identifi-cation of patients at risk for symptomatic vasospasm after aneurys-mal subarachnoid hemorrhage. Crit Care Med 28:984–990 34. Hijdra A, Van Gijn J, Nagelkerke NJD, et al. (1988) Prediction of
delayed cerebral ischemia, rebleeding, and outcome after aneurys-mal subarachnoid hemorrhage. 1250–1257. doi:10.1161/01. STR.19.10.1250