ISPA]
On: 09 September 2013, At: 11:22 Publisher: Taylor & Francis
Informa Ltd Registered in England and Wales Registered Number: 1072954 Registered office: Mortimer House, 37-41 Mortimer Street, London W1T 3JH, UK
The International Journal of
Aviation Psychology
Publication details, including instructions for authors and subscription information:
http://www.tandfonline.com/loi/hiap20
Selection of Air Force Pilot
Candidates: A Case Study on
the Predictive Accuracy of
Discriminant Analysis, Logistic
Regression, and Four Neural
Network Types
João Maroco a & Rui Bártolo-Ribeiro b a
Psychology and Health Research Unit &
Department of Psychological Sciences, ISPA-Instituto Universitário, Lisbon, Portugal
b
Psychology Centre of the Portuguese Air Force & Department of Organizational Psychology, ISPA-Instituto Universitário, Lisbon, Portugal
Published online: 08 Apr 2013.
To cite this article: João Maroco & Rui Bártolo-Ribeiro (2013) Selection of Air Force Pilot Candidates: A Case Study on the Predictive Accuracy of Discriminant Analysis, Logistic Regression, and Four Neural Network Types, The International Journal of Aviation Psychology, 23:2, 130-152, DOI: 10.1080/10508414.2013.772837
To link to this article: http://dx.doi.org/10.1080/10508414.2013.772837
PLEASE SCROLL DOWN FOR ARTICLE
Taylor & Francis makes every effort to ensure the accuracy of all the information (the “Content”) contained in the publications on our platform. However, Taylor & Francis, our agents, and our licensors make no
or suitability for any purpose of the Content. Any opinions and views
expressed in this publication are the opinions and views of the authors, and are not the views of or endorsed by Taylor & Francis. The accuracy of the Content should not be relied upon and should be independently verified with primary sources of information. Taylor and Francis shall not be liable for any losses, actions, claims, proceedings, demands, costs, expenses, damages, and other liabilities whatsoever or howsoever caused arising directly or indirectly in connection with, in relation to or arising out of the use of the Content.
This article may be used for research, teaching, and private study purposes. Any substantial or systematic reproduction, redistribution, reselling, loan, sub-licensing, systematic supply, or distribution in any form to anyone is expressly forbidden. Terms & Conditions of access and use can be found at
http://www.tandfonline.com/page/terms-and-conditions
ISSN: 1050-8414 print / 1532-7108 online DOI: 10.1080/10508414.2013.772837
Selection of Air Force Pilot Candidates:
A Case Study on the Predictive Accuracy of
Discriminant Analysis, Logistic Regression,
and Four Neural Network Types
João Maroco
1and Rui Bártolo-Ribeiro
21
Psychology and Health Research Unit & Department of Psychological Sciences, ISPA-Instituto Universitário, Lisbon, Portugal
2Psychology Centre of the Portuguese Air Force & Department of
Organizational Psychology, ISPA-Instituto Universitário, Lisbon, Portugal
We evaluated the predictive classification accuracy of discriminant analysis, logis-tic regression and four neural network typologies (multiple layer perceptrons, radial basis networks, probabilistic neural networks, and linear neural networks) on a flight screening program with a pass–fail criterion using several psychometric tests as predictors. A stepwise (for logistic regression and discriminant analysis) and sen-sitivity (for neural networks) selection procedure identified spatial visualization, eye–hand–foot coordination, and concentration capacity as significant predictors. Performance on the first few flights of the screening program was also retained as a significant predictor of final score. Regarding the accuracy of predictions, logis-tic regression showed the highest accuracy (77%), with high sensitivity (92%) but low specificity (31%). Discriminant analysis had high sensitivity (77%) and high specificity (64%). However, it had the second lowest accuracy (74%). The best per-forming neural network type was the multiple layer perception, which showed high sensitivity (85%), the second highest specificity (47%), and high accuracy (76%). Radial basis networks and probabilistic networks both fail to predict correctly the candidates who fail on the flight screening program (0% specificity).
Pilot selection is a very demanding process in terms of time and cost, with an attrition rate for a typical training program, over recent decades, on the order
Correspondence should be sent to João Maroco, ISPA-IU, Rua Jardim do Tabaco, 34, 1149–041 Lisbon, Portugal. E-mail: [email protected]
of 25%. The average cost for each failed candidate ranges from $50,000 to $80,000 for the U.S. Air Force, according to Hunter (1989) and Siem, Carretta, and Mercatante (1987). Historically, crew selection, and especially pilot selection, has been a field of on-going research. The support given by selection technologies and the use of statistical methods to increase selection accuracy has brought new developments to the personnel selection field. Several studies have tried to iden-tify which knowledge, abilities, skills and other personal characteristics should be evaluated to reduce the number of applicants who fail during training and to reduce the time required for pilot training (Carretta & Ree, 1996; Carretta, Ree, Tsang, & Vidulich, 2003). Hunter and Burke (1994), in a meta-analysis, found several predictor measures with moderated validity, but none with gener-alizable validity, when predicting aircraft pilot-training success. On the military side, most air forces are using computerized tests for psychological evaluation of pilot applicants on predictor measures identified by Hunter and Burke (1994), namely, spatial ability and aviation information. Parametric statistical classifica-tion methods (discriminant analysis, logistic regression) have been extensively used in classification problems for which the criterion variable is dichotomous (pass vs. fail; good vs. bad in credit scoring; health vs. disease in medical diag-nosis, etc.; Efron, 1975; Fan & Wang, 1999; Goss & Ramchandani, 1995; Lei & Koehly, 2003; Pohar, Blas, & Turk, 2004). These methods have been also used in the selection of military personnel and, in particular, fighter pilots (Sommer, Olbrich, & Arendasy, 2004). More recently, attention has been steadily building on the predictive accuracy and efficiency of nonparametric neural networks as applied to classification problems (Goss & Ramchandani, 1995; Nabney, 2004; Sommer et al., 2004). Some studies have shown the usefulness of this nonpara-metric classification method (Griffin, 1998; Sommer et al., 2004) in addition to the individual validity of the predictors, the correlations against criteria of which are often low (Hunter & Burke, 1994; Murphy, 1997). Research on the compar-ative accuracy for both parametric and nonparametric methods has been growing steadily, but results regarding classification accuracy and stability of the findings are still controversial (Finch & Schneider, 2006; Ghaffari & Hall, 2003; Sommer et al., 2004). In this article, we evaluate the sensitivity, specificity, and accuracy of traditional parametric classifiers (linear discriminant analysis, logistic regres-sion) and four nonparametric neural networks (multilayer perceptrons, radial basis function, probabilistic neural networks, and linear neural networks) devised for classification tasks in the prediction of pass versus fail pilot candidates on a flight screening program. We also evaluated the ability of the classification methods to discriminate between pass and fail candidates. The statistical significance, sen-sitivity (the ability to predict a passing score for individuals who indeed got a passing score estimated as the ratio of predicted approved candidates to observed approved candidates), and specificity (the ability to predict a failing score for individuals who did fail estimated as the ratio of predicted failing candidates
to observed failing candidates) of the several cognitive and psychomotor tests in different statistical classification models were also evaluated. Finally, the best predictors of success on the flight screening program of the pilot selection process are discussed.
CLASSIFICATION METHODS
Linear discriminant analysis (LDA) estimates discriminant function scores (D) for each of n subjects from p linearly independent continuous predictor variables (X). Discriminant weights (wij) are estimated by ordinary least squares so that the ratio of the variance within the k groups to the variance between the k groups is minimal. Classification functions can be deducted from the discriminant scores, and each subject is then classified in one’s group (pass or fail) where their clas-sification score is higher. The coefficients of the clasclas-sification function for each group are deducted from the within sum of squares matrixes of the discriminant scores for that group and from the means of the p discriminant predictors in each of the classifying groups. LDA requires that the group’s predictor vari-ables have multivariate normality and between-group homogenous variance and covariances.
Logistic regression (LR) models give the probability of occurrence of one (success) of the two classes of a dichotomous criterion. A Logit transformation of the probability of success for each subject (πi) is iteratively fitted to a linear combination of independent predictors by means of maximum likelihood estima-tion. Probability of success for each subject is estimated with the Logit model, and if the estimated probability is greater than 0.5 (or another predefined thresh-old value), the subject is classified in the success group; otherwise, he or she is classified into the failure group.
Research on the predictive accuracy of the parametric classification methods has produced mixed results regarding which is the method that performs better on several classification problems and with different predictors (Finch & Schneider, 2006; Hand & Henley, 1997; Lei & Koehly, 2003; Sommer et al., 2004). Selection of either model depends on the apparent assumptions researchers are willing to make regarding their classification model, as well as the type of predictors used (quantitative, qualitative, or both); the presence of multivariate normality and homoscedasticity of covariances (Efron, 1975; Harrell & Lee, 1985); the use of real data sets rather than on simulation data sets (Fan & Wang, 1999); and the sample size (Fan & Wang, 1999; Harrell & Lee, 1985).
More recently, nonparametric neural networks methods have been used in clas-sification problems and this is one of the most active research and application areas in the neural networks field (Finch & Schneider, 2007; Green et al., 2006;
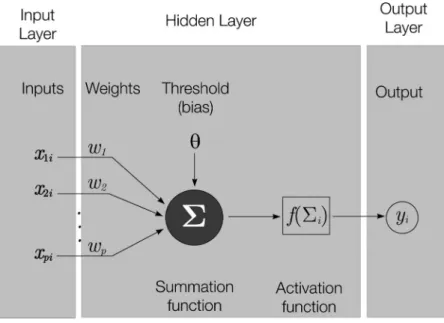
FIGURE 1 A simple one-neuron neural network representation. The activation function is generally a nonlinear function such as a sigmoid or Gaussian function. For each neuron, the output yican be seen as the result of an activation function concerning the sum of p inputs to
the neuron weighted by connection weight between the neuron and input j.
Liu, Starzyk, & Zhu, 2007; Sommer et al., 2004; Sut & Senocak, 2007; Zhang, 2000). A neural network tries to mimic the functioning of the human neuron. It receives inputs from the predictor variables (mimicking the neuronal synapses), which are connected to a network of nodes (neurons), which in turn are intercon-nected, with weights associated at each and every connection. Using a training data set, the weights are estimated by learning algorithms that try to maximize the correct prediction rates, as well as minimize the classification error rates. Inputs are weighted, summed, and transmitted to the activation function (mim-ics the nucleus of the neuron) and the result is output (axons). Figure 1 illustrates a simple neural network.
When presented with a new data set, the neural network predicts the outcome criterion according to the weights learned from the training set. Neural net-works are theoretically advantageous for classification problems because they are data-driven methods that can self-adapt to the data without prior explicit specifica-tion of distribuspecifica-tion properties or underlying models (Zhang, 2000). Furthermore, neural networks are universal function approximators that can approximate any nonlinear classification function with arbitrary accuracy (Hornik, 1991). Neural
networks can identify both main effects and complex interactions between pre-dictor variables in the hidden layer, which other parametric classifiers will ignore unless explicitly asked to test (Finch & Schneider, 2007; Marshall & English, 2000). This feature gives neural networks a large flexibility to model complex real-world relationships with no requirements for hard-to-verify assumptions. Although several network types can be used for classification proposes, the multi-layer perceptron (MLP) is the type regularly used for classification tasks (Sommer et al., 2004; Zhang, 2000). In this neural network typology, the network elements are organized into layers accordingly to their functions. The predictor variables of the neural network constitute the input layer. These units are connected to one or more hidden layers by weighted connections that feed the weighted inputs to sum-mation and activation functions, which in turn connect to the criterion variable in the output layer.
The radial basis function neural network (RBF) has a hidden layer of radial units (in contrast to the linear units of the MLP), each modeling a nonlinear Gaussian function. The output layer is composed of dot products with an identity activation function (for details on RBF, see Bishop, 1995). Comparing with MLP, they can model any nonlinear function with a single hidden layer that removes design decisions about the number of hidden layers required in an MLP to model a nonlinear function. RBFs are not designed to extrapolate beyond the known training data set. Due to its bell-shaped radial units, the response drops off rapidly toward zero if data points far from the training set are used (StatSoft, 2006). RBFs have been used mainly in regression problems because they can be faster to train than MLP. For classification problems, RBFs are less appropriate because the dot product outputs are not guaranteed to represent probabilities (Nabney, 2004).
Another neural network devised specifically for classifications tasks is the probabilistic neural network (PNN) suggested by Specht (1990). This type of neu-ral network learns to estimate a probability density function (PDF) from each case in the training data set. The PNN has a hidden layer composed of radial units copied directly from the training data and model a Gaussian function centered in each training case. The PDF can be constructed from the data assuming, typically, the Gaussian distribution.
A linear neural network (LNN) is the simplest neural network type available. Its use follows the principle that a simpler model should always be preferred to a complex model if the latter does not show higher accuracy in classification prob-lems. It is possible that a classification problem that might be thought to require a complex neural network can actually be solved just as well with standard linear techniques, especially for small data sets (StatSoft, 2006). The LNN does not have any hidden layer and the fitted function is just a hyperplane positioned to divide the classification groups much like the LDA function. When the LNN is activated, it multiplies the input data by a weight matrix and adds a bias vector so that the percent correct classifications are maximized.
METHOD Participants
The sample included 153 pilot candidates who volunteered to enter the Portuguese Air Force from 2001 to 2004 and who fulfilled the preadmission require-ments for the flight screening phase (after the psychological, medical, and physical evaluations). All participants had, at least, a high school diploma. Participants had a mean age of 18.1 years old (SD = 1.26), and 2.6% were female. In the 4-year period from 2001 to 2004, 76.5% of the candidates who flew the seven required flights during the flight screening phase were approved (passed).
Predictors
The predictors are from two different tests batteries: the Pilot Aptitude Tester (PILAPT) developed by People Technologies (2000) and the Aircrew Aptitude Tests (AAT) from the Royal Air Force. These tests were administered in a com-puterized format in the Psychometric Laboratory of the Psychology Centre of the Portuguese Air Force.
The following were the tests from PILAPT’s battery (People Technologies, 2000):
1. Deviation Indicator (DI) is a compensatory tracking test that eval-uates motor coordination. The subject should keep two lines (ver-tical and horizontal) crossed and centered on the screen through a joystick.
2. TRAX is a pursuit tracking task that evaluates a combination of psychomotor coordination, spatial ability, and processing information speed, and requires adaptation to the dynamics of the three-dimensional environment of flight.
3. The Hands test requires that the candidate, on the basis of an audio mes-sage stimulation, scan visual objects and identify how many of them are in accordance with the message. Although the Hands test is correlated with spatial tests, it is essentially a task of working memory, used to assess how quickly someone can move from verbal information to visual information and make an accurate decision.
4. The Patterns test measures perceptual closure and requires that the can-didate identify a target shape in two complex patterns. This task also includes the pressure of decreasing response time and the global score incorporates both speed (response latency) and accuracy (number of correct answers).
From the AAT battery, the following tests were used:
1. The Control of Velocity Test (CVT) is a psychomotor test that evaluates a pursuit-tracking task.
2. The Digit Recall test evaluates the short-term memory for digits.
3. Instrument Comprehension is a test based on airplane instrumentation, made up of two parts that evaluate spatial visualization with integration of numerical and verbal information. In the first part (INS1) the candidate should select the description of an aircraft’s orientation that corresponds to the information displayed on six aircraft instruments (altimeter, artifi-cial horizon, airspeed, vertical speed, compass, and turn and bank). In the second part (INS2), the candidate must identify which airplane has the attitude that corresponds to the available information in two instruments previously used (artificial horizon and compass).
4. The Sensory Motor Apparatus (SMA) is a compensatory tracking test that measures eye–hand–foot coordination. The candidate uses a joystick and rudder pedals to align a small circle on the screen against a random trajectory imposed by the software.
5. The Vigilance (VIG) test measures the attention capacity. Candidates are required to cancel stars (routine task) and arrows (priority task) on a matrix of 9 × 9 boxes, typing the coordinates of the cell where the stimulus appears.
We also considered as predictors the second (Flight2) and third (Flight3) flights from the seven flight screening missions. In these two missions, the applicants have to perform some basic flying procedures (e.g., maintain flight level, smooth turns, etc.) theoretically learned on the ground and evaluated on several parame-ters. For most applicants these two missions were the first opportunity to have a real aircraft flight control.
Criterion
The criterion was the final dichotomous classification of the flight screening pro-gram (FSP): pass versus fail. The FSP is the last phase of the selection process, and its main goal is to identify candidates who cannot adapt to the flying requirements and those who perform below the standards. FSP has a duration of approximately 10 days. The first 2 days are for theoretical lessons concerning basic flying princi-ples and aviation safety, followed by seven flying missions of approximately 1 hr each. The first one is a demo flight. In the other six flights the candidate’s perfor-mance is evaluated by an instructor on a scale of 4 points measuring 17 behaviors (e.g., attentive and alert to situational changes, correct reaction to multiple inputs). Each mission has a profile, or a set of maneuvers and procedures that candidate
is requested to do. This profile requires a minimum performance score on each maneuver or procedure adequate to that mission. The candidate must perform each mission satisfactorily and pass the verification flight on the last mission to be approved in the FSP. During the first six missions, candidates fly with the same instructor pilot, but the last verification flight is done with a different instructor, usually the instructor pilot team leader.
Procedure
In the Portuguese Air Force, pilot selection process takes approximately 18 to 20 days and is developed in four evaluation stages (psychological, medical, physical, and flight screening). During the psychological evaluation, several psychomotor, cognitive, and personality tests are administered to identify those who could perform better on the flight screening phase and afterward in the Air Force Academy.
The psychological evaluation process took place in at the Psychology Centre of the Portuguese Air Force, where 20 applicants were examined per day and each applicant stayed for 2 days. The first day is for a general briefing concerning selection process procedures and for administration of all perceptual-cognitive and psychomotor tests, motivation and personality questionnaires, and a projective technique. Group dynamics and interviews were done on the second day, and at the end of this day all psychologists involved in the process meet together for an analysis of each applicant’s process and discussion of results to get a final global score of passing or failing the overall psychological evaluation.
Average attrition rate for this first psychological evaluation stage is 55% to 60%. Only candidates who met psychological, medical, and physical requirements were sent for the FSP.
Statistical Classification Methods
Psychological predictors and age were evaluated by discriminant analysis, LR, and four neural network types—MLP, PNNs, LNNs, and RBFs—against the pass– fail criterion on the FSP.
Predictors were standardized prior to any analysis to eliminate possible effects of the different measurement scales in which they were originally expressed. Multivariate normality and homogeneity of covariance assumptions for discriminant analysis were evaluated as described in Maroco (2007). LDA and LR analyses were done with SPSS (version 14; SPSS, Inc., Chicago, IL) using equal prior probabilities. These parametric classification methods were fitted to a training data set (n = 116), and only statistically significant predictors (p < .05) were retained in the final classification models. To avoid overestimation of classification accuracy with the training data, the classification efficiency was also
evaluated with a new test data set (n= 37) both in terms of sensitivity (ratio of predicted approved candidates to observed approved candidates), specificity (ratio of predicted failed candidates to observed failed candidates), and predictive accu-racy (ratio of total correct classifications to total sample size). The four neural network typologies were fitted with the package Statistica Neural Networks (ver-sion 7; StatSoft, Tulsa, OK). Selection of the best performing neural networks was done with the SNN Intelligent Problem Solver using backpropagation and gradient descent algorithms for a training set with n= 79, selection set with n = 37, and test set with n= 37. Predictor selection for the final neural network was based on the neural network sensitivity ratio (ratio of classification error for the model without the predictor to the error of the model with the predictor). Only predictors with a sensitivity ratio greater than 1.01 were retained. Classification sensitivity, specificity, and accuracy were calculated for the different statistical classification methods evaluated with selected predictors. Because accuracy per se is a poor indicator of the classification model performance, as it is influenced by the pass versus fail proportions, we also evaluated the receiver operating char-acteristic (ROC) curves. The area under the ROC curve (c) can also be used to estimate the discriminant capacity of the models to discriminate between pass versus fail candidates.
RESULTS Linear Discriminant Analysis
All individual predictor variables, with the exception of age and CVT, showed a normal distribution (Kolmogorov–Smirnov’s p > .05) and thus multivariate normality is assumed as well as homogeneity of variance–covariance matrix for the two groups (Box’s M= 130.334), F(2, 14027.997) = 1.226, p = .071. One discriminant function was adjusted to the training set (n= 116) and selection of significant predictors was done accordingly to the Wilks’s lambda criterion implemented in the SPSS stepwise procedure (Table 1).
According to the stepwise procedure, the only significant predictors were INS1 (p= .056), SMA (p = .002), and Flight3 (p = .003). The classification functions fitted were
Class(Pass)= 1.050 − 0.408INS1 − 0.635SMA + 0.577Flight3 Class(Fail)= 0.726 − 0.167INS1 − 0.172SMA + 0.174Flight3
An individual was classified in the group (pass or fail) for which their classi-fication score was higher. The classiclassi-fication functions correctly classified 70% of
T ABLE 1 Significant Predictors in L inear Discr iminant Analysis B ased on Wilks’s Lambda Pr edictor s Significance and W ilks λ Ag e C VT DI Hand INS1 INS2 P A T D R S MA TRAX VIG F light2 F light3 Step = 0 Significance of F to enter 0.685 0.199 0.132 0.547 0.189 0.060 0.120 0.234 0.002 0.160 0.218 0.028 0.003 W ilks’s lambda 0.999 0.985 0.980 0.997 0.985 0.968 0.978 0.987 0.915 0.982 0.986 0.957 0.923 Step = 1 Significance of F to enter 0.898 0.960 0.605 0.813 0.056 0.268 0.285 0.571 0.767 0.031 0.033 0.005 W ilks’s lambda 0.915 0.915 0.913 0.915 0.885 0.905 0.906 0.913 0.915 0.877 0.878 0.853 Step = 2 Significance of F to enter 0.970 0.954 0.887 0.782 0.169 0.529 0.200 0.894 0.072 0.484 W ilks’s lambda 0.814 0.814 0.814 0.813 0.800 0.811 0.802 0.814 0.790 0.810 V ariables in the m odel Significance of F to remo v e 0.024 0.001 0.003 W ilks’s lambda 0.936 0.957 0.978 Note .Significance le v el to entry = .05 and significance to remo v al = .1. S tandardized discriminant function = –0.512 INSB 1-0.729 SMA + 0.665 Flight 3 (W ilks’s λ = 0.814), χ 2(3) = 22.557, p < .001; rCanonical = .431. CVT = Control o f V elocity test; DI = De viation Indicator; INS1 = Instrument Comprehension P art 1 ; INS 2 = Instrument Comprehension P art 2 ; P A T = P atterns test; DR = Digit R ecall; SMA = Sensory M otor Apparatus; VIG = V igilance T est.
the students in the training set (n= 116), whereas for the test set (n = 37) this per-centage was 81%. For the combined data sets, the model correctly classified 77% of the approved students (sensitivity) and 64% of the failed students (specificity) and the overall accuracy was 74%. Area under the ROC curve was c= 0.803 (p< .001).
Logistic Regression
Coefficients and significance levels of predictor variables in the LR model obtained with SPSS’s Stepwise method are given in Table 2 for both the initial and final model. The final model, after removing nonsignificant predictor vari-ables, includes INS1 (p = .043), SMA (p = .001), VIG (p = .06) and Flight3 (p= .006):
Ln[ˆπ/(1 − ˆπ)] = 1.600 − 0.608INS1 − 1.075SMA − 0.549VIG + 0.762Flight3
The fitted model was statistically significant,χ2(3)= 33.684, p < .001; Cox & Snell R2= 0.218, Nagelkerke R2= 0.326, and McFadden R2= 0.202. Correct
classification rates were 77% for the training set (n= 116) and 78% for the test set (n= 37). For the complete set (N = 153), the final model correctly predicted 31% of the failed students (specificity) and 92% of the approved students (sensitivity) with an overall accuracy of 77%. Area under the ROC curve was c= 0.800 (p < .001).
Neural Networks
The performances of the four neural network types (MLP, LNN, RBF, PNN) tested are given in Table 3. Judging from the overall network performance, the best network is a three-layer MLP, with 13 inputs, 13 hidden nodes, and one output node that correctly classified 82% of the passed students and 67% of the failed students (77% overall correct classification). However, selection error and test error are quite large, making the prediction validity of this network poor. A linear discriminant neural network with eight predictors showed the highest overall cor-rect classification rate, with reduced error for training, selection, and testing sets. However, it performed poorly in the classification of failed students.
The neural network sensitivity analysis (Table 4) reveals that of the 13 included predictors, only DI, INS1, INS2, SMA, VIG, Flight2, and Flight3 have acceptable sensitivity, although with the exception of Flight3, they all are within the accep-tance limit (1.01). Thus, a new set of refined neural network models were adjusted with the predictors for which sensitivity was greater than or equal to 1.01 for
T ABLE 2 Predictors’ Coefficients and Significance L e v els in the Stepwise Logistic Reg ression Models Pr edictor s Ag e C VT DI Hand INS1 INS2 P A T D R S MA TRAX VIG F light2 F light3 Initial step B 0 .134 0.101 − 0.289 − 0.136 − 0.812 0.503 − 0.004 0.542 − 1.132 0.014 − 0.755 0.284 0.609 Sig. 0.673 0.770 0.422 0.658 0.016 0.069 0.988 0.106 0.009 0.961 0.022 0.378 0.098 Exp(B) 1.143 1.106 0.749 0.873 0.444 1.653 0.996 1.719 0.322 1.014 0.470 1.329 1.838 Final step B − 0.608 − 1.075 − 0.549 0.762 Sig. 0.043 0.001 0.060 0.006 Exp(B) 0.545 0.341 0.577 2.143 Note . Criterion: P ass–f ail on flight screening p rogram. C VT = Control o f V elocity test; DI = De viation Indicator; INS1 = Instrument Comprehension P art 1; INS2 = Instrument Comprehension P art 2 ; P A T = P atterns test; DR = Digit R ecall; SMA = Sensory M otor Apparatus; VIG = V igilance T est.
T ABLE 3 P e rf or mance and Correct Rate C lassification of the F our Neur al Netw o rk T y pologies Ev aluated P erformance E rr or Corr ect Classification (%) Network T opolo g y T ra in Selection T est T ra in Selection T est S ensitivity Specificity Pr edictive Accur a cy (%) MLP 13:13:1 0 .91 0 .68 0 .65 0 .41 1 .05 1 .106 82 67 77 RBF 12:22:1 0 .87 0 .80 0 .73 0 .30 0 .41 0 .40 8 9 5 8 8 1 PNN 13:76:1 0 .72 0 .83 0 .78 0 .42 0 .39 0 .40 100 0 7 6 Linear 8:1 0 .83 0 .83 0 .83 0 .37 0 .37 0 .39 9 3 4 7 8 3 Note . The n eural n etw ork topology is indicated as Number of predictors:Number o f h idden n eurons:Number o f output nodes. MLP = multilayer perceptron; RBF = radial basis functions; PNN = probabilistic neural netw ork.
T ABLE 4 Netw o rk Sensitivity A nalysis for the 1 3 P redictors U sed o n F our Neur al Netw o rk T opologies Pr edictor s Network T opolo g y A g e CVT D I H and INS1 INS2 P A T D R S MA TRAX VIG F light2 F light3 MLP 13:13:1 0 .934 0.975 1.104 0.980 0.959 1.062 0.965 0.989 1.090 0.971 1.127 0.991 1.160 RBF 12:22:1 1 .006 1.015 1.020 1.065 1.098 1.001 1.016 1.032 0.999 1.018 0.995 1.048 PNN 13:76:1 1 .000 1.002 1.003 1.002 1.003 1.006 1.002 1.001 1.008 1.002 1.002 1.004 1.009 Linear 8:1 1 .000 1.025 1.013 1.006 1.050 1.011 1.004 1.032 Note .V alues are the ratio of the error o f the netw ork w ithout the p redictor to the error o f the netw ork w ith the p redictor .V alues greater than 1.01 indicate important p redictors in the n etw ork. CVT = Control o f V elocity test; DI = De viation Indicator; INS1 = Instrument Comprehension P art 1 ; INS2 = Instrument Comprehension P art 2 ; P A T = P atterns test; DR = Digit R ecall; SMA = Sensory M otor Apparatus; VIG = V igilance T est; M LP = multilayer perceptron; RBF = radial basis functions; PNN = probabilistic neural netw ork.
most of the neural network types studied. Classification accuracy, sensitivity, and specificity for the refined neural networks are given by Table 5.
Judging from the overall neural network performance (see Table 5), the MLP (5:5–6–1:1) with five inputs and six hidden nodes was the best classifying neural network with 85% sensitivity, 47% specificity, and 76% overall accuracy. Area under the ROC curve was the highest observed (c= 0.809, p < .001), showing the good capacity of this MLP to discriminate between pass and fail candidates. Both RBF and PNN correctly classified 100% of the approved students, but failed to predicted failing students (nil specificity) and thus cannot discriminate between the two types of candidates (c= 0.5, ns; and 0.52, ns, respectively). Finally, the linear discriminant neural network showed 94% sensitivity and 31% specificity with an overall accuracy of 73%. The area under the ROC curve was quite high (c= 0.800, p < .001).
A confirmatory neural network sensitivity analysis for the five predictors (DI, INS2, SMA, VIG, and Flight3) evaluated is given in Table 6. With the exception of DI, all other predictors showed acceptable sensitivity for most of the neural network types evaluated.
DISCUSSION
Choosing appropriate psychometric predictors in personnel selection is an impor-tant issue in building either parametric (LR or LDA) or nonparametric (neural network) binary predictive classification models. In our study, a stepwise LDA selection of predictors for flight screening success retained three predictors: INS1, SMA, and Flight3. Additionally, a stepwise LR retained a fourth predictor (VIG) as statistically significant in addition to INS1, SMA, and Flight3. Although stepwise selection methods might select nonsignificant predictors, while leaving significant predictors out (see, e.g., Flack & Chang, 1987, for a discussion in a regression context), its utilization has been validated by Monte Carlo simulation studies. In one of these studies, only small differences were found in the selec-tion of significant predictors both by stepwise LDA and stepwise LR (O’Gorman & Woolson, 1991). Neural network sensitivity analysis for the variables in the MLP (the best performing neural network) suggests that INS2, SMA, VIG, and Flight3 are the most useful predictors concerning the pass–fail criterion in FSP. These predictors are in accordance with the ones selected by stepwise LR. Taking into consideration the small sample for this kind of statistical analysis and the fact that participants were from four different yearly selection processes, it is sig-nificant that the validity of three of these four predictors is consistent through the three different classification methods. Although the tests used for evaluation of predictors were the same in the 4 years and applied in same way, that did not guarantee that changes did not happen in the criterion evaluation; namely, changes
T ABLE 5 P e rf or mance and Correct Rate C lassification of the F our Neur al Netw o rk T y pologies Ev aluated With Predictors W ith S ensitivity Ratio Greater Than 1.01 P erformance E rr or Corr ect Classification (%) Network T ra in Selection T est T ra in Selection T est S ensitivity Specificity Pr edictive Accur a cy (%) MLP 5 :6:1 0.75 0.78 0.76 0.55 0.68 0.62 85 47 76 RBF 4:1:1 0 .72 0 .82 0 .78 0 .45 0 .40 041 100 0 7 6 PNN 5:76:1 0 .72 0 .82 0 .78 0 .42 0 .39 0 .39 100 0 7 6 Linear 4:1 0 .76 0 .85 0 .78 0 .39 0 .37 0 .38 9 4 3 1 7 3 Note . MLP = multilayer perceptron; RBF = radial basis functions; PNN = probabilistic neural netw ork.
TABLE 6
Network Sensitivity Analysis for the Five Predictors Used in the Refined Neural Network Models
Predictors
Network Topology DI INS2 SMA VIG Flight3
MLP 5:5–6–1:1 0.989 1.016 1.071 1.053 1.103
RBF 4:4–1–1:1 1.006 1.001 1.004 1.001
PNN 5:5–76–2:1 1.006 1.011 1.015 1.005 1.021
Linear 4:4–1:1 3.000 1.000 4.000 2.000
Note. Values are the ratio of the error of the network without the predictor to the error of the network with the predictor. DI= Deviation Indicator; INS2 = Instrument Comprehension Part 2; SMA= Sensory Motor Apparatus; VIG = Vigilance Test; MLP = multilayer perceptron; RBF = radial basis functions; PNN= probabilistic neural network.
in instructor pilot teams. Even so, the emergence of three predictors statistically significant from three different classification systems with a sample composed of candidates from four different yearly processes is a good indicator of their stability.
Our results suggest that motor coordination (SMA), spatial visualization using numerical and verbal information (INS1), and initial overall flight situation awareness (Flight3) could be a good package of psychological and operational predictors for success in a short ab initio pilot training program. The SMA used in this study is a computerized adaptation of an old electromechanical device intro-duced during 1940s by the Royal Air Force that measures the same psychomotor coordination as other two tests—TRAX and DI. Several studies showed that this factor is a very important dimension for predicting success on ab initio flying training (Cox, 1989; Hunter & Burke, 1994). Cox (1989) found that 27.1% of the variability of success in undergraduate pilot training had been accounted for by psychomotor performance measured by two computerized versions of the two hand coordination and complex coordination tests. With a sample similar to the one in this study, Bártolo-Ribeiro (1992) found an uncorrected correlation coef-ficient of .45 between an electromechanical version of the two hand coordination test and a global final score on a flight adaptation stage (the prior version of the FSP, with 10–12 flights). This illustrates the importance of motor coordination as a predictor for pilot selection independent of the way in which it was measured. It is a good predictor, especially of performance on ab initio flight courses.
One of the other statistically significant predictors, Flight3, corresponds to an evaluation made by an instructor pilot on the third flight mission of the FSP. This evaluation could be used as a support for the introduction of a flight simulator testing phase to reduce screening costs.
One question that remains unanswered is whether the dimensions focused on motor coordination and spatial visualization, selected in this study as the best predictors for performance in the FSP, continue to be the best predictors of real flying performance or only have predictive value on ab initio pilot trainees. This question is difficult to answer in the actual Portuguese pilot evaluation scenario because military pilot performance in real-duty tasks can only be evaluated 7 years after psychological evaluation (5 years in the Air Force Academy plus 2 years for flight training), which, according to Hunter and Burke (1994), is too long a period to evaluate temporal stability of predictors. According to these authors, time is one of the variables that influence the validity of classification models, because of the changes that happen both in the population of applicants as well as in the training and operational environments.
Comparison of LDA, LR, and four neural network types reveals that RBF and PNN have the highest sensitivity, but nil specificity (see Table 7). Thus, these neural networks, devised specifically for classification tasks, predict all applicants to be approved and fail to discriminate between approved and failed candidates, rendering them useless for personnel selection in this context. LDA showed the highest specificity (64%) of the evaluated classification models, also with high sensitivity (77%) and discrimination capacity (c= 0.801). The LR model had high sensitivity (92%) but had low specificity (33%), even though discriminant capacity can be classified as good (c= 0.800). The MLP also showed high sensi-tivity (85%), although specificity (47%) was somehow lower than what would be desirable. However, this MLP had the highest capacity to discriminate between approved and failed students (c = 0.809). High sensitivity was achieved by the simple LNN (94%), but again specificity was quite low (31%) even though discriminant capacity was high (c= 0.800).
TABLE 7
Classification Efficiency of Logistic Regression, Linear Discriminant Analysis, and Four Neural Network Topologies
Model Sensitivity(%) Specificity(%) Predictive Accuracy(%) Area Under the ROC Curve
LR 92 31 77 0.800 LDA 77 64 74 0.803 MLP 85 47 76 0.809 RBF 100 0 76 0.500 PNN 100 0 76 0.520 LNN 94 31 73 0.800
Note. ROC = receiver operating characteristic; LR = logistic regression; LDA = linear
discriminant analysis; MLP = multilayer perceptrons; RBF = radial basis functions; PNN = probabilistic neural networks; LNN= linear neural networks.
All neural network methods and LR performed poorly in the classification of failing candidates (specificity less than 50%). This might be due to the unbalanced database used here, where only 23.5% of the candidates were classified as failing. Similar results were reported on a study where PNN was applied to estimate the risk of mortality after cardiac surgery (Orr, 1997). In that study, observed mor-tality varied between 4% and 16%, and the trained PNN had 25% sensitivity and 94% specificity, with c= 0.81 for the validation data set (Orr, 1997). It is clear that a low percentage of the modeled group results in reduced predictability of that group either in terms of specificity (as in our study) or sensitivity (as in Orr, 1997). Low sensitivity and specificity limits the use of LR and neural networks for selection and classification tasks. However, when group probabilities are close to 50%, neural networks have been reported to outperform both LR and LDA in terms of correct predictions (Goss & Ramchandani, 1995). It is clear that LR and neural network methods perform best when the variability in the criterion is close to its maximum; that is, when P(success)≈ P(failure) ≈ 0.5. When the popula-tion’s proportions are known in advance, or can be estimated from the sample proportions, this information can be entered for prior probabilities estimation in LDA; this increases the overall accuracy of LDA over LR. However, if the cut-score probability is also set to equal the prior probability of the modeled group, simulation results have shown that the total misclassification rate will be signifi-cantly worse than the ideal (Lei & Koehly, 2003). LR specificity was limited by the imbalance between approved and failed candidates. On the contrary, LDA was less sensitive to a bias in the criterion groups and this method achieved the highest specificity with high discrimination ability.
For the four neural network types tested in this study, only the MLP had comparable performance to LR and LDA when sensitivity, specificity, accuracy, and discrimination capacity were accounted for. This finding is consistent with results from Schwarzer, Vach, and Schumacher (2000), who contended that in many selection contexts, and especially when relationships between covariates do not differ substantially from the linear model, neural networks might not yield greater prediction accuracy than LR or LDA (see also Gallinari, Thiria, Badran, & Fogelman-Soulie, 1991). However, these results are in contrast to a related study by Sommer et al. (2004), who found, in a pilot study from a project on the selection of pilot trainees conducted in cooperation with a European airline, that an MLP clearly outperformed LR in terms of sensitivity (92.0% vs. 71.1% ), specificity (79.5% vs. 65.9%), and accuracy (85.4% vs. 68.3%). However, sam-ple and procedure characteristics do not match those in our study. Participants in a study reported by Sommer et al. (2004) were applicants for pilot training at a civilian airline; they had a mean age of 26.9 (SD= 4.7) years old and already had a private flight license. All the participants assessed on the predictors went to the pilot training independently of the results achieved in the predictors; and, finally, the criterion used was more stable, as it represented a 1-year pilot training that
included regular classes as well as in-flight instructions (the authors did not men-tion if the training was more theoretical or practical and how many flying hours the candidates flew).
The results from studies using neural networks in the aviation psychology con-text have not yet produced definitive conclusions regarding the accuracy of neural networks as compared to traditional parametric methods. Griffin (1998), in a study conducted with volunteer participants from the U.S. Navy flight training program, did not find statistically significant differences between the correlation coeffi-cients resulting from the application of multiple regression and neural network prediction procedures. Lescreve (1995) arrived at similar results when he com-pared neural networks with multiple linear regression and subject matter experts in the prediction of training outcomes. However, several studies from unrelated applications have demonstrated that neural networks might be a competitive alter-native to parametric classifiers (Hand & Henley, 1997; Pitarque, Roy, & Ruiz, 1998; Sommer et al., 2004).
Sample size has also been known to play an important role in the accuracy of neural networks (Fukunaga & Hayes, 1989; Raudys & Jain, 1991). It must be pointed out that, in our study, the number of cases for the training, selection, and testing sets are quite below the recommended data set dimensions for neural net-works (several hundred; Fukunaga & Hayes, 1989; Vach, Roßner, & Schumacher, 1996). Large data set requirements are also found in LR, but less in LDA if the model’s assumptions are met. In our study, sample size was not, apparently, lim-iting for the achievement of a high accuracy by both LR and LDA. Similar results have been reported (Finch & Schneider, 2007; Pohar et al., 2004). Evidence gath-ered in both simulation studies and real data sets suggests that sample sizes around 150 are not limiting for both parametric and nonparametric classifiers (Finch & Schneider, 2007; Pohar et al., 2004; Vach et al., 1996). Although generalization and population inferences might be compromised, these are the sample sizes that practitioners will probably work with. Indeed, a survey of research papers (Jaccard & Wan, 1995) reported that the median sample size across studies in psychology sciences is 175, and large sample sizes around 400.
CONCLUSION
In our study, neural networks did not outperform LR and LDA. LDA was actually the classifier showing the best balance among sensitivity, specificity, and predic-tive accuracy. In general terms, the simpler and inflexible parametric classifiers might not have the power to learn the variety of interactions and direct effects underlying the relationship between the data points and thus underfit the data, but more complex and flexible models, such as neural networks, have a tendency to overfit the data and show model instability when extrapolating to new data sets,
making the results nongeneralizable to a wider population. With small sample sizes and, especially, if multivariate normality and homoscedasticity of covari-ances can be met, LDA is a simple, theoretically robust, reproducible, and efficient classifier for personnel selection.
REFERENCES
Bártolo-Ribeiro, R. (1992). Predição da performance em psicologia aeronáutica: Validação de uma bateria de selecção [Prediction of performance in aviation psychology: Validation of a selection battery]. Análise Psicológica, Série X(3), 353–365.
Bishop, C. (1995). Neural networks for pattern recognition. Oxford, UK: Oxford University Press. Carretta, T. R., & Ree, M. J. (1996). U.S. Air Force pilot selection tests: What is measured and what
is predictive? Aviation, Space, and Environmental Medicine, 67, 279–283.
Carretta, T. R., Ree, M. J., Tsang, P. S., & Vidulich, M. A. (2003). Pilot selection methods. In P. S. Tsang & M. A. Vidulich (Eds.), Principles and practice of aviation psychology (pp. 357–396). Mahwah, NJ: Erlbaum.
Cox, R. H. (1989). Psychomotor screnning for USAF pilot candidates: Selecting a valid criterion. Aviation, Space, and Environmental Medicine, 60, 1153–1156.
Efron, B. (1975). The efficiency of logistic regression compared to normal discriminant analysis. Journal of the American Statistical Association, 70, 892–898.
Fan, X., & Wang, L. (1999). Comparing linear discriminant function with logistic regression for the two-group classification problem. Journal of Experimental Education, 67, 265–286.
Finch, H., & Schneider, M. K. (2006). Misclassification rates for four methods of group classification: Impact of predictor distribution, covariance inequality, effect size, sample size, and group size ratio. Educational and Psychological Measurement, 66, 240–257.
Finch, H., & Schneider, M. K. (2007). Classification accuracy of neural networks vs. discriminant analysis, logistic regression, and classification and regression trees: Three- and five-group cases. Methodology, 3(2), 47–57.
Flack, V. F., & Chang, P. C. (1987). Frequency of selecting noise variables in subset regression analysis: A simulation study. The American Statistician, 41, 84–86.
Fukunaga, K., & Hayes, R. R. (1989). Effects of sample size in classifier design. IEEE Transactions on Pattern Analysis and Machine Intelligence, 11, 873–885.
Gallinari, P., Thiria, S., Badran, F., & Fogelman-Soulie, F. (1991). On the relations between discriminant analysis and multilayer perceptrons Neural Networks, 4, 349–360.
Ghaffari, M., & Hall, E. L. (2003). Experimental approach for the evaluation of neural network clas-sifier algorithms. In D. P. Casasent, E. L. Hall, & J. Röning (Eds.), Intelligent robots and computer vision XXI: Algorithms, techniques, and active vision (Vol. 5267, pp. 250–256). Bellingham, WA: SPIE.
Goss, E. P., & Ramchandani, H. (1995). Comparing classification accuracy of neural networks, binary logit regression and discriminant analysis for insolvency prediction of life insurers. Journal of Economics and Finance, 19(3), 1–18.
Green, M., Björk, J., Forberg, J., Ekelund, U., Edenbrandt, L., & Ohlsson, M. (2006). Comparison between neural networks and multiple logistic regression to predict acute coronary syndrome in the emergency room. Artificial Intelligence in Medicine, 38, 305–318.
Griffin, G. R. (1998). Predicting naval aviator flight training performance using multiple regression and an artificial neural network. International Journal of Aviation Psychology, 8, 121–135. Hand, D. J., & Henley, W. E. (1997). Statistical classification methods in consumer credit scoring: A
review. Journal of the Royal Statistical Society, Series A, 160, 523–541.
Harrell, F. E., & Lee, K. L. (1985). A comparison of the discrimination of discriminant analysis and logistic regression under multivariate normality. In K. Sen (Ed.), Biostatistics: Statistics in biomed-ical, public health, and environmental sciences (The Bernard G. Greenberg Vol., pp. 333–343). Amsterdam, Netherlands: North-Holland.
Hornik, K. (1991). Approximation capabilities of multilayer feedforward networks. Neural Networks, 4, 251–257.
Hunter, D. R. (1989). Aviator selection. In M. F. Wiskoff & G. M. Rampton (Eds.), Military personnel measurement: Testing, assignment, evaluation (pp. 129–167). New York, NY: Praeger.
Hunter, D. R., & Burke, E. F. (1994). Predicting aircraft pilot-training success: A meta-analysis of published research. International Journal of Aviation Psychology, 4, 297–313.
Jaccard, J., & Wan, C. K. (1995). Measurement error in the analysis of interaction effects between con-tinuous predictors using multiple regression–multiple indicator and structural equation approaches. Psychological Bulletin, 117, 348–357.
Lei, P. W., & Koehly, L. M. (2003). Linear discriminant analysis versus logistic regression: A compar-ison of classification errors in the two-group case. The Journal of Experimental Education, 72(1), 25–49.
Lescreve, F. J. (1995, May). The use of neural networks as an alternative to multiple regressions and subject matter experts in the prediction of training outcomes. Paper presented at the 31st annual International Applied Military Psychology Symposium, Lisbon, Portugal.
Liu, Y., Starzyk, J. A., & Zhu, Z. (2007, February). Optimizing number of hidden neurons in neural networks. Paper presented at the Artificial Intelligence and Applications conference, Innsbruck, Austria.
Maroco, J. (2007). Análise Estatística com utilização do SPSS [Statistical analysis using SPSS] (3rd ed.). Lisbon, Portugal: Silabo.
Marshall, D. B., & English, D. J. (2000). Neural network modeling of risk assessment in child protective services. Psychological Methods, 5(1), 102–124.
Murphy, K. R. (1997). Meta-analysis and validity generalization. In N. Anderson & P. Herriot (Eds.), International handbook of selection and assessment (pp. 323–342). Chichester, UK: Wiley. Nabney, I. T. (2004). Efficient training of RBF networks for classification. International Journal of
Neural Systems, 14, 201–208.
O’Gorman, T. W., & Woolson, R. F. (1991). Variable selection to discriminate between two groups: Stepwise logistic regression or stepwise discriminant analysis? The American Statistician, 45, 187–193.
Orr, R. K. (1997). Use of a probabilistic neural network to estimate the risk of mortality after cardiac surgery. Medical Decision Making, 17, 178–185.
People Technologies. (2000). PILAPT-The pilot aptitude tester handbook (edition 1.0). Kent, UK: Author.
Pitarque, A., Roy, J. F., & Ruiz, J. C. (1998). Redes neurales vs modelos estadísticos: Simulaciones sobre tareas de predicción y clasificación [Neural networks vs. statistical models: Simulations on prediction and classification tasks]. Psicológica, 19, 387–400.
Pohar, M., Blas, M., & Turk, S. (2004). Comparison of logistic regression and linear. discriminant analysis: A simulation study. Metodološki Zvezki, 1, 143–161.
Raudys, S. J., & Jain, A. K. (1991). Small sample size effects in statistical pattern recogni-tion: Recommendations for practitioners. IEEE Transactions on Pattern Analysis and Machine Intelligence 13, 252–264.
Schwarzer, G., Vach, W., & Schumacher, M. (2000). On the misuses of artificial neural networks for prognostic and diagnostic classification in oncology. Statistics in Medicine, 19, 541–561. Siem, F. M., Carretta, T. R., & Mercatante, T. A. (1987). Personality, attitudes and pilot training
performance: Preliminary analysis (Report No. AFHRL-TR-87-62). Brooks Air Force Base, TX: Air Force Human Resources Laboratory, Manpower and Personnel Division.
Sommer, M., Olbrich, A., & Arendasy, M. (2004). Improvements in personnel selection with neu-ral nets: A pilot study in the field of aviation psychology. The International Journal of Aviation Psychology, 14, 103–115.
Specht, D. F. (1990). Probabilistic neural networks. Neural Networks, 3, 109–118.
StatSoft. (2006). Electronic statistics textbook. Retrieved from http://www.statsoft.com/textbook/ stathome.html
Sut, N., & Senocak, M. (2007). Assessment of the performances of multilayer perceptron neural net-works in comparison with recurrent neural netnet-works and two statistical methods for diagnosing coronary artery disease. Expert Systems, 24, 131–142.
Vach, W., Roßner, R., & Schumacher, M. (1996). Neural networks and logistic regression: Part II. Computational Statistics and Data Analysis, 21, 683–701.
Zhang, G. P. (2000). Neural networks for classification: A survey. IEEE Transactions on Systems, Man and Cybernetics—Part C: Applications and Reviews, 30, 451–462.
Manuscript first received: March 2009