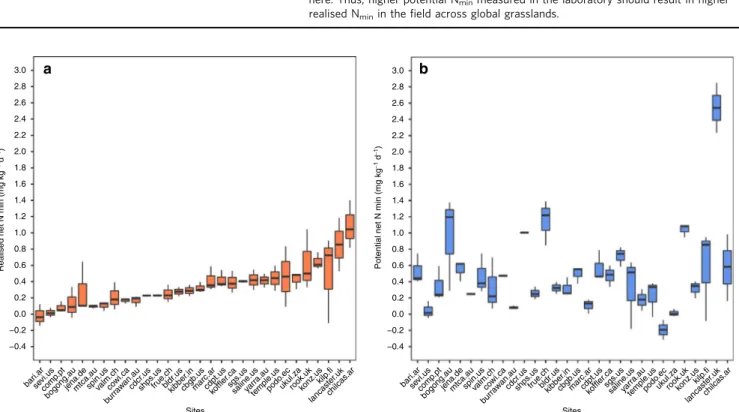
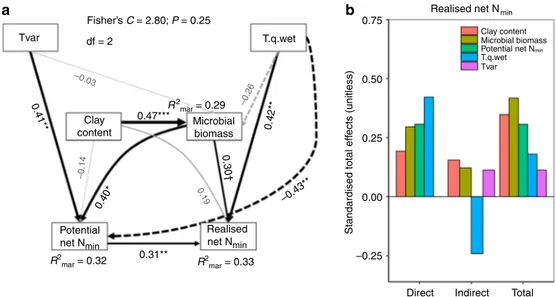
Soil net nitrogen mineralisation across global grasslands
Texto
Imagem


Documentos relacionados
In this trial, the ADD method showed the applicability to profiling and discrimination of soils, and determination of significant environmental factors that explain differences
To verify the influence of soil termite activity on soil characteristics, samples were collected from top, bottom and center of termite mounds, and of the adjacent area, to
Semivariogram models, adjusted for soil moisture, had strong spatial dependence, but the relationship between soil moisture and soil ECa was obtained only in one of the
the soil Nitrogen Availability predictor (sNAp) model predicts daily and annual rates of net N mineralization (NNm) based on daily weather measurements, daily predictions of
The soil samples were used to estimate the soil microbial biomass carbon and nitrogen, soil basal respiration, metabolic quotient and soil enzymatic activity, through hydrolysis
soil moisture, soil temperature, net radiation and heat fluxes (latent, sensible and ground heat fluxes) at land surface. Temperature and moisture of the surface 2.5 cm soil
To compare the biological contents of air to other local habitats, we collected two top soil samples from locations close to the air-sampled buildings (Soil-1 and Soil-2) and a
According to our study, net potential NO fluxes as well as NO production rates, NO consumption coefficients, and net NO release rates displayed the highest values for soil samples
