Universidade de Trás-os-Montes e Alto Douro
Genetic diversity, provenances extrapolation and cytogenetics
analysis of Portuguese Pinus nigra Arn. populations
Dissertação de Mestrado em
Genética Molecular Comparativa e Tecnológica
Maria Franco Rosa Costa de Lemos
Orientador: Professor Doutor José Eduardo Lima-Brito
Co-Orientador: Professora Doutora Maria João Magalhães Gaspar
i
Universidade de Trás-os-Montes e Alto Douro
Genetic diversity, provenances extrapolation and cytogenetics
analysis of Portuguese Pinus nigra Arn. populations
Dissertação de Mestrado em
Genética Molecular Comparativa e Tecnológica
Maria Franco Rosa Costa de Lemos
Orientador: Professor Doutor José Eduardo Lima-Brito
Co-Orientador: Professora Doutora Maria João Magalhães Gaspar
Composição do Júri:
______________________________________________ ______________________________________________ ______________________________________________
iii
This original research was developed to achieve the Master Degree in Molecular Comparative and Technological Genetics (Decreto-Lei nº 74/2006
with the modifications introduced by Decreto-Lei nº 107/2008 and Decreto-Lei nº 230/2009)
v
This dissertation is dedicated to those who never stopped believing in me.
vii
Acknowledgments
This work was developed in the Plant Cytogenomics Lab of Centre of Genomics and Biotechnology (IBB/CGB) at University of Tras-os-Montes and Alto Douro (UTAD). This would not be possible without the help and support of several people and institutions, which I want to sincerely thank:
To the Rector of the UTAD, Professor António Fontainhas Fernandes, Ph.D., the possibility of the realization of my dissertation at this University.
To the Direction of the Master’s degree in Technologic, Comparative and Molecular Genetics, for the accepting of this dissertation.
To the Director of the Master’s degree in Technologic, Comparative and Molecular Genetics, Professor Paula Filomena Martins Lopes, Ph.D, for the availability to any clarification.
To the Professor José Eduardo Lima-Brito, Ph.D, head of the Plant Cytogenomics Lab (IBB-CGB/UTAD), for given me the opportunity to conduct the research in this Lab.
To Dr. Marc Calvignac from Vilmorin S.A., and to Professor Bruno Fady, Ph. D, for kindly given certified seed material and dehydrated needles material of P. nigra, respectively.
To all my teachers, for the transmitted knowledge which gave me bases for the performance and interpretation of this work.
To Professor José Eduardo Lima-Brito, Ph.D, my supervisor and to Professor Maria João Magalhães Gaspar, Ph.D, my co-supervisor, for the orientation of this dissertation, the teachings; the availability for any clarification and for the critical review of the work.
To Dr. Ana Isabel Ferreira de Carvalho, Ph.D, for all the help and teachings, for all time spent in corrections and clarifications, and for the friendship and moments of distraction inside and outside the laboratory.
To Alexandra Dias, MSc., Jani Pires, Eng., Luis Rocha, MSc., João Coutinho, Eng., for the help and the co-work in laboratory.
To Ivo Pavia, MSc., for the help, all advices and friendship. To João Freitas, for the friendship, patience and comprehension.
To Andreia Delgado, Dr., for the help in this dissertation, for being always present and available to me, even when there is no time for anything; for the friendship in good and bad
viii
moments during all the years of this journey that has been the university; and for believing always in me and in my capacities.
To my family, for all the support, love and affection.
ix
Diversidade genética, extrapolação de proveniências e análise citogenética
de populações Portuguesas de Pinus nigra Arn.
Resumo
Durante o século XX instalaram-se povoamentos de Pinus nigra em Portugal. Actualmente, o número de populações Portuguesas de P. nigra alóctones é restrito estando distribuídas por uma área reduzida. A sua origem e taxonomia são desconhecidas. A caracterização botânica destes povoamentos em 1980 revelou a presença das subespécies
nigra, salzmannii e laricio.
Neste estudo pretendeu-se: i) caracterizar molecularmente estas populações alóctones; ii) extrapolar as suas proveniências; iii) determinar a sua taxonomia; iv) caracterizar amostras estrangeiras de diferentes taxa infraespecíficos e proveniências para comparar com as Portuguesas, utilizando marcadores ISSR e SCoT. Portugal constitui o limite mais ocidental de distribuição de P.nigra e Pinus sylvestris L.. Neste estudo objectivou-se ainda a caracterização citogenética de uma população de P.nigra (Campeã) e sua comparação com pinheiro-silvestre (população autóctone da Biduiça) usando as técnicas citogenéticas de FISH com uma sonda de rDNA, de ND-FISH com sondas SSR e de coloração com nitrato de prata.
O estudo de diversidade genética requereu a prévia extração de DNA de P.nigra. Devido ao elevado conteúdo de polissacáridos e polifenóis, o protocolo de extração foi optimizado para DNA de agulhas congeladas e desidratadas, sendo extensível a outros tecidos e espécies.
A caracterização molecular e extrapolação das proveniências das populações de P.nigra (Manteigas, Caminha, Vila Pouca de Aguiar, Vale do Zêzere, Paredes de Coura e Campeã) foram efectuadas em 127 indivíduos com oito primers para amplificação de ISSRs e oito
primers para produção de SCoTs. Foram detetadas uma elevada diversidade genética
intra-populacional (expectável para uma espécie Pinus) e uma estrutura genética definida (agrupamento dos indivíduos por população).
Os perfis genéticos das amostras estrangeiras foram determinados em bulks correspondentes a 120 indivíduos de 12 proveniências, representativos das subespécies (nigra,
salzmannii e laricio) e das variedades (corsicana, calabrica e austriaca) usando ISSRs e
x
A subespécie salzmannii revelou-se geneticamente distante das amostras Portuguesas e restantes estrangeiras. Uma elevada identidade genética foi obtida entre amostras Portuguesas e estrangeiras da subespécie laricio. Os ISSRs evidenciaram maior similaridade genética entre os indivíduos Portugueses e amostras da subsp. laricio var. calabrica enquanto os SCoTs detetaram maior similaridade com a subespécie laricio var. corsicana. Segundo a caracterização botânica de 1980, esta subespécie foi apontada como a melhor adaptada e predominante em Portugal. Como a amplificação de SCoTs se baseia na ligação do primer a uma curta sequência conservada nos genes, consideraram-se estes resultados mais fidedignos. Globalmente, os dois sistemas marcadores demonstraram especificidade para determinar estrutura genética, extrapolar proveniências e discriminar taxa infraespecíficos em P.nigra.
Após ND-FISH observaram-se diferenças na hibridação de SSRs entre P.nigra e
P.sylvestris. A sonda rDNA detetou 14 e 16 loci em P.sylvestris e P.nigra, respetivamente. O
número de nucléolos por núcleo (1 a 12) em ambas as espécies revela que nem todos os loci rDNA estão transcripcionalmente activos. A presença de micronucléolos associada à ocorrência de irregularidades cromossómicas (e.g. cromossomas em anel, policêntricos e fragmentados) sugere que estas populações periféricas ainda estão em adaptação.
Os resultados deste trabalho contribuirão para o delineamento de estratégias de plantação/reflorestação de P. nigra em Portugal.
Palavras-chave: Citogenética; diversidade e estrutura genética, FISH, marcadores
xi
Abstract
During the 20th century, P.nigra stands were installed in Portugal. Currently, the number of Portuguese P. nigra allochthonous populations is restricted being distributed to a small area. Origin and taxonomy of material used are unknown. The botanic characterization of these stands in 1980 revealed the presence of the subspecies nigra, salzmannii e laricio.
In this study, we intend to: i) characterize molecularly these allochthonous populations; ii) extrapolate their provenances; iii) determine their taxonomy; and iv) characterize foreign samples from different infraspecifics taxa and provenances to compare with Portuguese, using ISSR and SCoT markers. Portugal constitutes the limit more occidental of P.nigra and
P.sylvestris distribution. In this study, it was also aimed the cytogenetic characterization of a P.nigra population (‘Campeã’) and their comparison with Scots pine (autochthonous
population of ‘Biduiça’) using the cytogenetic techniques FISH with a ribosomal rDNA probe, ND-FISH with SSR probes and silver nitrate staining.
The genetic diversity study required a previous extraction of P.nigra DNA. Due to the high content of polysaccharides and polyphenols, the extraction protocol was optimized for DNA from frozen and dehydrated needles, and was suitable to other tissues and species.
The molecular characterization and provenances extrapolation of P.nigra populations (‘Manteigas’, ‘Caminha’, ‘Vila Pouca de Aguiar’, ‘Vale do Zêzere’, ‘Paredes de Coura’, ‘Campeã’) were performed in 127 individuals with eight primers to ISSRs amplification and eight for SCoTs production. A high genetic diversity within populations (expectable for a
Pinus species) and a defined genetic structure (clustering of individuals per population) were
detected.
The genetic profiles of foreign samples were determined in bulks corresponding to 120 individuals of 12 provenances representatives of subspecies (nigra, salzmannii and laricio) and varieties (corsicana, calabrica and austriaca) using ISSRs e SCoTs.
The subspecies salzmannii revealed to be genetically distant from the Portuguese and other foreign samples. A high genetic identity was obtained among Portuguese and foreign samples from laricio subspecies. ISSRs evidenced higher genetic identity among the Portuguese and foreign samples from subsp. laricio var. calabrica whereas SCoTs estimated a higher genetic identity with subsp. laricio var. corsicana. According to botanic characterization of 1980, this subspecies was considered the best adapted and prevalent in Portugal. As the SCoTs amplification is based on the binding of primer to a short conserved
xii
sequence in the genes, was considered these results more reliable. Globally, the two marker systems showed specificity for genetic structure determination, provenances extrapolation and infraspecific taxa discrimination of P.nigra.
After ND-FISH, differences in SSRs hybridization between P.nigra and P.sylvestris were observed. rDNA probe detected 14 and 16 loci in P.sylvestris and P.nigra, respectively. The number of nucleoli per interphase nucleus (1 to 12) in both species revealed that not all rDNA
loci were transcriptionally active. The presence of micronucleoli associated to chromosomic
irregularities (e.g. ring, polycentric and fragmented chromosomes) in both species, suggested that these peripheral populations are still in adaptation.
The results of this work will contribute to design strategies for planting/reforestation of
P.nigra in Portugal.
Keywords: Cytogenetics; FISH; genetic diversity and structure; molecular makers; Pinus
xiii
Index
Acknowledgments ... vii Resumo ... ix Abstract ... xi Index ... xiiiIndex of Figures ... xvii
Index of Tables ... xix
List of Abbreviations ... xxi
Layout of this dissertation ... xxv
Chapter I: General Introduction and objectives ... 1
I.1 – The genus Pinus ... 3
I.2 – Pinus nigra species ... 4
I.2.1 – General characteristics and distribution ... 4
I.2.2 – Infraspecific taxonomic classification of P. nigra ... 6
I.2.3 – Economic and ecological importance ... 8
I.2.4 – Reforestation programs ... 9
I.2.4 – Portuguese populations of P. nigra ... 10
I.3 – DNA extraction from tree species: an obstacle to genetic studies ... 11
I.4 – Molecular studies in P. nigra ... 13
I.4.1 – Inter-Simple Sequence Repeat (ISSR) markers ... 15
I.4.2 – Start Codon Targeted (SCoT) markers ... 16
I.5 – Cytogenetics analysis in P. nigra ... 18
I.6 – Objectives ... 20
I.7 – References ... 21
Chapter II: Single protocol for genomic DNA extraction from foliar, dry and vascular tissues of gymnosperms ... 31
II.1 – Abstract ... 33
II.2 – Introduction ... 34
II.3 – Materials and Methods ... 34
II.3.1 – Plant Material ... 34
II.3.2 – Improved Protocol for genomic DNA isolation ... 35
xiv
II.3.4 – Amplification and visualization of ISSR and SCoT markers ... 37
II.3.5 – Amplification of ITS rDNA region in Pinus sp ... 37
II.4 – Results and discussion ... 37
II.5 – Acknowledgements ... 43
II.6 – References ... 44
Chapter III: Genetic profiles of European allopatric subspecies and varieties of Pinus nigra Arn. based on ISSR and SCoT markers ... 47
III.1 – Abstract ... 49
III.2 – Introduction ... 50
III.3 – Materials and Methods ... 53
III.3.1 – Plant material ... 53
III.3.2 –Genomic DNA extraction ... 56
III.3.3 – Amplification of ISSR and SCoT markers ... 56
III.3.4 – Statistical analyses of the molecular data ... 57
III.4 – Results and discussion ... 57
III.4.1 – ISSR and SCoT polymorphism ... 57
III.4.2 – Analyses of genetic relationships, variation and gene diversity ... 62
III.5 – Conclusions ... 68
III.6 – Acknowledgements ... 69
III.7 – References ... 70
Chapter IV: First molecular characterization of the Portuguese populations of Pinus nigra Arnold and extrapolation of their provenances... 77
IV.1 – Abstract ... 79
IV.2 – Introduction ... 80
IV.3 – Material and methods ... 82
IV.3.1 – Plant Material ... 82
IV.3.2 – Genomic DNA extraction... 84
IV.3.3 – Amplification of ISSR and SCoT markers ... 84
IV.3.4 – Statistical analyses of the molecular data ... 85
IV.4 – Results and Discussion ... 87
IV.4.1 – Genetic diversity, relationships and structure of the Portuguese population . 87 IV.4.2 – Extrapolation of provenances ... 97
xv
IV.6 – Acknowledgements ... 103
IV.6 – References ... 104
IV.7 – Supplemental material ... 111
Chapter V: Nucleolar activity, SSR hybridization and chromosome irregularities in peripheral populations of Pinus nigra Arn. and Pinus sylvestris L. ... 113
V.1 – Abstract ... 115
V.2 – Introduction ... 116
V.3 – Material and methods ... 119
V.3.1 – Seeds germination, collection and fixation of root tips ... 119
V.3.2 – ND-FISH and FISH experiments ... 119
V.3.3 – Salt-nylon silver staining technique ... 120
V.4 – Results ... 121
V.4.1 – SSR hybridization patterns ... 121
V.4.2 – rDNA physical localization and number of nucleoli per interphase nucleus 123 V.4.3 – Chromosome irregularities ... 125
V.5 – Discussion ... 127
V.6 – Conclusions ... 131
V.7 – Acknowledgements ... 132
V.8 – References ... 133
Chapter VI: Conclusions and perspectives ... 139
VI.1 – Conclusions and perspectives ... 141
VI.2 – References ... 145
Supplemental Material ... xxvii
Supplement 1 ... xxix
Supplement 2 ... xxxi
Supplement 3 ... xxxiii
xvii
Index of Figures
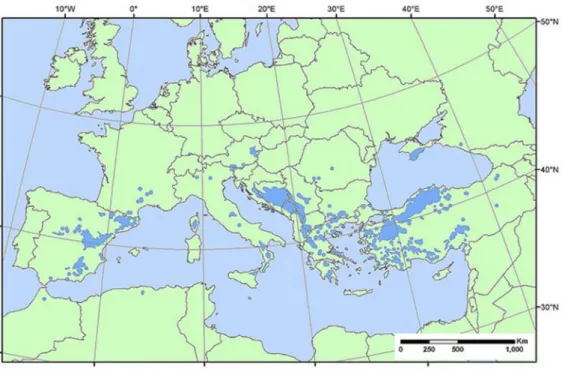
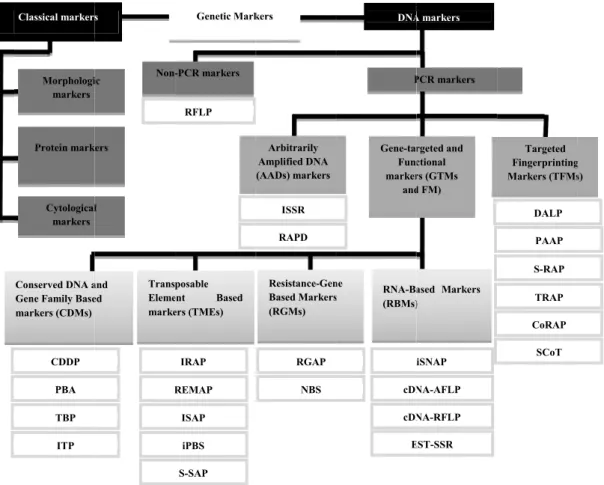
Chapter I:Figure I.1 – Global distribution of P. nigra. (Adapted from EUFORGEN 2009) ... 5 Figure I.2 – Schematic representation of two recent classifications of the genetic and DNA markers proposed by
Xu (2010) and Poczai et al. (2013), respectively. ... 14
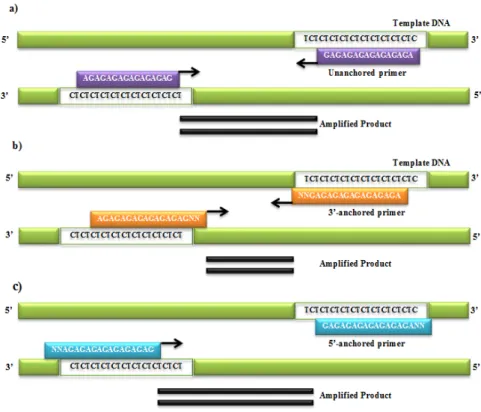
Figure I.3 – Schematic representation of ISSR technique with a single primer (AG)8, unanchored (a), 3’-end anchored (b) or 5’-end anchored (c) targeting a (TC)n repeat, to amplify an ISSR flanked by two inversely oriented (TC)n sequences. ... 16
Figure I.4 – Schematic representation of SCoT markers amplification. ... 17 Chapter II:
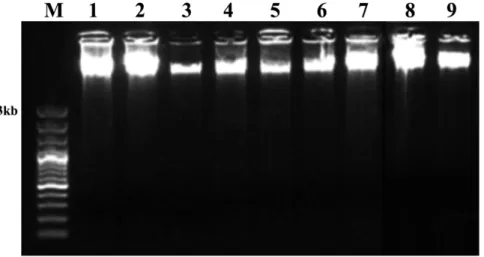
Figure II.1 – Genomic DNA samples isolated from: 1) needles; 2) Ph; and 3) DX of P. pinaster; 4) needles; 5)
DX; 6) Ph of P. sylvestris; 7) frozen and 8) dehydrated needles of P. nigra; and 9) mature leaves of T. baccata, using the optimized protocol. ... 41
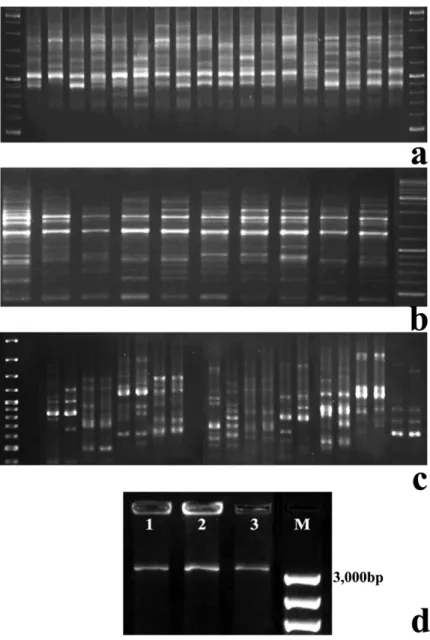
Figure II.2 – Agarose gels stained with ethidium bromide showing: (a) ISSRs amplified with primer 836
(5’-AGAGAGAGAGAGAGAGYA-3’ from the set9/100 of UBC; and (b) SCoTs produced by primer SCoT3 (Collard and Mackill 2009), both in P. nigra individuals; (c) test of SCoT primers (Collard and Mackill 2009) in 20 T. baccata individuals; (d) ITS rDNA amplicons with ca. 3,000bp, obtained in P. pinaster (1), P. sylvestris (2) and P. nigra (3). ... 42
Chapter III:
Figure III.1 – ISSR markers amplified with primer 835 (a) and SCoT markers produced by primer SCoT3,
showing polymorphic patterns among the 12 P. nigra bulked DNA samples of different provenances (b) ... 61
Figure III.2 – UPGMA dendrogram of genetic similarity among the 12 P. nigra bulked DNA samples from
different provenances, calculated with the DICE coefficient and based on the pool of ISSR and SCoT data. ... 63
Figure III.3 – Principal Coordinates Analyses (PCoA) based on the Nei’s genetic distance matrix constructed
with the pooled ISSR and SCoT data ... 65
Figure III.4 – Unrooted tree based on the Nei’s unbiased measures of genetic identity and distance (Nei 1978)
constructed with the TreeView software ... 67
Chapter IV:
Figure IV.1 – Polymorphic ISSR patterns among 31 P. nigra individuals from ‘Vila Pouca de Aguiar’ and
‘Caminha’ populations, produced with primer 835 (a), and polymorphic SCoT patterns among 18 P. nigra individuals from the ‘Paredes de Coura’ population amplified with primer SCoT3 (b) ... 89
Figure IV.2 – UPGMA dendrogram of genetic similarity among the 127 P. nigra individuals based on the pool
of the ISSR and SCoT data, with all individuals clustered into six groups (I to VI), corresponding to the number of studied populations ... 93
xviii
Figure IV.3 – Bar plot diagram provided by the STRUCTURE software estimating the genetic structure of the
Portuguese populations of P. nigra into six populations (K=6) based on the pool of the ISSR and SCoT data .... 95
Figure IV.4 – Principal Coordinates Analysis (PCoA) based on the Nei’s genetic distance matrix among the 127
Portuguese individuals and the seven DNA bulks of foreign P. nigra samples based on the pool of ISSR (a) and SCoT (b) data ... 102
Figure IV.S1 – UPGMA dendrogram of genetic similarity among the Portuguese and foreign P. nigra
individuals based on the pool of the ISSR and SCoT data. ... 111
Chapter V:
Figure V.1 – Mitotic chromosomes of P. nigra (a and c) and P. sylvestris (b) after ND-FISH performed with the
SSR probes: (a and b) (GACA)4 (red); and (c) (AG)10 (green) ... 122 Figure V.2 – Mitotic cells of P. sylvestris (a, c, f) and P. nigra (b, d, e, g) after FISH (a, b) and silver staining (c,
d, e, f, g). ... 124
Figure V.3 – Variable number of nucleoli scored per interphase nucleus after silver nitrate staining in P. nigra
(black bar) and P. sylvestris (white bar) individuals ... 125
Figure V.4 – Prometaphase cells of P. nigra (a) and P. sylvestris (b) counterstained with DAPI presenting: (a) an
acentric chromosome fragment (white arrow), a centric fragment (green arrow) and a polycentric chromosome (yellow arrow), among others in the same cell; (b) an acentric chromosome fragment (white arrow), an example of a polycentric chromosome (yellow arrow), and two chromatin bridges between different chromosomes (orange arrows) ... 126
xix
Index of Tables
Chapter I:Table I.1 – Infrageneric taxonomical classification of Pinus accordingly Gernandt et al. (2005) (Adapted from
Wang et al. 2013) ... 3
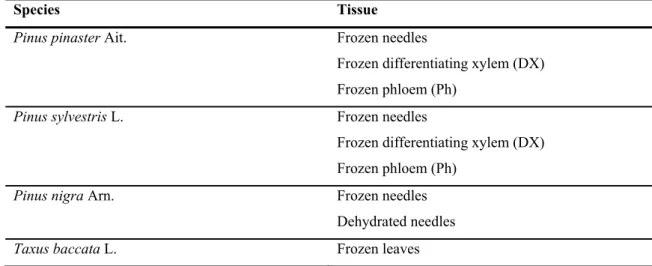
Chapter II:
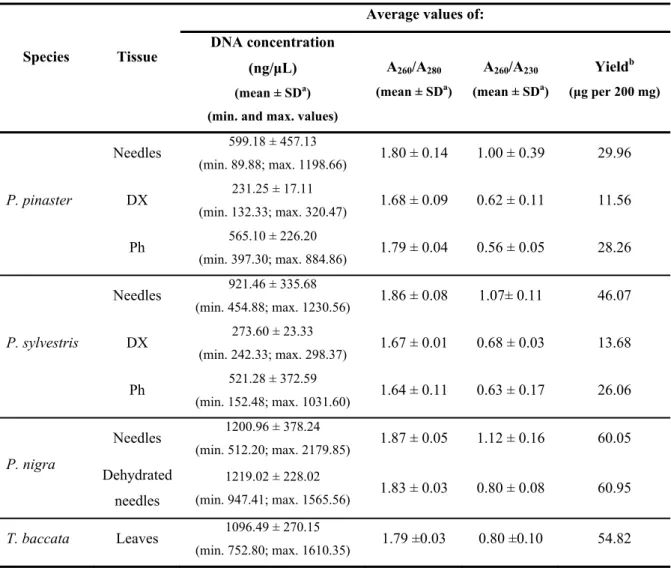
Table II.1 – Gymnosperm species and respective tissue(s) tested in the optimized DNA extraction protocol ... 35 Table II.2 – Average concentration, purity (A260/A280 and A260/A230) and yield values of the DNA samples isolated with the optimized extraction protocol ... 39
Chapter III:
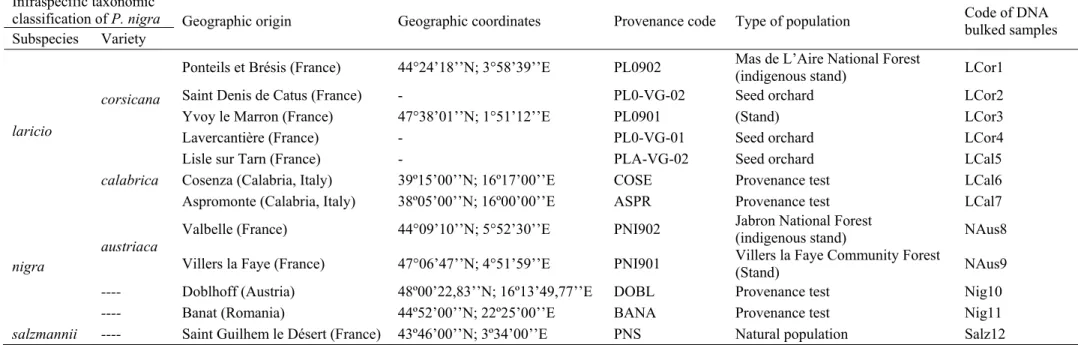
Table III.1 – Characterization of the plant material used in this study: infraspecific taxonomic classification
(accordingly Gaussen et al. 1964; 1993), geographic origin and coordinates, provenance code, type of population where the samples were harvested, and code of the DNA bulked samples ... 55
Table III.2 – Number of total amplified bands (T), monomorphic bands (M), polymorphic bands (P), exclusive
bands (E), percentage of polymorphism (%P) and range size (R) of ISSR and SCoT markers amplified per primer. Note:*Y=C or T ... 58
Table III.3 – Infraspecific taxa and respective bulked DNA samples that presented exclusive polymorphic ISSR
and SCoT markers with different molecular weight (bp) ... 59
Table III.4 – Monomorphic ISSR and SCoT bands amplified in the 12 DNA bulked samples of P. nigra ... 62 Table III.5 – Nei’s unbiased measures of genetic distance (below diagonal) and identity (above diagonal) among
the P. nigra infraspecific taxa calculated by the Nei’s method (Nei 1978) ... 66
Chapter IV:
Table IV.1 – Number and average dendrometric measurements of the P. nigra individuals sampled in each
population. ... 83
Table IV.2 – Taxonomic classification (according to Gaussen et al. 1964; 1993) of the foreign samples of P.
nigra, sampling local and respective code used in this study ... 84
Table IV.3 – Primers used for the amplification of ISSRs and SCoTs, respective sequences, number of total
amplified (T), polymorphic (P) and monomorphic (M) bands, percentage of polymorphism (%P) and average polymorphism information content (PIC) produced per primer. ... 88
Table IV.4 – Mean FST values per group achieved with K = 6 using the STRUCTURE software based on the pool of ISSR and SCoT data ... 95
Table IV.5 – Summary of genetic variation and gene diversity statistical analyses achieved per population based
on the pool of the ISSR and SCoT data ... 97
Table IV.6 – Pairwise matrix of Nei’s genetic identity among the Portuguese P. nigra populations and foreign
xx
Table IV.7 – Pairwise matrix of Nei’s genetic identity among the Portuguese P. nigra populations and foreign
samples representative of four distinct infraspecific taxa, based on the pool of the SCoT data ... 100
Chapter V:
Table V.1 – Number of hybridization signals of each SSR probe that successfully hybridized in mitotic
xxi
List of Abbreviations
4xT – Detection buffer composed by 4xSSC and 0.05% Tween-20 A – Absorbance
AADs – Arbitrary Amplified DNA markers
AFLP – Amplified Fragment Length Polymorphism Ait. – Aiton
AMOVA – Analysis of Molecular Variance Arn. – Arnold
bp – base pair
BSA – Bovine Serum Albumin C – Nuclear DNA content (C-value)
CDDP – Conserved DNA-Derived Polymorphism
CDMs – Conserved DNA and Gene Family Based markers cDNA – complementary DNA
cDNA-AFLP – complementary DNA - Amplified Fragment Length Polymorphism cDNA-RFLP – complementary DNA - Restriction Fragment Length Polymorphism cDNA-SCoT – complementary DNA - Start Codon Targeted Polymorphism
CGB – Centre of Genomics and Biotechnology CIA – Chloroform: Isoamyl alcohol 24:1
CoRAP – Conserved Region Amplification Polymorphism cpDNA – chloroplastidial DNA
cpSSRs – chloroplastidial Simple Sequence Repeats CTAB – Cetyltrimethylammonium bromide
DALP – Direct Amplification of Length Polymorphisms DAPI – 4',6-Diamidino-2-Phenylindole, Dihydrochloride
DAMD-PCR – Directed Amplification of Minisatellite-region DNA polymerase chain
reaction
DBH – Diameter at the Breast Height DNA – Deoxyribonucleic acid
dNTP – deoxynucleotide triphosphate solution mix dUTP – Deoxyuridine triphosphate
EDTA – Ethylenediaminetetraacetic acid
EST-SSR – Expressed Sequence Tag-Simple Sequence Repeat E.U. – European Union
FCT – Fundação para a Ciência e a Tecnologia FEDER – European Fund of Regional Development FISH – Fluorescence In Situ Hybridization
FRM – Forest Reproductive Material
FM – Functional Markers
Gbp – Giga base pair
GTM – Gene-Targeted Markers
GRIN – Germplasm Resources Information Network I – Shannon’s information index
iPBS – inter-Primer Binding Site
IRAP – Inter-Retrotransposon Amplified Polymorphism ISAP – Inter-SINE Amplified Polymorphism
xxii iSNAP – inter Small RNA Polymorphism ISSR – Inter-Simple Sequence Repeat ITP – Intron-Targeting Polymorphism ITS – Internal Transcribed Spacer kb – kilobase
MAS – Markers Assisted Selection MCMC – Markov Chain Monte Carlo Mya – Million years ago
NBS – Nucleotide Binding Site profiling ND-FISH – Nondenaturating FISH NTSYS – Numerical Taxonomy System nSSRs – nuclear microsatellites
ON – overnight
PAAP – Promotor Anchored Amplified Polymorphism PBA – cytochrome P450 Based Analogues
PCoA – Principal Coordinates Analysis PCR – Polymerase Chain Reaction PIC – Polymorphic Information Content
PVP-40 – Polyvinylpyrrollidone; molecular weight 40,000 QTL – Quantitative Trait Loci
r – correlation coefficient
RAPD – Random Amplified Polymorphic DNA RBMs – RNA-Based Markers
rDNA – ribosomal DNA
REMAP – Retrotransposon-Microsatellite Amplified Polymorphism RFLP – Restriction Fragment Length Polymorphism
RFLP cpDNA – Restriction Fragment Length Polymorphism of chloroplast DNA RGAP – Resistance-Gene Analog Polymorphism
RGMs – Resistance-Gene based Markers RT – Room Temperature
SAHN – Sequential Agglomerative Hierarchical Nested
SCoT – Start Codon Targeted SDS – Sodium Dodecyl Sulfate SM – Simple Matching
SNP – Single Nucleotide Polymorphism
S-RAP – Sequence-Related Amplified Polymorphism S-SAP – Sequence-Specific Amplification Polymorphism SSC – Saline Sodium Citrate buffer
SSR – Simple Sequence Repeat Subsp. – Subspecies
Taq –Thermus aquaticus (DNA polymerase) TBE – Tris-Borate-EDTA
TBP – Tubulin Based Polymorphism TE – Tris-EDTA buffer solution
TFM – Targeted Fingerprinting Markers TMEs – Transposable Element Based markers TRAP – Targeted Region Amplified Polymorphism UBC – University of British Columbia
xxiii USDA – United States Department of Agriculture UTAD – University of Tras-os-Montes and Alto Douro
xxv
Layout of this dissertation
This dissertation is constituted by six chapters: Chapter I – General introduction and Objectives; Chapter II to Chapter V corresponding to scientific articles (see below) submitted to international journals with peer review and belonging to the Scientific International Index; and Chapter VI to the Conclusions and perspectives of the developed research.
Lemos M, Dias A, Carvalho A, Delgado A, Pavia I, Coutinho J, Gaspar MJ, Coutinho J, Louzada JL, Lima-Brito J (2015) Single protocol for genomic DNA extraction from foliar, dry and vascular tissues of gymnosperms suitable for genetic studies. Paper Submitted to
Wood Science and Technology. (Chapter II)
Dias A, Lemos M, Carvalho A, Fady Bruno, Louzada JL, Gaspar MJ, Lima-Brito J (2015) Genetic profiles of European allopatric subspecies and varieties of Pinus nigra Arn. based on ISSR and SCoT markers. Paper Submitted to Plant Systematics and Evolution. (Chapter III)
Lemos M, Dias A, Carvalho A, Gaspar MJ, Coutinho J, Louzada JL, Lima-Brito J (2015) First molecular characterization of the Portuguese populations of Pinus nigra Arnold and extrapolation of their provenances. Paper Submitted to Plant Molecular Biology
Reporter. (Chapter IV)
Lemos M, Carvalho A, Pavia I, Delgado A, Gaspar MJ, Lima-Brito J (2015) Nucleolar activity, SSRs hybridization and chromosome irregularities in peripheral populations of Pinus
1
Chapter I:
3
I.1 – The genus Pinus
Pines are the most important group of conifers (Vidaković 1991; Vargas-Mendoza et
al. 2011) and belong to the genus Pinus (family Pinaceae).
Pinus is one of the largest existent gymnosperm genus, including more than 100
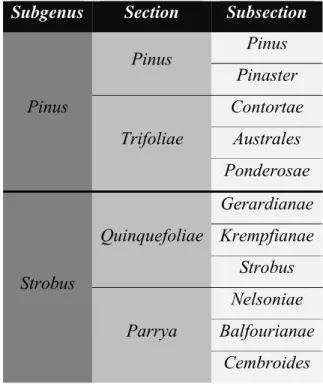
species distributed across the Northern Hemisphere (Mirov 1967; Vidaković 1991). Pine species typically inhabit the boreal, temperate and mountainous tropical regions (Vidaković 1991). According to Gernandt et al. (2005), the genus Pinus can be divided into two subgenera Pinus and Strobus, each one with two sections and several subsections. The subgenus Pinus includes the sections Pinus and Trifoliae while the subgenus Strobus is composed by the Parrya and Quinquefoliae sections (Gernandt et al. 2005) (Table I.1). Nonetheless, the taxonomy of the genus Pinus is still incomplete for many taxa (Nkongolo et
al. 2002).
Table I.1 – Infrageneric taxonomical classification of Pinus accordingly Gernandt et al. (2005). (Adapted from
Wang et al. 2013).
Subgenus Section Subsection
Pinus Pinus Pinus Pinaster Trifoliae Contortae Australes Ponderosae Strobus Quinquefoliae Gerardianae Krempfianae Strobus Parrya Nelsoniae Balfourianae Cembroides
Pinus species have been widely planted over the world (Richardson 1998a,b; Zlatanov et al. 2010), and since the 19th century they have been widely used for reforestation and land restoration (Zlatanov et al. 2010). Furthermore, their ecological and forest roles have been
4
widely studied in their native areas but also over the distribution range of their introduction (Richardson 1998a,b).
Some authors pointed out the existence of different pine species in Portugal, namely as mountain pines, Pinus sylvestris L., Pinus nigra Arn., Pinus uncinata Ramond ex DC and most predominantly, Pinus pinaster Ait. (Figueiral 1995; Figueiral and Carcaillet 2005).
In this dissertation was studied Portuguese P. nigra Arn. populations using both molecular and cytogenetic approaches.
I.2 – Pinus nigra species
I.2.1 – General characteristics and distribution
Pinus nigra Arnold (European Black Pine) is a conifer of the family Pinaceae (Mirov
1967; Price et al. 1998; Nkongolo and Mehes-Smith 2012) that is considered as a relict species (Mirov 1967; Vidaković 1991).
P. nigra populations have been subjected to different glacial and interglacial episodes
of climatic change and geological events (Thompson 2005) which coupled in part with anthropogenic disturbance contributed for the actual discontinuous and fragmented distribution of the European Black Pine (Ozenda 1975, 1985; Dobrinov 1983; Isajev et al. 2004; Naydenov et al. 2006; Esteban et al. 2012).
Despite being native of Europe and Asia (Rezzi et al. 2001), P. nigra is widespread through an area of 230,000 ha (Tolun et al. 2000; Gerber et al. 2005; Afzal-Raffi and Dodd 2007) that extends from North Africa through the Northern Mediterranean, from eastwards to the Black Sea and also can be found on the islands of Corsica and Sicily (Lee 1968; Afzal-Raffi and Dodd 2007) (Fig. I.1). P. nigra can be found in a wide range of environmental conditions (Naydenov et al. 2006), being tolerant to poor soils and supporting a wide range of climates across its geographical range (Lee 1968; Arbez and Miller 1971; Debazac 1971). Moreover, P. nigra is a light-demanding species (Vidaković 1991; Isajev et al. 2004), intolerant to shade but resistant to wind and drought (Isajev et al. 2004).
This species is usually found at altitudes ranging from 250 to 1,400m (Vidaković 1991) but its optimal range is between 800 and 1500m (Isajev et al. 2004). Generally, it can be found at high mountains zones (Specht et al. 1988), on low elevation mountains around the Mediterranean basin (Naydenov et al. 2006) or at the sea level along the shores of the
5
Adriatic Sea (Lee 1968). Unfortunately, its habitat in low elevation forests has been highly affected by human habitation for millennia (Ozenda 1975, 1985; Dobrinov 1983).
Figure I.1 – Global distribution of P. nigra. (Adapted from EUFORGEN 2009).
European Black Pine has a fast early growth, reaching up to 30m (rarely 40-50m) of height and its trunk is usually straight (Isajev et al. 2004). The bark color ranges from light grey to dark grey-brown (Pedro 1993; Isajev et al. 2004). The sexual maturity of European Black Pine is achieved after 15-20 years in natural habitat.
The natural and fragmented distribution of P. nigra contributed for the high variability of morphological, anatomical and physiological traits (Scaltsoyannes et al. 1994) among different regions. This high variability, also at genetic level, allowed the attribution of different taxonomic names which resulted on an infraspecific taxonomic classification that is still debated after several years. Thus, several authors proposed the occurrence of allopatric subspecies, varieties and/or races of P. nigra through the range of its natural distribution. Consequently, three groups could be assigned: i) the Eastern group, including the subspecies
pallasiana (Lamb.) Holmboe; ii) the Central group composed by the subspecies nigra,
subspecies laricio (Poiret) Maire and subspecies dalmatica (Vis.) Franco; iii) the Western group only represented by the subspecies salzmannii (Dunal) Franco (Esteban et al. 2012).
6 I.2.2 – Infraspecific taxonomic classification
Due to its widespread distribution, P. nigra is also named as Austrian Pine, Australian Pine, Corsican Pine, Crimean Pine or Pyrenees Pine (Isajev et al. 2004; Afzal-Raffi and Dodd 2007). More than one hundred Latin synonymous names were given to this species (Wright and Bull 1962; Akkemik et al. 2010) and 81 races and geographic varieties were ascribed to this species (Wheeler et al. 1976). The excessive number of described scientific names for P.
nigra is due to the very narrow rank attribution for each taxon (species, subspecies or variety),
being often issue of discussion. Besides, there was never concordance about the limits and names of varieties or geographical races (Wheeler et al. 1976) and some authors reported the difficulty in distinguish between subspecies and varieties (Bonnet-Masimbert and Bikay-Bikay 1978). Additionally, not all of the different scientific names are accepted by the International Code of Nomenclature for Algae, Fungi and Plants.
P. nigra has a complex botanic classification and some authors considered it as a
collective species or an aggregate of microgeographic species due to the high morphological, physiological and ecological variability found among different geographical locations (Villar 1947; Gaussen 1960; Arbez and Millier 1971; Pajares and Escudero 1989; Blanco 1998; Richardson 1998b). However, other authors have proposed its botanic division (Schwarz 1938; Delevoy 1949; Mirov 1967). Since then, several revisions of its infraspecific taxonomic classification have been proposed resulting on a division of P. nigra into two to nine subspecies and respective allopatric varieties (e.g. Delevoy 1949; Debazac 1963; 1964; 1965; 1971; Gaussen et al. 1964; Mirov 1967; Vidaković 1974; 1991; Farjon 1984; Gaussen and Heywood 1993; Christensen 1997; Barbéro et al. 1998; Price et al. 1998; Tolun et al. 2000). Nonetheless, the infraspecific genetic structure of P. nigra still is not entirely known over its whole area of natural distribution (Naydenov et al. 2006).
This taxonomic problem increased with the existence of transitional forms resultant from cross hybridization between subdivisions of P. nigra and from efficient gene flow (Vidaković 1974; 1991). In addition to the incongruency about the number and designation of the P. nigra subspecies and/ or varieties, there is not also a complete concordance about their geographical distribution (Delevoy 1949; Wright and Bull 1962; Gellini 1968; Lee 1968; Arbez and Millier 1971, Afzal-Rafii and Dodd 2007). Additionally, the geographic or allopatric groups are inter-fertile (Vidaković 1991; Isajev et al. 2004), probably due to their common phylogenetic origin, increasing the classification issues (Delevoy 1949; Wright and
7
Bull 1962; Gellini 1968; Lee 1968; Arbez and Millier 1971; Isajev et al. 2004; Afzal-Rafii and Dodd 2007).
The infraspecific taxonomic classification of P. nigra has been debated since long time ago and remains unclear probably due to the: i) absence of a study covering the whole distribution range of the species; ii) impossibility of integrating results of certain areas; iii) high variability of traits which have been used so far (Liber et al. 2003). Presently, its infraspecific taxonomic classification is still not unanimously accepted (Scaltsoyiannes et al. 1994; Naydenov et al. 2006; Afzal-Raffi and Dodd 2007; Bogunić et al. 2007; del Cerro Barja et al. 2009). Nevertheless, most of the infraspecific taxonomic classifications proposed so far, considered five P. nigra subspecies, namely, dalmatica, laricio, nigra, pallasiana and
salzmannii (Gaussen et al. 1964; 1993; Vidakovic 1974; Farjon 1998; 2010; 2013; Price et al.
1998). Vidakovic (1974) agreed with the classification of Gaussen et al. (1964) published in the Flora Europaea, but reported the existence of the subspecies salzmannii in the North Africa. This modification as well as the consideration of five P. nigra subspecies were maintained by Gaussen et al. (1993) and Farjon (2013). Although some studies were in agreement with the classification used (Scaltsoyiannes et al. 1994; Gerber et al. 1995), others presented some inconsistencies (Delevoy 1949; Arbez and Miller 1971; Liber et al. 2002; 2003; Giovannelli et al. 2014). Globally, these studies revealed high variation among the studied P. nigra populations that could be favored by the widespread and fragmented distribution of the species, mostly in Europe. The high number of common and scientific names attributed to P. nigra, corroborate the idea that this species is be extremely variable. However, such degree of variation is not uncommon if compared with other conifers widely distributed or with the degree of genetic diversity of other Pinus species (Scaltsoyiannes et al. 1994).
Considering all the reasons presented above, the taxonomic classification of P. nigra needs to be revised, as proposed by Giovannelli et al. (2014). These authors tried to study molecularly the maximum possible number of P. nigra subspecies considered taxonomically diverse in order to solve their phylogeny. After amplification and alignment of the sequences of the barcoding genes Cox1, MatK, Rbcl, Trnh and Nad 5-4, no differences were detected among subspecies (Giovannelli et al. 2014). Otherwise, the use of nuclear microsatellites (nSSRs), chloroplastidial SSRs (cpSSRs) and detection of Single Nucleotide Polymorphisms (SNPs) allowed the grouping of the subspecies pallasiana and nigra into the Eastern group, and the subspecies mauretanica and salzmannii in the Western group (Giovanelli et al. 2014).
8
The subspecies laricio included two varieties corsicana (related with the Western group) and
calabrica (related to the Eastern group). However, the classification of the subspecies into
three main groups also differed among authors. According to Lucas Borja et al. (2013), three core populations could be considered in the actuality: i) the Western group enclosing the subspecies pallasiana (Lamb.) Holmboe; ii) the central group nigra containing the subspecies
nigra, laricio (Poiret) Maire and dalmatica (Vis) Franco; and iii) the Eastern Group composed
by the subspecies salzmannii.
Over the years, the taxonomic classification of P. nigra, namely at infraspecific level, has been considered an unsolved question which still needs to be carefully analyzed based on other tools since its definition could be highly useful for the designing of conservation and reforestation strategies with economic and ecological importance.
In the present study, the infraspecific taxonomic classification of P. nigra proposed by Gaussen et al. (1964; 1993) in the Flora Europaea, which divided the Mediterranean P. nigra into five subspecies: laricio, nigra, pallasiana, salzmannii and dalmatica will be considered. In addition to these five Mediterranean subspecies, a sixth one, designed as mauretanica, was locally ascribed to the Northern Africa (Greuter et al. 1984; Barbéro et al. 1998).
I.2.3 – Economic and ecological importance
European Black Pine is one of the most economically important native conifers in Southern Europe (Isajev et al. 2004; Naydenov et al. 2006) due to their wood properties namely easy to process, durable and rich in resin (Espelta 1999; Isajev et al. 2004). Because of the variability among the P. nigra subspecies, their wood and sub-products have different applications. For example, subspecies laricio has straightness and thin branches, being appreciated for building and roofing, while the subspecies nigra has lower quality, being used to lower-grade building wood and the making of crates (Isajev et al. 2004). P. nigra have been used as Christmas tree, for fuel wood and poles (Isajev 2004). In many areas, it is one of the most important trees for timber production (Lee 1968). In the United States of America, P.
nigra is mainly used for shelterbelts (Van Haverbeke 1990) and used as ornamental (Isajev et al. 2004). Moreover, P. nigra is also used with medicinal purposes (Tzulac and Erol 1999).
The turpentine extracted from resin of P. nigra has been used due to their antiseptic effects on respiratory system and urinary diseases, for back pain, dermatologic, analgesic drug and as natural antioxidant (Gülçin et al. 2003). Additionally, the oil of P. nigra subspecies laricio revealed to be an efficient herbicidal (Amri et al. 2014).
9
This species is also ecologically important as carbon storage, protection against erosion and recreational activities, being able to colonize several ecological niches and evidencing its high adaptive capacity to different environments (Espelta 1999). Moreover, P.
nigra plays a leading role in different stages of forestry ecological successions (Zaghi 2008).
Forest ecosystems of P. nigra are usually affected by crown fires. Furthermore, the regeneration after severe crown fire is reduced or almost null in this species; due to the fact of
P. nigra neither produces serotinous cones nor maintain a seed bank. For that reason, P. nigra
species represent a European priority on conservation (Christopoulou et al. 2013). The Mediterranean forests of P. nigra are included in the E.U. list of endangered natural habitats that require specific conservation measures (Resolution 4/1996 by the Convention on the Conservation of European Wildlife and Natural Habitats) (del Cerro Barja et al. 2009).
I.2.4 – Reforestation programs
In the last century, P. nigra was target of a high demand for plantation throughout its range of natural distribution. Due to its enormous adaptive plasticity, European Black Pine was the favorite species for reforestation projects over a wide range of environments, once this species has the ability to develop well on open lands and in ecologically demanding situations (Isajev et al. 2004).
Currently, P. nigra has been used in reforestation programs throughout its natural distribution (Naydenov et al. 2006) and represents an important pine species in forest management of Mediterranean areas (Bogunić et al. 2007). This is a result of its commercial interest, characteristics and adaptability to a wide range of environmental conditions. However, these planting strategies did not care about the genetic structure of the existent plantations and that of the new specimens. These facts could threaten the genetic diversity of
P. nigra populations (Naydenov et al. 2006).
Some issues are very important to take into account during P. nigra plantations (both for conservation and reforestation programs), such as: global warning, site, altitude, slope, soil, forestry treatments (Sevgi and Akkemik 2007) and genetic structure of populations (Naydenov et al. 2006). This species is one of the most used for afforestation of arid and rocky terrains in the sub-Mediterranean region (Vidaković 1991) and it is widely planted in Central and Southern Europe in areas with poor soils (Luchi et al. 2005). P. nigra has been widely planted outside its natural range and has been showing promising results in New Zealand, Great Britain, France, Belgium, Argentina, United States of America and Portugal
10
(Lee 1968; Louro 1982). However, during the reforestation programs, it should be present that intraspecific hybridization can easily occur among different subspecies of European Black Pine, being important to avoid the plantation of P. nigra of unknown origin in the proximity of autochthonous pinewoods to reduce the risk of genetic pollution. Most of the plantations of
P. nigra realized in Europe, were performed with material from unknown origin, being highly
important to identify autochthonous populations in order to develop correct afforestation programs (Isajev et al. 2004; Zaghi 2008).
I.2.5 – Portuguese populations of P. nigra
During the middle of the 20th century, P. nigra was planted in Portugal (Louro 1982). The origin of the plant material used in these plantations is unknown in terms of provenance or infraspecific taxonomic classification. Presently, a few P. nigra allochthonous populations, with reduced size, are restricted to the North and Center of the country. Louro (1982) attempted to characterize these populations based on multidisciplinary data: dendrometric; botanical; natural regeneration ability; technological qualities; morphological and anatomical traits; evaluation of the phytosanitary status and edaphoclimatic conditions; and seed production/yield. The author tried to extrapolate about the origin of the seed material used in the plantation of these allochthonous pinewoods by characterizing the existent P. nigra stands in that decade. According to Louro (1982), three different subspecies of P. nigra existed in Portugal: subspecies nigra, subspecies salzmannii, and subspecies laricio (var. calabrica and var. corsicana) as the most predominant. Fabião and Oliveira (2006) indicated the presence of the same subspecies and also presumed laricio as the most frequent in Portugal. Louro (1982) focused his work on P. nigra subsp. laricio and highlighted that, regarding all aspects under study, P. nigra subsp. laricio var. corsicana seemed to had a more tendentiously favorable behavior comparatively to the other two subspecies (nigra and salzmannii).
Louro (1982) related that in the periods 1971-1975 and 1980-1981, about half the area of P. nigra subsp. laricio at North of the ‘Douro’ region had fired. In 1982, P. nigra subsp.
laricio was considered an expansion species in Portugal, with an area of 9,000ha of which
6,000ha corresponded to young specimens (10 years or less). Moreover, the oldest stands had little more than 60 years at that time. This subspecies was found in several nuclei from ‘Trás-os-Montes’ to the North of ‘Tejo’ in pure or mixed stands, being almost all adults at the North of Portugal. The P. nigra subsp. laricio was found in soils generally composed by granites and schist at altitudes ranging from 400 to 1,600m. The evaluation of the plant development
11
and dendrometric data obtained in the 1980’s, revealed that P. nigra was a well-adapted species. Despite the high adaptive potential, this species was always pointed out as problematic in terms of ability of natural regeneration. Louro (1982) only found evidences of natural regeneration in stands of ‘Serra da Padrela’ (subsp. laricio var. corsicana); ‘Serra da Estrela (Covais)’ (subsp. laricio var. calabrica and var. corsicana); ‘Serra da Estrela (Nave)’ (subsp. laricio var. calabrica and var. corsicana), ‘Serra da Garraia’ (subsp. laricio var.
calabrica and var. corsicana) and ‘Serra da Nogueira (Vilar d’Ouro)’ (mixed stand composed
by subsp. laricio var. corsicana and P. sylvestris).
Marques et al. (2012) only reported the existence of P. nigra subsp. laricio in Portugal, but with a smaller distribution area comparatively to the earlier study of Louro (1982).
Presently, the provenance of the seeds used in the plantation of the Portuguese P.
nigra stands is still unknown. Additionally, no molecular studies of these allochtonous
populations were developed in that sense and no information about their genetic diversity level is available. This study could help to answer to these molecular issues, taking into account the reduced distribution area and number of P. nigra stands in Portugal, which put this species in risk due to the occurrence of ongoing climatic change and forest fires, for further development of conservation and reforestation strategies.
I.3 –
DNA extraction from tree species: an obstacle to genetic studies
Despite the need of genetic diversity characterization of P. nigra populations for reforestation and conservation strategies, other goals of the genetic studies performed in such pine species are related with its ambiguous taxonomic classification at the infraspecific level and with the search or identification of molecular markers suitable for population genetics studies.
However, before the development of the genetic diversity study in the Portuguese populations of P. nigra it was need to optimize the procedure of DNA extraction because pines constitute hard species for achieving genomic DNA of high quality due to presence of high amounts of endogenous tannins, phenolics and polysaccharides (Tibbits et al. 2006). These compounds are DNA contaminants and difficult the isolation of sufficient yield of high quality DNA (Khanuja et al. 1999; Tibbits et al. 2006; Ivanova et al. 2008). Polysaccharides
12
and tannins are difficult to separate from DNA (Murray and Thompson 1980) and polyphenols are a powerful oxidizing agent, reducing the yield and purity of DNA (Loomis 1974; Porebski et al. 1997). Moreover, the conifers have large size genomes that require isolation methods that minimize DNA degradation during the cells disrupting (Keller and Manak 1993; Muralitharan et al. 1994).
The extraction of total genomic DNA from a given sample constitutes a crucial and limiting step to any plant molecular study (Semagn et al. 2006; Ivanova et al. 2008). DNA can be extracted from fresh, lyophilized, preserved or dried samples, but fresh material is ideal for obtaining good quality DNA (Semagn et al. 2006). In order to obtain reproducible results, DNA must have high quality, high concentration and free of contaminants. The fidelity of results increase with DNA purity ratio, since contaminated nucleic acid often fails to give precise, reliable and reproducible results (Varma 2007). Furthermore, degraded and/ or unpurified DNA may affect subsequent molecular reactions, such as amplification, DNA digestion and cloning (Tibbits et al. 2006; Kumar et al. 2009) and can cause DNA degradation after long-term storage (Porebski et al. 1997; Schlink and Reski 2002; Sharma et
al. 2002). The difficulty of separate DNA from co-extraction contaminants is a problem in the
most cases, requiring many cleaning steps. Usually, repeated extractions are realized with organic solvents such as phenol, phenol-chloroform-isoamyl alcohol (25:24:1) and chloroform, followed by DNA precipitation with salt solutions (Tibbits et al. 2006). Cleaning steps of isolated DNA require long time to be effective, being limitative in molecular genetic studies involving hundreds of samples (Tibbits et al. 2006), and also decrease the DNA yield.
Many protocols for DNA extraction from various plant species and tissues have been published (Tibbits et al. 2006). However, they are typically time consuming and the quality of DNA obtained can be unpredictable, due to incomplete removal of PCR inhibitors (Ivanova et
al. 2008). Frequently in tree species, it has been used extraction buffers containing
cetyltrimethylammonium bromide (CTAB) (Murray and Thompson 1980; Doyle and Doyle 1987; Wagner et al. 1987) suggesting the utility of this reagent in DNA extraction. Other components such as soluble polyvynilpirrolidone (PVP-40) (Stewart and Via 1993; Devey et
al.1996; Kim et al. 1997), SDS (sodium dodecyl sulfate) (Nelson et al. 1994; Jobes et al.
1995) and guanidine detergent (Lin and Kuo 1998) have also been suggested; despite the latter two revealed to be less effective in trees species, especially in pines (Tibbits et al. 2006).
13
The biochemical composition differs considerably among plant tissues and species (Khanuja et al. 1999). However, a universal procedure for DNA extraction does not exists justifying the high number of optimized protocols for DNA isolation from several plant species that are presently available.
I.4 – Molecular studies in P. nigra
Genetic markers have been used for studies in plant evolution, taxonomy, phylogenetic, ecology and genetics (Agarwal et al. 2008). A genetic marker consists in biological features (phenotype, protein or DNA fragment) that correspond to a genotype (O’Brien 1990). These characteristics are determined by allelic forms of genes or genetic loci, which may be transmitted from one generation to another and can be used as experimental probes or tags allowing the study of an individual, a tissue, a cell, a nucleus, a chromosome or a gene (Jiang 2013). Genetic markers should evidence polymorphism and can be used in combination with other markers as characteristic of this genotype (O’Brien 1990). Polymorphism is the identification of distinct alleles in the same locus and is the principal characteristic of a genetic marker (Ferreira and Grattaplaglia 1996; Andersen 2003). The concept of genetic marker has over than two centuries. It remits to the 19th century, when Gregor Mendel used phenotype-based genetic markers in his experiments with Pisum sativum (Agarwal et al. 2008). Genetic markers are inherited according to the Mendelian laws of inheritance, allowing differentiating genotypes and facilitating the detection of differences in the genetic information between individuals (Lefebvre and Chèvre 1995).
Over the years, different classifications for genetic markers were proposed (see Solanille 1994; Lefebvre and Chèvre 1995). More recent classification of genetic markers were published by Xu (2010) and Poczai et al. (2013), and are summarized in Figure I.2.
Figure I. 2010 and A the disti between regions) genome of DNA I or unive system S Fragme Polymo in Croat (Lučić populati .2 – Schemat d Poczai et al. A useful mo inction betw n alleles; iv ); v) selecti e-specific in A or tissue (A In spite of t ersal marke should be m Studies in nt Length P orphic DNA tian, Austri et al. 201 ions of We Classical markers Cytological markers Protein mark Morphologi markers CDDP PBA TBP ITP Conserved DNA a Gene Family Base markers (CDMs) ic representat 2013). The ac olecular ma ween hetero v) ubiquitou ive neutral; n nature, esp Agarwal et the large nu r system to made accord P. nigra w Polymorphis A (RAPD) in ian and Turk
0); cpSSR stern Europ s l kers ic Non-R Trans Eleme marke and ed tion of two re cronyms of the arker should ozygous and us and abun vi) easily pecially wit al. 2008; X umber of mo be used in dingly to the with molecu sm of chlor n Austrian a kish popula in populat pe (Afzai-R -PCR markers RFLP Genetic Mark ISAP REMAP IRAP S-SAP iPBS posable ent Based ers (TMEs) 14 ecent classific e DNA marke d be: i) high d homozygo ndant throu detected; v th polyploid Xu 2010; Jia olecular ma all studies e goal of ea ular marker roplast DNA and Dalmat ations (Libe tions of B Raffi and Do Arbitrarily Amplified DNA (AADs) markers RAPD ISSR kers NBS RGAP Resistance-Gen Based Markers (RGMs) cations of the ers are describ
hly polymor ous; iii) abl ugh the gen vii) cost-effe ds; and x) d ang 2013). arkers availa (Arif et al. ach study. rs performe A (RFLP cp ian Black P er et al. 200 ulgaria (Na odd 2007); DNA P Gene-tar Func marker and cDN cDN E RNA-Ba (RBMs) ne s genetic mark bed in the abbr
rphic; ii) co le to allow t nome (not c fective; viii) developed w able today, t 2010). The d until now pDNA) and Pine (Liber e 03) and in S aydenov et barcoding A markers PCR markers rgeted and ctional rs (GTMs d FM) iSNAP NA-AFLP NA-RFLP EST-SSR ased Markers ) kers (Adapted reviation’s lis -dominant a the easy di clustered in ) reproducib with small there is not e choice of a w, used Re Random A et al. 1999) Siberian pop t al. 2006) genes Cox1 Targeted Fingerprinting Markers (TFMs DALP PAAP S-RAP TRAP CoRAP SCoT d from Xu t. allowing stinction n certain ble; xix) amounts an ideal a marker estriction mplified ); RAPD pulations ) and in 1, MatK, g s)
15
Rbcl, Trnh and Nad 5-4, nSSRs, cpSSRs and detection of SNPs (Giovannelli et al. 2014);
noncoding trn regions of cpDNA in subsp. pallasiana and their varieties (Gülsoy et al. 2014); Simple Sequence Repeat (SSR) in subsp. laricio (Bonavita et al. 2015) and Expressed Sequence Tag - Simple Sequence Repeat (EST-SSR) in the populations of Balkans (Šarac et
al. 2015).
Since in the present study we used the ISSR and SCoT markers, only these marker systems will be described with more detail in the following subsections.
I.4.1 – Inter-Simple Sequence Repeat (ISSR) markers
ISSRs were first described by Meyer et al. (1993) but were designated as inter-microsatellites by Zietkiewicz et al. (1994). According to these authors, this technique allows the simultaneous analysis of a variety of genomic loci (Zietkiewicz et al. 1994) being widely reported as a multilocus marker (Tomar et al. 2010). This happens due to the presence of abundant repeated sequences all over the genome, which allows that SSR primers anneal in numerous regions and create a complex amplification pattern (Blanco et al. 2000).
This method consists in the amplification of a genomic DNA region flanked by two adjacent and inversely oriented microsatellite regions (Zietkiewicz et al. 1994; Ammiraju et
al. 2001; Tomar et al. 2010) using a single primer (Blanco et al. 2000, Ammiraju et al. 2001;
Prince 2015). The primers are based on di-, tri-, tetra- or pentanucleotide repeats, have 16-18bp long (Blanco et al. 2000; Chadha and Gopaloakrishna 2007; Tomar et al. 2010) that can be either unanchored (Gupta et al. 1994; Meyer et al. 1993; Wu et al. 1994) or more usually anchored at the 3’- or 5’-end by 2 to 4 arbitrary nucleotides (Ziekiewicz et al. 1994; Blanco et
al. 2000) (Fig. I.3).
According to Blanco et al. (2000), Ammiraju et al. (2001) and Prince (2015), some of the advantages of ISSR marker system are: i) only a single step is need after DNA isolation, decreasing relatively the technique cost; ii) the amount of DNA required is reduced, so this can be used to study rare organisms; iii) does not require the previous knowledge of the sequence of target DNA region; iv) highly informative and polymorphic; and v) reproducible.
ISSR are dominant markers (Tomar et al. 2010; Prince 2015), and their analysis is based on a binary code which consists in the detection of presence or absence of band or marker among the individuals under study (Prince 2015).
16
Figure I.3 – Schematic representation of ISSR technique with a single primer (AG)8, unanchored (a), 3’-end anchored (b) or 5’-end anchored (c) targeting a (TC)n repeat, to amplify a ISSR flanked by two inversely oriented (TC)n sequences. (a) Unanchored (AG)n primer can anneal anywhere in the (TC)n repeat region on the template DNA leading to slippage and ultimately smear formation; (b) (AG)n primer anchored with two nucleotides (NN) at the 3’-end anneals at specific regions of the template DNA and produces clear bands; (c) (AG)n primer anchored with two nucleotides (NN) at the 5’-end anneals at specific regions of the template DNA and amplifies part of the repeat region also, leading to larger bands (Adapted from Reedy et al. 2002).
Over the years, ISSR have been used with success in several plant species for the study of: i) genetic diversity (Souframanien and Gopalakrishna 2004; Basha and Sujatha 2007; Cipriano et al. 2013; Coutinho et al. 2014a); ii) gene-tagging (Ammiraju et al. 2001); iii) cultivars identification and estimation of phylogenetic relationships (Blanco et al. 2000; Ammiraju et al. 2001; Seyedimoradi and Talebi 2014), iv) genetic mapping (Arcade et al. 2000); v) DNA fingerprinting (Carvalho et al. 2005; Cabo et al. 2014a; Coutinho et al. 2014b). ISSR markers were also used to study the genetic diversity in P. nigra populations from Southern Spain and Northern Morocco (Rubio-Muraga et al. 2012; Lucas Borja et al. 2013).
I.4.2 – Start Codon Targeted (SCoT) markers
In 2009, Collard and Mackill developed a new molecular marker system named Start Codon Targeted (SCoT) suitable for the amplification of plant genes since the primers were designed for a short conserved region flanking their start codon (ATG). SCoTs could be
17
amplified by using a single 18-mer primer and an annealing temperature of 50 ºC (Collard and Mackill 2009).
Due to the basis of SCoT primer design, SCoT markers are expected to be distributed within gene regions that contain genes on both plus and minus DNA strands. It is also possible that pseudogenes and transposable elements may be used as primer binding sites by SCoT polymorphism technique (Collard and Mackill 2009)
The amplification product can be visualized with a regular electrophoresis on agarose gel and staining. All these characteristics made the SCoTs a suitable technique for the majority of plant research labs with standard equipment (Collard and Mackill 2009). These authors verified that SCoT markers are generally reproducible and suggested that primer length and annealing temperature are not the sole factors determining reproducibility. PCR amplification profiles of SCoT marker indicated that they are dominant markers like RAPDs, which means that the fragments detected on gels are scored as absent (0) or present (1) (Fig. I.4).
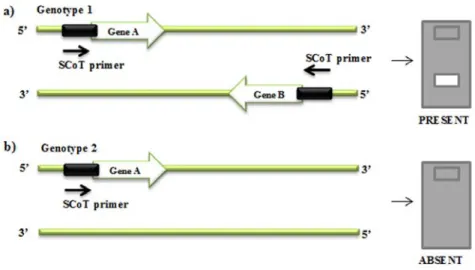
Figure I.4 – Schematic representation of SCoT marker amplification. (a) The SCoT marker is generated after
binding of the primer to a complementary sequence in both DNA strands at a distance suitable for PCR amplification; (b) no amplified product is observed due to high distance between the complementary sequences of the primer, avoiding the PCR amplification (Adapted from Collard and Mackill 2009).
Collard and Mackill (2009) suggested that SCoTs can be used alone or in combination with other markers.
SCoTs have been an useful tool to estimate genetic relationships (Luo et al. 2010; Xiong et al. 2011; Amimoradi et al. 2012; Guo et al. 2012; Mulpuri et al. 2013; Jiang et al. 2014), germplasm management and clonal identification at field breeding stations (Luo et al.
18
2010), diagnostic fingerprinting of cultivars and genotypes (Gorji et al. 2011; Cabo et al. 2014b), estimate genetic diversity (Chen et al. 2010; Luo et al. 2010, 2011; Xiong et al. 2011; Amimoradi et al. 2012; Guo et al. 2012; Bhattacharyya et al. 2013; Alikhani et al. 2014; Chen and Liu 2014; Jiang et al. 2014; Que et al. 2014; Shahlaei et al. 2014; Zeng et al. 2014) and evaluate genetic homogeneity of micropropagated plantlet (Agarwal et al. 2015).
Thus, SCoT markers are a simple and novel marker system with several advantages, such as: simple, cost-effective; highly polymorphic and informative; versatile to different plant species (Collard and Mackill 2009; Luo et al. 2010, Guo et al. 2012). The SCoT polymorphism might be straightly associated to gene function (Poczai et al. 2013).
It is important to highlight that only one work used SCoT markers in the forestry species, Quercus brantii (Alikhani et al. 2014). So, the present study constitutes the first use of SCoTs in a gymnosperm species.
I.5 – Cytogenetics analysis in P. nigra
At beginning of 20th century, chromosome banding and in situ hybridization (ISH) techniques allowed to construct and analyze the karyotypes of a number of species (Jacobs et
al. 2000). ISH turns a key to link molecular results and chromosomes (Heslop-Harrison et al.
1991), so it was important to develop reproducible high-resolution cytogenetic techniques (Doudrick et al. 1995). The development of fluorescence in situ hybridization (FISH) allowed a clear advance in chromosome studies specifically to physical mapping, genome analyses and evolutionary studies (Ribeiro et al. 2008). Actually, FISH technique is frequently used in
Pinus species, mainly to localize DNA probes and to identify chromosomes or chromosomal
regions (Hizume et al. 2002). Some examples of probes that have been used in FISH experiments performed in pine species are: i) the 5S and 45S rDNA which allowed the detection of rDNA loci in Pinus densiflora, Pinus thunbergii, Pinus elliottii var. elliottii,
Pinus sylvestris, Pinus radiata or Pinus taeda (Hizume et al. 1992; Doudrick et al. 1995;
Lubaretz et al. 1996; Hizume and Kondo 2000; Jacobs et al. 2000; Pavia et al. 2014); ii) a telomeric sequence that presented different chromosomal locations in P. sylvestris (Fuchs et
al. 1995) and P. elliottii (Schmidt et al. 2000); and iii) SSR probes that allowed the
construction of an ideogram for the probe (AG)10 in P. sylvestris using ND-FISH (Pavia et al. 2014). However, the advances in this field has been limited in gymnosperms, particularly in