Effect of Flow Regime on the Architecture
of a Pseudomonas ¯uorescens Bio®lm
Maria Olivia Pereira,1Martin Kuehn,2Stefan Wuertz,3Thomas Neu,4 Luis F. Melo1,5
1University of Minho, Centro de Engenharia BioloÂgica/IBQF, 4710-057 Braga, Portugal
2Institute of Water Quality Control and Waste Management, Technical University of Munich, Am Coulombwall, D-85748 Garching, Germany 3Department of Civil and Environmental Engineering, University of California, Davis, One Shields Avenue, Davis, California
4Institute of Inland Water Research Magdeburg, UFZ Centre for
Environmental Research, Leipzig-Halle, Brueckstr. 3A, 39114 Magdeburg, Germany
5Faculty of Engineering of the University of Porto, Chemical Engineering Department, LEPAE, 4200-465 Porto, Portugal; telephone: +351 225081588; fax: +351 225081449; e-mail: [email protected]
Received 17 August 2001; accepted 8 November 2001
Abstract: A comparison of the effects of laminar versus turbulent ¯ow regime on the characteristics of a single-species bio®lm is presented. The study was carried out by growing Pseudomonas ¯uorescens bio®lms in a ¯ow cell and studying the different layers of the biological matrix with a confocal laser-scanning microscope. The following conclusions were obtained: i) a higher con-centration of cells was found in the upper layers of the microbial ®lms than in their inner layers, regardless of the ¯ow regime;ii) the fraction of cells in the overall bio®lm mass decreased with time as the ®lm grew;and iii) under laminar ¯ow the total number of cells was higher than in bio®lms formed under turbulent ¯ow, but the latter had a higher number of cells per unit volume. Such conclusions, together with the fact that the bio®lms were more dense and stable when formed in contact with turbulent ¯ows, favor the design of more compact and ef®cient bio®lm reactors operating in turbulent conditions.ã 2002 Wiley Periodicals, Inc. Biotechnol Bioeng 78: 164±171, 2002;DOI 10.1002/bit.10189
Keywords: bio®lm architecture;hydrodynamic condi-tions;laminar and turbulent ¯ows;CLSM image analy-sis;biovolumes;Pseudomonas ¯uorescens
INTRODUCTION
Bacterial attachment to submerged solid surfaces and subsequent microbial growth and exopolymer produc-tion lead to the formaproduc-tion of bio®lms. In urban and industrial systems such as drinking water networks, paper manufacturing plants, and heat-exchange opera-tions, as well as in the medical ®eld, bio®lms generally give rise to undesired problems that aect production processes, product quality, and human health. Con-versely, bio®lms can be bene®cial when used in
biore-actors for wastewater treatment and for the production of desired compounds (Characklis and Marshall, 1990). The physical architecture of bio¯im can be de®ned as the spatial arrangement of the biomass (containing mi-crobial cells and the extracellular matrix they produce) and the interstitial spaces or channels (de Beer and Schramm, 1999; Okabe et al., 1998; Sandford et al., 1996). In the last decade, investigations revealed that bio®lms are often non-homogeneous and highly hydrated microsystems containing biomass layers and clusters, as well as voids or pores (de Beer and Schramm, 1999), which are not necessarily uniform in time or space. The complexity and variability of such biological matrices in¯uence the microbial activity as well as bio®lm physical properties and signi®cantly in-crease the diculty of bio®lm modelling. As a conse-quence, the knowledge of the internal structure of microbial ®lms is essential for understanding bio®lm activity and for timely applying appropriate measures to either control the growth of unwanted bio®lms or im-prove the performance of bene®cial bio®lms.
One of the most important factors aecting bio®lm structure and activity is the velocity ®eld of the ¯uid in contact with the attached microbial layer. Bio®lm reac-tors, for example, may operate under quite dierent hydrodynamic conditions, from laminar ¯ow in sub-merged ®lters to turbulent ¯ow in air-lift reactors; fur-thermore, changes in the ¯uid velocity occur often during the operation of industrial reactors. The macroscopic eects caused by dierent ¯ow rates (dierent velocities and/or dierent ¯ow regimes) have been the subject of a number of reports on the properties and activity of bio®lms (Bott, l995; Characklis and Marshall, 1990; Vieira et al., 1993; Wijeyekoon et al., 2000). The general conclusion is that when bio®lms grow under turbulent Correspondence to: L. F. Melo
Contract grant sponsor: PRAXIS
¯ow, the higher the velocity the thinner and denser (with higher content of extracellular polymeric substances) the bio®lm will be for Brading et al. (1995) compared Pseudomonas ¯uorescens bio®lms formed at dierent ¯ow velocities, under laminar regime, and found that more exopolysaccharides were produced by the bio®lm bacteria when subject to higher ¯uid velocities. They also concluded that for low substrate concentrations (100 mg of glucose per litre or less), microbial growth within the biological matrix was ¯ow dependent. However, some authors did not ®nd any eect of shear stress when the microbial ®lm was subject either to high or to low substrate loading rates (Peyton, 1996), possibly under laminar ¯ow (information not given explicitly). Wijeye-koon et al. (2000) studied mixed population bio®lms under laminar (from Re = 100 to Re = 2000) and tur-bulent ¯ow (Re = 5500), and reported that the latter had a remarkably higher cell density with the exopoly-saccharides mainly concentrated in the base of the ®lm.
Bio®lm thickness and density have an obvious in¯u-ence on the microbial metabolism in the ®lm because they may introduce diusional limitations as well as af-fect the composition of the microenvironment sur-rounding the cells within the matrix. The eects of the hydrodynamic parameters, particularly the type of ¯ow regime and the concentration and spatial distribution of microbial cells are not well understood. When going from laminar to turbulent ¯ow patterns, not only does the velocity increase but so does turbulence, introducing new forms of energy dissipation that aect the surfaces in contact with the ¯ow ®eld. In turbulent ¯ow, an increase in the ¯uid velocity means an increase both in the shear stress and in the intensity of the turbulent eddy mecha-nisms (Schlichting, 1979). There will also be variations in the angle by which the shear forces are applied to the bio®lm surface in a turbulent system, possibly aecting the developing architecture (cell cluster formation). The bio®lm may oscillate once a critical ¯ow velocity has been reached (Lewandowski and Stoodley, 1995).
The application of confocal laser scanning microscopy (CLSM) to bio®lm research, mainly when combined with a range of staining ¯uorescent techniques, provides an important, versatile, and eective tool to analyze the composition and structure of hydrated bio®lms in situ non-destructively and in real time (Lawrence et al., 1998b, 2001; Lawrence and Neu, 1999) as well as the cellular viability and distribution within the bio®lm. CLSM also allows the horizontal and vertical optical thin sectioning of hydrated bio®lms, making possible the quanti®cation of various parameters of the three-di-mensional (3D) bio®lm structure by digital image processing (Kuehn et al., 1998; Lawrence et al., 1998a).
The aim of the present study was to investigate how the ¯ow regime (laminar or turbulent) could aect quantitative parameters, such as cell concentration (measured as ``biovolumes''), thickness and biomass density, describing the structure of Pseudomonas
¯u-orescens bio®lm developed in a ¯ow cell reactor. The parameters were calculated from horizontal and sagittal images acquired with a CLSM. A single-species bio®lm was chosen to avoid the additional diculties brought by complex population dynamics and multiple substrate utilizations. The study involved not only the comparison of steady-state bio®lms formed under dierent ¯ow re-gimes but also the monitoring of cell density changes with time during bio®lm formation.
MATERIAL AND METHODS Microorganism and Cell Growth
The microorganism used to produce bio®lm was the Gram-negative aerobic bacterium Pseudomonas ¯u-orescens. These bacteria are good bio®lm producers, and their optimal growth conditions are 27°C, pH 7, and glucose as the carbon source (Oliveira et al., 1994).
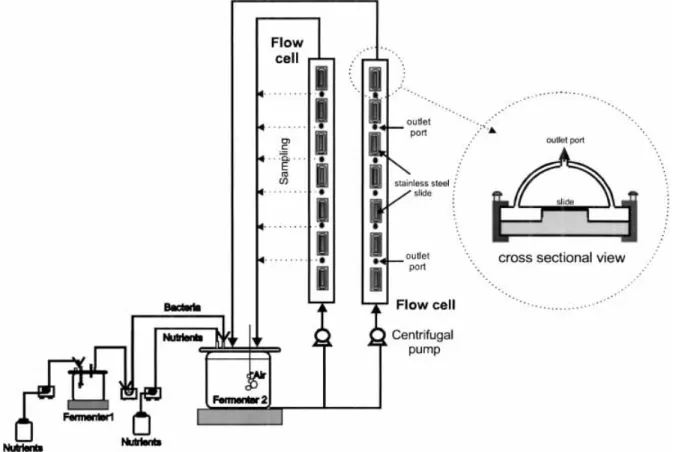
A culture of P. ¯uorescens was grown in a 1-L glass fermenter (fermenter 1), suitably aerated and agitated, continuously fed (10 mL á h)1) with a sterile nutrient solution consisting of 5 g glucose L)1, 2.5 g peptone L)1, and 1.25 g yeast extract L)1in phosphate buer at pH 7 (0.2 M Na2HPO4and 0.2 M NaH2PO4). The culture was used to continuously inoculate (10 mL á h)1) a 3-L vessel (fermenter 2) containing sterile water, aerated and agi-tated. This fermenter was fed with the buered medium described above (17 mL á h)1), and the bacterial culture was diluted with ®ltrated tap water (1.7 L á h)1) to obtain a suspension with 6 ´ l07cells mL)1and 20 mg á L)1of glucose. The bacterial suspension was pumped up, passing through the ¯ow cell reactors and back to the fermenter 2 (Fig. 1).
Flow Cell Reactor
The ¯ow cell reactor used in this work, illustrated in Figure 1, has a semi-circular cross-section and contains seven removable slides (stainless-steel slides glued on rectangular pieces of Perspex that properly ®t in the apertures of the ¯ow cell) that allow sampling of bio®lm at desired time intervals. Each slide can be removed separately in such a way that it does not disturb the bio®lm formed on the others and does not require the stoppage of the ¯ow (the ¯ow cell has on its circular surface, located between each two adjacent slides, several exit ports for the biological ¯uid that permit the con-tinuous ¯ow of the ¯uid even when the slide is removed). The slides were polished with sandpaper (P-1000) and polishing cream, degreased with detergent, rinsed with distilled water, and immersed in ethanol before use. The ¯ow cell reactor was sterilized by passing a solution (10 mL á L)1) of sodium hypochlorite with 13% of active chlorine, through it and rinsing it with water. Dimen-sions of each ¯ow cell were as follows: length = 50 cm; diameter = l.5 cm; Area of each slide = 2.34 cm2.
Bio®lm Growth
Bio®lms were formed by recirculating the bacterial suspension, obtained from the second fermenter at 27°C and pH 7, using two similar ¯ow cell reactors. One of them was used to promote laminar ¯ow (Reynolds number: Re = 2000, ¯uid velocity around 0.21 m á s)1) and the other turbulent ¯ow (Re = 5500, ¯uid velocity approximately 0.51 m á s)1).
At ®xed time intervals, one bio®lm covered slide was carefully removed from each cell, replaced with a clean slide, and immediately prepared for further analysis. The ®rst slides to be removed were those on the top of the ¯ow cells (near the outlet).
Bio®lm Properties Bio®lm Thickness
The bio®lm thickness and the spatial distribution of the bacteria in the biological layer at dierent times during bio®lm growth were investigated using CLSM. For this purpose, the in situ hydrated bio®lm formed on the slides was stained using the staining kit LIVE/DEAD obtained from Molecular Probes Inc. (Eugene, OR). The procedure has been described elsewhere in detail (Neu and Lawrence, 1997). To stain glycoconjugates within the bio®lm ¯uor conjugated lectins were used.
The TRITC-labeled lectins included: Canavalia en-siformis, Triticum vulgaris, and Limulus polyphemus (Sigma, St. Louis.). Application of lectins has been de-scribed previously (Lawrence and Neu, 1999).
Confocal Laser Scanning Microscopy
CLSM observations were made with a TCS 4D (Leica, Heidelberg, Germany) attached to an inverted micro-scope and equipped with an argon-krypton laser. The microscope was controlled by ScanWare Version 5.10 (Leica). Images were collected with a 60X 0.9 NA water immersion lens (Olympus, Tokyo, Japan) in Z direction for subsequent image analysis and several images were acquired. In the present case, the staining procedures allowed the visualisation of cells only, but not of the bio®lm extracellular polymers.
Deposit Dry Mass
The deposit dry mass was obtained by weighing the slides before and after bio®lm formation. In the beginning of each experiment, i.e., before being inserted in the ¯ow cells and after being degreased, rinsed, and dried, the stainless-steel slides were identi®ed and weighed, with an accuracy of 0.001 g. Once a steady-state deposit was formed (after approximately 8±10 days), the mass of the Figure 1. Experimental set-up, including a continuous bacterial culture system (fermenter 1 and 2) and two ¯ow cells of semicircular cross-section containing the removable test slides.
slides plus attached deposit was determined after being dried to constant mass under steady conditions (24 h; T = 80°C). Deposit dry mass accumulated on the several stainless steel slides was thus calculated as the dierence between the two respective weights and expressed in kilograms per m2 of surface area of the stainless steel slide. The results here presented are the average of three or more measurements.
lmage Analysis
The on-line sequential collection of digital images of the CLSM optical thin sections was used to quantitatively determine such parameters as bio®lm thickness, cell biomass at various depths, and biovolumes over time. Details of the image acquisition and processing proce-dures can be found in Kuehn et al. (1998). Cell biomass refers to the accumulation of P. ¯uorescens on each horizontal section area and is expressed as bacterial cell area, i.e., as the fraction of the area covered by bacteria on each confocal plane in relation to a lens-dependent reference area (2.53 ´ 10)8m2). The biovolume of each bio®lm stack was calculated by numerical integration of all the bacterial cell areas obtained by following the trapezoidal rule and is, thus, representative of the amount of cells within the bio®lm.
Scanning Electron Microscopy (SEM) Observations
During the experiments a few deposit-covered stainless-steel slides were observed by SEM. Prior to SEM ob-servations, the bio®lm samples were dehydrated through an absolute ethanol series to 100% and dried in a des-iccator for 3 days. The samples were sputter-coated with gold and examined with a Leica S360 scanning electron microscopy at 10±15 kV. The slides were not ®xed be-cause the ®xation procedures involve the use of chemi-cals that tend to react with some of the components of the biological matrix, as documented by Azeredo et al. (1999), hence modifying the real bio®lm structure. RESULTS
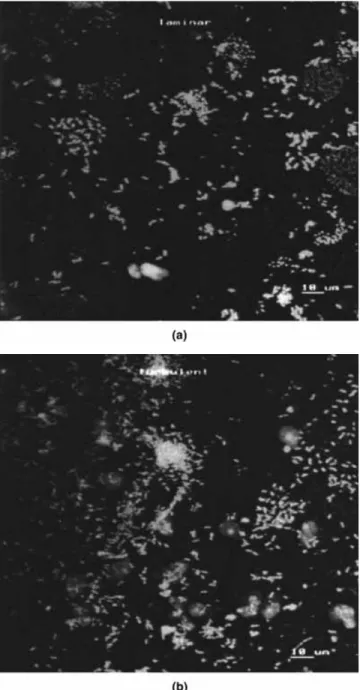
CLSM observations of the slides show that they were substantially covered with bacteria and colonies since the ®rst day of contact with the microbial suspension (Fig. 2) for both ¯ow regimes, laminar and turbulent. These observations also show that the bacterial coloni-zation was very heterogeneous, varying from dispersed attached cells to bacterial clusters. The live/dead tests did not indicate any signi®cant number of dead cells in the bio®lm. This could be expected because the bio®lms are quite thin and, therefore, mass transfer limitations are not signi®cant.
Figure 3 is a representative pattern of the microbial colonization of two bio®lm stacks, at day 7, formed under turbulent and laminar ¯ow. The biovolume in each stack corresponded to the numerically integrated volume occupied by the cells. In general, the CLSM images obtained in this study revealed that the greatest amount of cellular biomass was concentrated in the upper regions of the bio®lm.
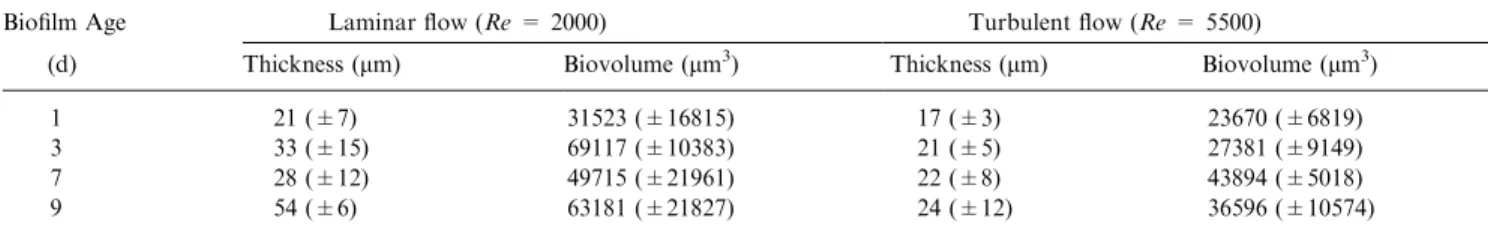
Table I presents the bio®lm thickness and biovolume values obtained under dierent ¯ow conditions. The biovolume values presented here are the average vol-umes of the cellular material within all stacks measured for each ¯ow condition and time interval.
Figure 2. CLSM micrograph of a 1-day-old Pseudomonas ¯uorescens bio®lm formed on stainless-steel slides under laminar (a) and turbulent (b) conditions. Maximum intensity projection, bar = 10 lm.
Higher thicknesses were obtained at the lowest ve-locity (laminar ¯ow), although with signi®cant varia-bility in time. On the contrary, the bio®lm thicknesses measured in the turbulent assay were more stable.
Regarding the biovolumes, higher values were ob-tained in the laminar ¯ow test, meaning that there were more cells in the laminar bio®lm than in the turbulent situation. The ¯uctuations in biovolumes are also more pronounced in the bio®lm formed under laminar ¯ow conditions. The results were statistically tested, by using the Student's t test distribution, to assess whether the dierences between the experimental values obtained under the dierent ¯ow regimens could be considered signi®cant. The eect of the ¯ow regimen both on thicknesses and biovolumes was found to be statistically signi®cant because the con®dence level for 3 degrees of freedom was higher than 90%.
The change in dry biomass (per unit area of the slides) over time, given in Figure 4, con®rms the signi®cant ¯uctuations of the growth curve under laminar ¯ow caused by sloughing o and re-growth phenomena, as well as the more stable growth trend in the turbulent ¯ow case. Table II presents the mass of cells per unit
mass of dry deposit, which was calculated from Table I and Figure 4 by multiplying the biovolumes by the density of each cell (approximately, 1000 kg)3) and di-viding them by the deposit dry mass of the same refer-ence area. Whereas in laminar ¯ow this parameter does not display a stable trend due to ¯uctuations in the at-tached biomass, it can be seen that in turbulent ¯ow the fraction of bacterial cell mass in the dry bio®lm de-creases steadily with time.
Additionally, the average bacterial cell area per unit volume of wet bio®lm was calculated in every bio®lm stack, with the purpose of looking at the average spatial concentration of cells within both bio®lms overtime. For turbulent ¯ow, the average ratio cells/bio®lm volume was found to be roughly constant, ¯uctuating between 1.0 ´ 10)5 and 1.5 ´ 10)5lm2 á lm)3, whereas for la-minar ¯ow this ratio decreased from 1.0 ´ 10)5, at day 1 to 0.28 ´ 10)5 lm2á lm)3at day 9. Therefore, in tur-bulent ¯ow, the cellular concentration per unit volume of wet bio®lm was higher than in laminar ¯ow and did not show signi®cant changes with time.
Staining of the bio®lm samples with the available lectins did not show any signi®cant glycoconjugate sig-nal. The lectins used were speci®c for D-glucose, N-acetyl-D-glucosamine, D-mannose, sucrose, fructose Table I. Bio®lm thicknesses and biovolumes under dierent ¯ow conditions as a function of time; in brackets the standard deviation from the mean value.
Bio®lm Age Laminar ¯ow (Re = 2000) Turbulent ¯ow (Re = 5500)
(d) Thickness (lm) Biovolume (lm3) Thickness (lm) Biovolume (lm3)
1 21 (7) 31523 (16815) 17 (3) 23670 (6819)
3 33 (15) 69117 (10383) 21 (5) 27381 (9149)
7 28 (12) 49715 (21961) 22 (8) 43894 (5018)
9 54 (6) 63181 (21827) 24 (12) 36596 (10574)
A paired comparison test using Student's t test distribution was perfomed (Daniel, 1987) considering time as the independent variable. In one of the comparison tests, bio®lm thicknesses under laminar and turbulent ¯ow were the dependent variables. The same comparison procedure was applied to the dierences between biovolumes in laminar and turbulent cases.
Figure 3. Distribution of cellular material versus z-scan position of a 7-day aged bio®lm formed under turbulent (j) and laminar (d) con-ditions (illustrative example). % cellular material = % area occupied by the cells in the scanned reference area.
Figure 4. Deposit dry mass as a function of time; (d) laminar ¯ow, (j) turbulent ¯ow; bars mean the standard deviation from the mean (n = 4). Obs: This mass is somewhat higher than the bio®lm dry mass due to the presence of inorganic matter.
(Canavalia ensiformis), N¢N¢-diacetylchitobiose, N¢N¢N¢-triacetylchitobiose (Triticum vulgaris) N-acetylneura-minic acid, D-glucuronic acid (Limulus polyphemus). This result indicates that the bacterial strain as grown and used in this study does not produce a polymer with a speci®city to one of the lectins listed above.
DISCUSSION
The present work con®rms that under laminar condi-tions bio®lms are thicker, as expected from the reduced shear stress eects and from the absence of turbulent eddies. Also, as often succeed, these bio®lms present substantial ¯uctuations in their thickness and mass over time (Table I and Fig. 4) due to sloughing o and re-growth. They are known to be less dense (more ``¯uy'') than bio®lms formed under turbulent ¯ow conditions (Characklis and Marshall, 1990; Wijeikoon et al., 2000) and, thus, with less resistance to detachment. On the other hand, higher ¯ow rates give rise to denser bio®lms strongly adhered to the surface, as previously reported (Vieira et al., 1993, Wijeikoon et al., 2000). This explains the more stable trend of the bio®lm growth curve ob-tained under turbulent ¯ow (Fig. 4).
The higher cell density per unit area in the upper layers of both bio®lms (Fig. 3) is not in accordance with the results from a few investigations carried out under laminar ¯ow with P. ¯uorescens bio®lms, where the highest density of cells was found near the substratum (Lawrence et al., 1987; Lawrence and Korber, 1993; Kuehn et al., 1998). However, other authors (Neu and Lawrence, 1997) reported that in raw river water, bio-®lms containing colloidal debris the highest cell density was located in the outer region of the bio®lm at some distance from the substratum. The fact that in the pre-sent work the velocities were signi®cantly higher than in the above mentioned studies with P. ¯uorescens (5 to 20 times), resulted in a much greater rate of substrate transport from the ¯uid to the bio®lm surface, which should favour the presence of a high number of active bacteria in the upper layers of the ®lm.
Although under laminar conditions the bio®lm con-tained more cells than under turbulent ¯ow (the total mass was higher too), there were more cells per unit wet volume in the bio®lm formed under turbulent
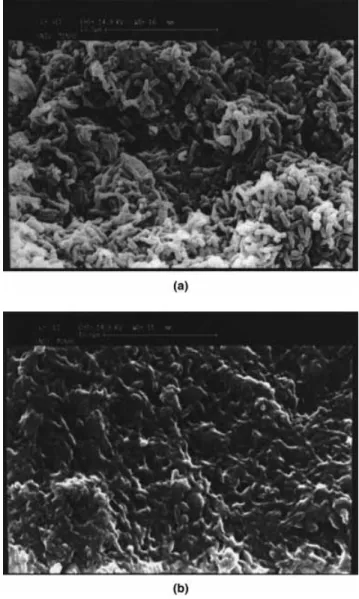
condi-tions. This gives an idea of how the cells build their habitat when subject to stronger hydrodynamic stresses: it can be assumed that they produce more exopolymers per unit volume to create an eective adhesion and, at the same time, reduce the void fraction in the bio®lm (lower thickness, higher density) to impart a greater cohesion to the biological matrix. In this way, the cells manage to remain relatively active within the matrix, but protected from external aggressions. Although it was not possible to identify the exopolymers by staining procedures, greater amounts of extra cellular polymeric substances (EPS) were observed in the scanning electron microscope in the bio®lm formed under turbulent re-gime than under laminar rere-gime: the polymeric viscous material is much more clearly seen in Figure 5b (tur-bulent ¯ow) than in 5a (laminar ¯ow).
The data shown in Table II corroborate previous as-sumptions made by Melo and Vieira (1999) about the dierent layers formed during bio®lm growth, as regards
Figure 5. SEM photomicrographs of a 10-day-old Pseudomonas ¯uorescens laboratory bio®lms formed on stainles-steel slides under laminar (a) turbulent (b) conditions. ´3900 magni®cation, bar = 10 lm. Table II. Cell wet mass per deposit dry mass, as a function of time; in
brackets the standard deviation from the mean value.
Bio®lm Age Laminar ¯ow(Re = 2000) Turbulent ¯ow(Re = 5500)
(d) Kgcell/Kgdry deposit Kgcell/Kgdry deposit
1 0.0172 (0.0018) 0.0247 (0.0037) 3 0.0418 (0.0108) 0.0212 (0.0057) 7 0.0195 (0.0065) 0.0179 (0.0026) 9 0.0204 (0.0033) 0.0154 (0.0030)
to the relationship between cell mass and exopolymer mass. They postulated that the rate of increase in cell mass within a bio®lm is smaller than the rate of growth of the total bio®lm dry mass. This is due to the fact that each cell utilizes the substrate with (at least) two dif-ferent purposes: to reproduce itself and to produce ex-tracellular polymers. Therefore, from the initial layers to the ®nal upper layers of the bio®lm (or biomass cluster), the fraction of cells in the total dry biomass will become progressively smaller, because the exopolymeric part of the attached biomass does not produce new cells. That assumption had already been veri®ed in an indirect way, by ®tting the resulting mathematical model to the growth curves of dierent bio®lms formed under tur-bulent ¯ow (Melo and Vieira, 1999).
The results presented in this work indicate, however, that this concept cannot yet be clearly con®rmed in la-minar ¯ow situations, because of the disturbances in-troduced by the substantial biomass losses due to uneven detachment (sloughing o) during bio®lm de-velopment. Although the data in Table II may seem, at ®rst sight, in contradiction with the cell distribution shown in Figure 3, they are not comparable. The latter refers to the cell distribution in dierent bio®lm layers at a given instant of time (without relating it to the overall bio®lm mass), while Table II indicates the average cell fraction in the whole bio®lm mass at dierent time points of bio®lm formation.
CONCLUSIONS
The following main conclusions can be drawn from the present study performed with a single species bio®lm under laminar and turbulent ¯ow conditions (care should be taken in extrapolating these conclusions to the case of multi-species, multi-substrate bio®lms): 1) Bio-®lms formed under laminar ¯ow regime are thicker, less dense, and contain a higher total number of cells than similar (same species) bio®lms formed under turbulent regime; 2) The upper layers of the bio®lms contain more cells than the inner layers, regardless of the ¯ow regime under which the microbial ®lms were formed; 3) The mass of bio®lms in contact with laminar ¯ows is subject to more pronounced ¯uctuations and has a lower con-centration of cells per unit volume of wet bio®lm; 4) The results from Table II con®rm the assumption that the number of microorganisms in a developing bio®lm does not increase proportionally to the bio®lm dry mass (cell + exopolymers), i.e., the fraction of cells in the dry mass of bio®lm should decrease over time during the growth of the microbial ®lm. Such an assumption was previ-ously proposed in the development of a model for the prediction of the bio®lm ®nal thickness (Melo and Vieira, 1999), which is needed for the application of the diusion-reaction models used in bio®lm reactor design. The results from the present work suggest that wastewater treatment reactors started and operated
under turbulent ¯ow will be less aected by hydraulic changes occurring during their operation and can be made more compact than reactors operating with la-minar ¯ow streams (for the same substrate consumption rate). The decrease in the mass fraction of cells as the thickness increases seems also to favour the operation of wastewater treatment reactors with relatively thin bio-®lms. Therefore, if diusional limitations in the thinner and denser bio®lms formed under turbulent ¯ow con-ditions do not prevail, then those reactors can also be more ecient in terms of substrate consumption rate. This concept has been applied to the design of new bio®lm reactors in recent years (Tijhuis et al., 1992; Lazarova and Manem, 2000).
The access to the CLSM by Werner Zuschratter is highly appreciated.
References
Azeredo JA, Lazarova V, Oliveira R. 1999. Methods to extract the exopolymeric matrix from bio®lms: a comparative study. Wat Sci Tech 39:243±250.
Bott TR. 1995. Fouling of Heat Exchangers. Amsterdam: Elsevier. 524 pp.
Brading MJ, Boyle J, Lappin-Scott HM. 1995. Bio®lm formation in laminar ¯ow using Pseudomonas ¯uorescens EX101. J Industrial Microbiol 15:297±304.
Characklis WG, Marshall KC. 1990. Bio®lms. New York: John Wiley and Sons. 796 pp.
Daniel WW. 1987. Biostatistics: a foundation for analysis in the health sciences. New York: Wiley and Sons. 747 pp.
de Beer D, Schramm A. 1999. Micro-environments and mass transfer phenomena in bio®lms studied with microsensors. Wat Sci Tech 39:173±178.
Kuehn M, Hausner M, Bungartz H-J, Wagner M, Wilderer PA, Wuertz S. 1998. Automated confocal laser scanning microscopy and semiautomated image processing for analysis of bio®lms. Appl Environ Microbiol 64:4115±4127.
Lewandowski Z, Stoodley P. 1995. Flow induced vibrations, drag force, and pressure drop in conduits covered with bio®lm. Wat Sci Tech 32:19±26.
Lawrence JR, Delaquis PJ, Korber DR, Caldwell. 1987. Behaviour of Pseudomonas ¯uorescens within the hydrodynamic boundary lay-ers of surface microenvironments. Micro Ecol 14:1±14.
Lawrence JR, Korber DR. 1993. Aspects of microbial surface colo-nization behaviour. In: Guerrero R, Pedros-Alio, editors. Trends in microbial ecology. Barcelona: Spanish Society for Microbiol-ogy. p 113±118.
Lawrence JR, Neu TR, Swerhone GDW. 1998a. Application of mul-tiple parameter imaging for the quanti®cation of algal, bacterial, and exopolymer components of microbial bio®lms. J Microbiol Methods 32:253±261.
Lawrence JR, Wolfaardt G, Neu TR. 1998b. The study of microbial bio®lms by confocal laser scanning microscopy. In: Wilkinson MHF, Shut F. editors. Digital image analysis of microbes. Chichester: John Wiley. p 431±465.
Lawrence JR, Neu TR. 1999. Confocal laser scanning microscopy for analysis of microbial bio®lms. Methods Enzymol 310:131± 144.
Lawrence JR, Korber DR, Wolfaardt GM, Caldwell DE, Neu TR. 2001. Analytical imaging and microscopy techniques. In: Hurst CJ, Knudsen GR, McInerney MJ, Stetzenbach LD, Walter MV,
editors. Manual of environmental microbiology. Washington: American Society for Microbiology. 50 pp., 2nd edition. Lazarova V, Manem J. 2000. Innovative bio®lm treatment
technolo-gies for water and wastewater treatment. In: Bryers JD, editor. Bio®lms II: Process analysis and applications. New York: Wiley-Liss, Inc.
Melo L, Vieira MJ. 1999. Physical stability and biological activity of bio®lms under turbulent ¯ow and low substrate concentration. Bioproc Eng 20:363±368.
Neu TR, Lawrence JR. 1997. Development and structure of microbial bio®lms in river water studied by confocal laser scanning micros-copy. FEMS Microbiol Ecol 24:11±25.
Okabe S, Kuroda H, Watanabe Y. 1998. Signi®cance of bio®lm structure on transport of inert particulates into bio®lms. Wat Sci Tech 38:163±170.
Oliveira R, Melo L, Oliveira A, Salgueiro R. 1994. Polysaccharide pro-duction and bio®lm formation by Pseudomonas ¯uorescens: eects of pH and surface material. Coll Surf. B Biointerfaces 2:41±46.
Peyton BM. 1996. Eects of shear stress and substrate loading rate on Pseudomonas aeruginosa bio®lm thickness and density. Wat Res 30:29±36
Sanford BA, Feijter AW, Wade MH, Thomas VL. 1996. A dual ¯u-orescence technique for visualization of Staphylococcus epidermidis bio®lm using scanning confocal laser microscopy. J Ind Microbiol 16:48±56.
Schlichting. 1979. Boundary layer theory. New York: McGraw-Hill Book Company. 817 pp.
Tijhuis L, van Loosdrecht MCM, Heijnen JJ. 1992. Nitri®cation with bio®lms on small suspended particles in airlift reactors. Wat Sci Tech 26:2207±2221.
Vieira MJ, Melo LF, Pinheiro MM. 1993. Bio®lm formation: hydro-dynamic eects on internal diusion and structure. Biofouling 7:67±80.
Wijeyekoon S, Mino T, Satoh H, Matsuo T. 2000. Growth and novel structural features of tubular bio®lms produced under dierent hydrodynamic conditions. Wat Sci Techn 41:129±138.