GARLIC YIELD FORECASTING BY TIME SERIES MODELS
Anderson Rodrigo da Silva1, Fabyano Fonseca e Silva2, Paulo Roberto Cecon2, Renato Paiva de Lima3
1
Escola Superior de Agricultura “Luiz de Queiroz”, Programa de Pós-Graduação em Estatística e Experimentação Agronômica, Av. Pádua Dias, 11, CEP 13418-900 Piracicaba, SP, Brasil. E-mail: [email protected]
2
Universidade Federal de Viçosa, Av. P.H. Rolfs, s/n, CEP 36570-000 Viçosa, MG, Brasil.
3 Universidade Federal Rural de Pernambuco, Programa de Pós-Graduação em Engenharia Agrícola, Rua Dom Manoel de
Medeiros, s/n, CEP 52171-900 Recife, PE, Brasil. ABSTRACT
The aim of the present study was to use time series models in order to realize forecasting garlic yield using data of bulb dry matter from six garlic accessions. The experiment was carried under completely randomized blocks design with 4 replicates. To adjust the time series models, data were collected in the periods: 60, 90, 120 and 150 days after planting (dap), being the latter the expected date for harvest. For this study, the plants were kept for 20 days in the field, 170 dap. The autocorrelation and partial autocorrelation functions were used in order to indicate the possible models order, which were chosen by AIC criterion. After obtaining the best model, one made the forecasting of the matter at 170 dap, and the predict values compared with the real ones. The linear regression models with residuals structure MA(1) was most adequate to forecasting garlic accessions yield 20 days after the expected time for harvest.
Key words: Allium sativum, Box and Jenkins models, ex-post forecasting
PREVISÃO DA PRODUTIVIDADE DE ALHO UTILIZANDO MODELOS DE SÉRIES TEMPORAIS
RESUMO
O objetivo deste estudo foi utilizar modelos de séries temporais para efetuar previsões da produtividade de alho, baseando-se nos dados de matéria seca do bulbo de seis acessos. O experimento foi conduzido sob delineamento em blocos casualizados com quatro repetições. Para o ajuste dos modelos de séries temporais foram coletados dados de matéria seca do bulbo nos seguintes períodos: 60, 90, 120 e 150 dias após o plantio (dap), sendo este último, a data prevista para a colheita. Para este estudo, as plantas permaneceram por mais 20 dias no campo, ou seja, 170 dap. Utilizou-se as funções de autocorrelação e autocorrelação parcial para indicação das possíveis ordens dos modelos, os quais foram escolhidos por meio do AIC. De posse do modelo adequado, realizou-se as previsões da matéria seca aos 170 dap, comparando-se os valores previstos com os valores reais. A utilização de modelos de regressão linear simples com estrutura de erros MA(1) mostrou-se razoável para realizar a previsão da produtividade de acessos de alho de ciclo médio em vinte dias após a época prevista para a colheita.
INTRODUCTION
Garlic (Allium sativum L.) has been cultivated all around the world for centuries due to its medicinal properties and notable value as a condiment. In Brazil, it is one of the most important vegetables under a social stand point, being cultivated, predominantly by small growers (MAROUELLI et al., 2002; TRANI et al., 2005).
The cycle of culture normally varies from 110 to 150 days and the harvest point is cited by many authors as a complete yellowing and drying of aerial part, or by the snap and falling of ripe plant (SOUZA et al., 2007). According to Calbo (2010), the garlic must be harvested when about 2/3 of its leaves turn yellow and/or dry, and fall or not, depending on the cultivar. However, according to Souza et al., (2007), some producers begin harvest when the plants still present from five to six leaves in senescence and not completely dry. Therefore, it is continuously necessary to conduct studies on the permanence of plants in the field (cycle), seeking better quality of commercial product (bulb) and higher yields.
Studies involving the time of harvest are of great relevance in the agronomic area, although for some cultures like garlic (OLIVEIRA et al., 2003; SOUZA et al., 2007; CALBO, 2010) and melon (PAIVA et
al., 2008), due to the scarcity of papers, such
studies become even more interesting. Time series models have been used to determine the final yield of some cultures of commercial importance, such as sugarcane (NASCIMENTO et al., 2009) and coffee (CARVALHO et al., 2005), when well adjusted, enables the forecasting of the yield in the future. The advantage of this technique begins in the aid of infra-structure planning and goes to the yield capacity, reducing risks inherent to the decision processes of the activities.
Generally, the objective of the time series analysis is to use stochastic models to
describe the behavior of the series (longitudinal data), investigate the generating mechanism of these series and make predictions of future values (MURADÁS NETO et al., 2008; SILVA et
al., 2008). Among the several time series
models, we highlight the types Auto-Regressive (AR) and Mobile Means (MA), which consist in a class of ARMA models (p,q), where p and q represent, respectively, the numbers of parameters of AR and MA (BOX & JENKINS, 1976). According to several authors (PINDYCK & RUBINFELD, 1981; MORETTIN & TOLOI, 2004; LIMA et al., 2007) the advantages of these models are the reduced numbers of parameters and highly precise predictions.
In light of this, the objective of this paper was to use time series models to conduct ex-post forecasting of garlic yield after the predicted harvest time, with basis on the data of dry matter of the bulb in six accessions, verify the quality of the prediction comparing the predicted value with the observed value and select a general model to make the forecast.
MATERIAL AND METHODS
The experiment was conducted in the experimental area of the Federal University of Viçosa, in the city of Viçosa (MG), from March to September 2010, under randomized blocks with four replicates. Data of the six accessions were used from garlic belonging to the “Banco de Germoplasma de Hortaliças (BGH/UFV)”.
For the adjustment of the time series models, bulb dry matter (DM, in gram) data was collected in the following periods: 60, 90, 120 and 150 days after planting (dap), being the latter the expected date for harvest, since the studied access present a medium cycle. For this study, the plants remained for 20 more days in the field, that is 170 dap, seeking to evaluate the effects in relation to
the yield of the accessions without, nonetheless, incurring in the quality loss of the commercial product. The yield data (kg.ha-1) and dry matter of the bulb were submitted to a Shapiro-Wilk normality test, once the correlation coefficient used to assess the association between these variables preconizes their normality.
The original series of dry matter in function of time were plotted in graphs for the identification of the presence of possible tendencies, and the Cox-Stuart test was applied (MORETTIN & TOLOI, 2004) for means of statistical confirmation.
Firstly, the simple linear regression models were adjusted, in which the dry matter was given in function of time. The residues of this adjustment were submitted to autocorrelation (acf) and partial autocorrelation function (pacf), once the significant correlations of acf identified possible orders (q values) of the mobile means model, MA(q); and the pacf identified possible orders (p values) of the auto-regressive model, AR(p).
Therefore, we adjusted simple linear regression models with error structure AR(p) or MA(q), according to Equation 1 and Equation 2, respectively: i 1 i 1 i 1 0 i β β X e e Z 1) (Eq. i 1 i 1 i 1 0 i β βX a a Z 2) (Eq.
where: Zi is the i-th value of the series
(values of dry matter), β0 and β1 are the
parameters from simple linear regression model; 1 and 1 are, respectively, parameters from error structures AR(1) and MA(1); ei is the value of the i-th associated
residue to the i-th value of the series; ai is the
other random effect (new residue), i = 1, 2, ..., 4. The terms ei and ai are called white
noises, i.e., independent residual effects. For the choice of the best model the AIC (Akaike Information Criterion) was used, so that the smallest values represent the best model.
With the adequate model, the forecast of the DM data were made at 170 dap. The predicted values were compared with the real ones. To make this comparison, the Mean Absolute Percentage Error (MAPE) was used, which is a criterion to verify the quality of the prediction of the model, possible with Equation 3.
n n h i 1 n h e 1 (Eq. 3) MAPE(%) 100 h Z
where: Znh is the value seen for the series in time n+h, h is the horizon or prediction period beyond n time (in this case h=1), en+h
is the prediction error given by Znh Zˆnh. It is worth mentioning that the predicted value, Zˆnh, is given by:
1 h n i 1 0 h n β β X e Z ˆ ˆ ˆ ˆ .
As another criterion for the verification of the forecast quality, confidence intervals (CI%) were built for the obtained predicted values. For such, the methodology proposed by Diggle (1992) was used, according to Equation 4.
4) (Eq.
where:
2
C is the quantile of normal
distribution that delimits the critical area and
2
ˆ is the estimator of residual variance.
All of the analysis of times series applied was implemented by means of the
arima function from R free software, version
2.13.2 (R DEVELOPMENT CORE TEAM, 2011).
RESULTS AND DISCUSSION
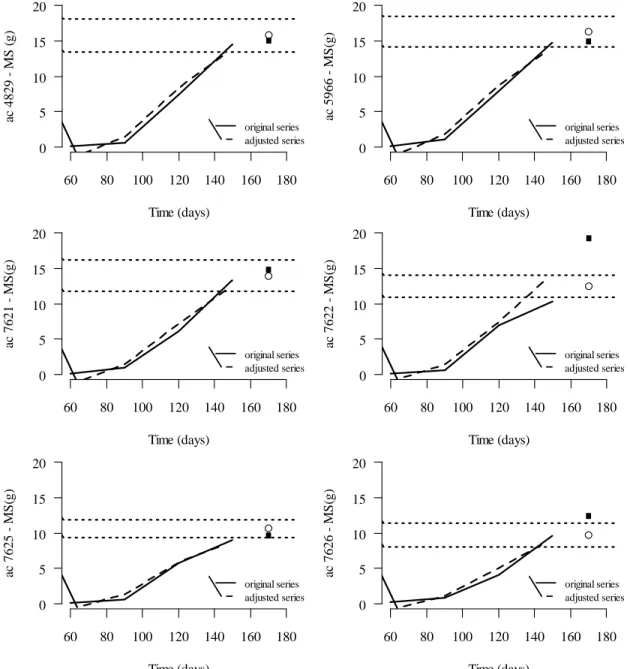
The Cox-Stuart test, with α = 0.05 and p = 0.5 for the binomial distribution, confirmed the presence of tendency in the original series of dry matter (DM) data, as seen in Figure 1. Visually, one noticed a great similarity in the bulb development throughout time. It is interesting to mention
that from time 2 (90 dap) there is a quick bulb development and, consequently, the DM. This is due to the fact that the plants are completing the vegetative growth phase and starting the translocation of nutrients to the bulb. Souza et al. (2007) highlighted that lower temperatures promote a higher bulbils number per bulb; and that for good vegetative growth and good yield, the garlic
need mild temperatures (18 to 20ºC) in the initial phase of the cycle, lower temperatures (10 to 15ºC) in the intermediary phase (when the formation of the bulbs occur) and higher temperatures (20 to 25°C) in the final phase. This fact was similar to the climatic conditions in the city of Viçosa during the period of the experiment.
Figura 1. Forecast at time n + h (170 dap) and confidence intervals for the dry matter real value
(DM) of the garlic accessions; ■: real value; ○: predicted value.
60 80 100 120 140 160 180 0 5 10 15 20 Time (days) ac 4829 M S ( g) 60 80 100 120 140 160 180 0 5 10 15 20 Time (days) ac 5966 M S (g) 60 80 100 120 140 160 180 0 5 10 15 20 Time (days) ac 7621 M S (g) 60 80 100 120 140 160 180 0 5 10 15 20 Time (days) ac 7622 M S (g) 60 80 100 120 140 160 180 0 5 10 15 20 Time (days) ac 7625 M S (g) 60 80 100 120 140 160 180 0 5 10 15 20 Time (days) ac 7626 M S (g) 60 80 100 120 140 160 180 0 5 10 15 20 Time (days) ac 4829 M S ( g) original series adjusted series 60 80 100 120 140 160 180 0 5 10 15 20 Time (days) ac 4829 M S ( g) original series adjusted series 60 80 100 120 140 160 180 0 5 10 15 20 Time (days) ac 4829 M S ( g) original series adjusted series 60 80 100 120 140 160 180 0 5 10 15 20 Time (days) ac 4829 M S ( g) original series adjusted series 60 80 100 120 140 160 180 0 5 10 15 20 Time (days) ac 4829 M S ( g) original series adjusted series 60 80 100 120 140 160 180 0 5 10 15 20 Time (days) ac 4829 M S ( g) original series adjusted series
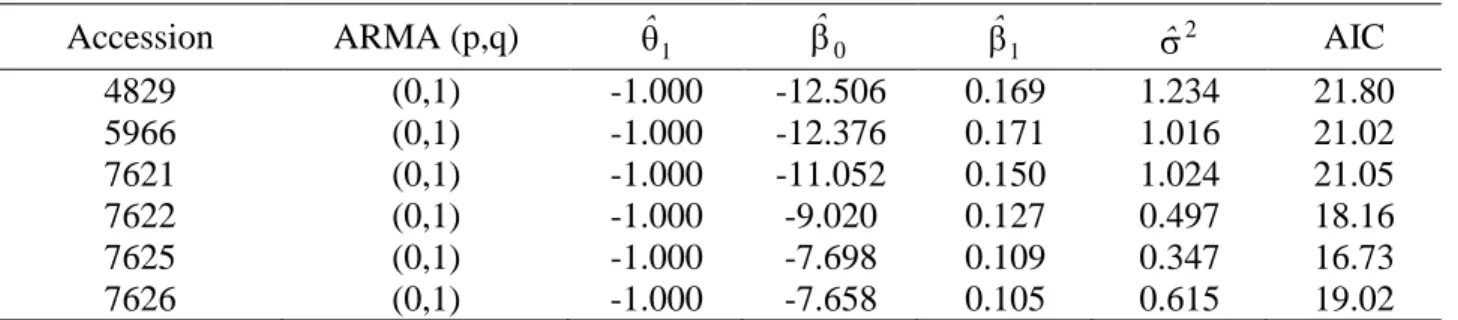
Among the tested models for the series of each access, those that presented lower values of AIC are presented on Table 1. It is possible to verify that the values of AIC are similar among them and all suggest the model ARMA (0,1) as the most indicated. Furthermore, it is noticed among the models that the estimates of regression parameters are also similar, indicating a similar behavior among the accessions in relation to the temporal development of dry matter.
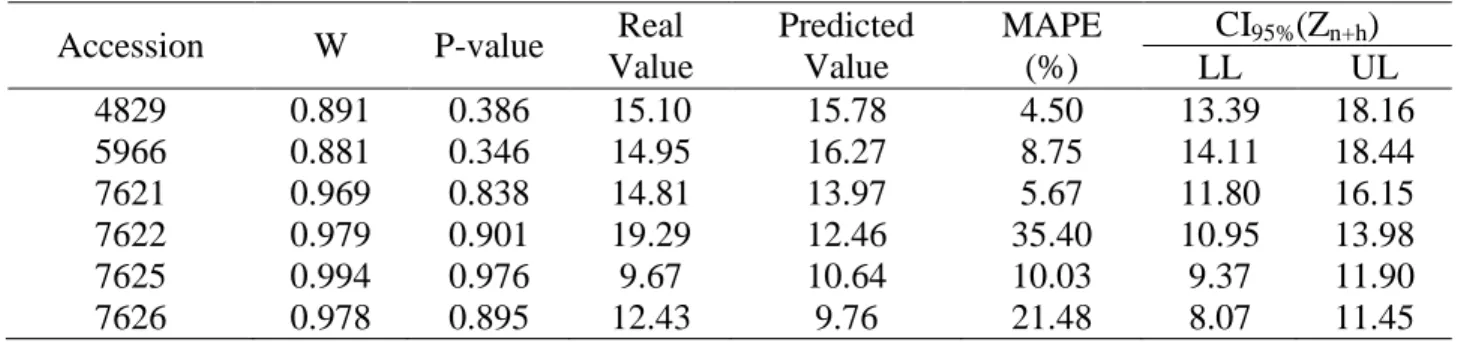
By the Shapiro-Wilk test applied to the residues of the modeled series, can be seen that all of them presented normal distribution (P>0.05) (Table 2). It is also noticed for the predicted values for time n+h (with n = 4 and h = 1) by the respective models were very similar to the real values. With the exception of accessions 7622 and 7626, all of the adjusted models presented MAPE lower or equal to 10%.
The dry matter data in the bulb at 170 dap were, in average, 17% higher than the ones obtained at 150 dap, that is, in the forecast time for harvest. According to Menezes Sobrinho et al., (1999), among the factors that affect the garlic production, we highlight the differential action of genes in different climatic conditions. Therefore, the photoperiod and the temperature are factors
that condition the planting time of the cultivars in cultivation environments, and under insufficient photoperiod conditions there is a vegetative growth without the normal formation of bulbs (Park & Lee, 1979). That is because the way of photoassimilates partition in distinct organs of the plant can suffer alterations due to environmental conditions. According to Stahlschmidt et al., (1997), the weight increment of the bulbs at the end of the cycle is related to the last phase of the vegetative cycle (30 to 40 days).
The average yield of the accesses used in this study was 10.1 t ha-1. Results similar to the ones found by Villas Bôas et
al., (2008) studying the production of bulbs
according to phosphate and potassium composting. Oliveira et al., (2003) in a study about the ideal point for harvest, have also found yields around 10 t ha-1; the same authors have quoted that the productivity varied according to the cultivar, and that the immature garlic harvest does not reflect in yield gains, besides affecting the quality characteristics and present lower rates of soluble solids, in which the higher values were found in the last harvest (162 days after planting).
Table 1. Summary of estimates of the adjusted models.
Accession ARMA (p,q) ˆ1 ˆ 0 ˆ1 ˆ 2 AIC
4829 (0,1) -1.000 -12.506 0.169 1.234 21.80 5966 (0,1) -1.000 -12.376 0.171 1.016 21.02 7621 (0,1) -1.000 -11.052 0.150 1.024 21.05 7622 (0,1) -1.000 -9.020 0.127 0.497 18.16 7625 (0,1) -1.000 -7.698 0.109 0.347 16.73 7626 (0,1) -1.000 -7.658 0.105 0.615 19.02
θ1: parameter component MA(1); β0, β1: simple linear regression parameters (interception and regression coefficient, respectively); σ2: residual variance
Table 2. Summary of the Shapiro-Wilk test (W), real values, dry matter, predicted values (g),
mean absolute percentage error (MAPE), and confidence intervals (LL: lower limit, UL: upper limit) for real values in time n + h (170 dap).
Accession W P-value Real Value Predicted Value MAPE (%) CI95%(Zn+h) LL UL 4829 0.891 0.386 15.10 15.78 4.50 13.39 18.16 5966 0.881 0.346 14.95 16.27 8.75 14.11 18.44 7621 0.969 0.838 14.81 13.97 5.67 11.80 16.15 7622 0.979 0.901 19.29 12.46 35.40 10.95 13.98 7625 0.994 0.976 9.67 10.64 10.03 9.37 11.90 7626 0.978 0.895 12.43 9.76 21.48 8.07 11.45
Figure 1 shows also the predictions made for the rate of dry matter in the bulbs at 170 dap, with the respective CI95%(Zn+h).
It is seen that the models represent the expectations relatively regarding the original series in which they were adjusted; however, only for accessions 7622 and 7626 the real value was outside the confidence interval.
The dry matter of the bulbs presented high correlation (P<0.01) with the yield culture data, as expected. It was observed that the forecasts using data of dry matter are viable to determine the culture yield of a determined phenological stadium.
Lastly, in the case of predicting values in future times using models with a MA(q) structure, Morettin & Toloi (2004) confirm that the predicted value in a step ahead data h, will simply be the mean of the series until the point h in question, when h>q.
CONCLUSIONS
The use of simple linear regression models with a error structure MA(1) have shown to be reasonable to conduct yield forecasting in accessions of garlic in medium cycle at twenty days after the predicted harvest time, taking as reference the data of dry matter of the bulb.
Time series models can then, be considered as a criterion to aid the decision making on the ideal time for garlic harvest, seeking possible increments in yield.
REFERENCES
BOX, G.; JENKINS, G. 1976. Time series
analysis, forecasting and control. San
Francisco: Holden-Day. 575p.
CALBO, A. G. 2010. Alho (Allium
sativum). Brasília, DF: Embrapa Hortaliças. Disponível em: <http://www.cnph.embrapa.br/laborato/ pos_colheita/alho.htm>. Acesso em: 26 Jun. 2010.
CARVALHO, L. G.; SEDIYAMA, G. C.; CECON, P. R.; ALVES, H. M. R. 2005.
Aplicação da análise harmônica por séries de Fourier para a previsão de produtividade da cultura do café no Estado de Minas Gerais. Engenharia
Agrícola, Jaboticabal, v.25, n.3, p.732-741.
DIGGLE, P. J. 1992. Time series: a
biostatistical introduction. Oxford:
Oxford University Press.
LIMA, R. C.; GÓIS, M. R.; ULISES, C. 2007. Previsão de preços futuros de
commodities agrícolas com diferenciações inteira e fracionária, e erros heteroscedásticos. Revista de
Economia e Sociologia Rural, Rio de
Janeiro, v.45, n.3, p.621-644.
MAROUELLI, W. A.; SILVA, W. L. C.;
MORETTI, C. L. 2002.
Desenvolvimento de plantas, produção e qualidade de bulbos de alho sob condições de deficiência de água no solo. Horticultura Brasileira, Brasília, v.20, n.3, p.470-473.
MENEZES SOBRINHO, J. A.; CHARCHAR, J. M.; ARAGÃO, F. A. S. 1999. Caracterização morfológica de germoplasma de alho por análises multivariadas de componentes principais e variáveis canônicas.
Horticultura Brasileira, Brasília, v.17,
n.2, p.96-101.
MORETTIN, P. A.; TOLOI, C. M. C. 2004.
Análise de séries temporais. São
Paulo: Edgard Blücher. 535p.
MURADÁS NETO, M. V.; CARVALHO, P. L. C.; SÁFADI, T. 2008. Análise preditiva e comparativa para séries de combustíveis no município de Lavras.
Revista Científica Symposium, Lavras,
v.6, n.1, p.55-61.
NASCIMENTO, C. R.; ZULLO JÚNIOR, J.; MOURA, G. B. A. 2009. Estimativa de produtividade da cana-de-açúcar utilizando séries temporais de imagens AVHRR/NOAA-17 e modelo fenológico-espectral. Revista Brasileira
de Ciências Agrárias, Recife, v.4, n.3,
p.329-337.
OLIVEIRA, C. M.; SOUZA, R. J.; MOTA, J. H.; YURI, J. E.; RESENDE, G. M. 2003. Determinação do ponto de colheita na produção de alho.
Horticultura Brasileira, Brasília, v.21,
n.3, p.506-509.
PAIVA, W. O.; MARQUES, G. V.; MESQUITA, J. B. R.; DANTAS R. S; FREITAS, F. W. A. 2008. Qualidade e conservação de frutos de melão amarelo em dois pontos de colheita. Revista
Ciência Agronômica, Fortaleza, v.39,
n.1, p.70-76.
PARK, Y. B.; LEE, B. Y. 1979. Study on growth and bulb formation of garlic plants (Allium sativum L.): the effect of daylenght on the bulb formation and secondary growth in 6 cloved garlic plants. Journal of the Korean Society
for Horticultural Science, Suwon,
v.20, n.1, p.1-4.
PINDYCK, R.; RUBINFELD, D. 1981.
Econometric models and economic forecast. Mcgraw-Hill, EUA.
R DEVELOPMENT CORE TEAM. 2011.
R: a language and environment for statistical computing. R Foundation for
Statistical Computing, Vienna, Áustria. Url http://www.r-project.org. ISBN 3-900051-07-0.
SILVA, M. I. S.; GUIMARÃES, E. C.; TAVARES, M. 2008. Previsão da temperatura média mensal de Uberlândia, MG, com modelos de séries temporais. Revista Brasileira de Engenharia Agrícola e Ambiental,
Campina Grande, v.12, n.5, p.480–485.
SOUZA, R. J.; MACÊDO, F. S.; YURI, J. E. 2007. Alho (Allium sativum L.). In: PAULA JÚNIOR, T.J.; VENZON, M. (Org.). 101 Culturas: manual de
tecnologias agrícolas. Belo Horizonte:
STAHLSCHMIDT, O.; CAVAGNARO, J. B.; BORGO, R. 1997. Growth analysis of three garlic (Allium sativum L.) cultivars with differences in yield. Acta
Horticulturae (ISHS), v.433,
p.427-434.
TRANI, P. E. 2005. Avaliação dos acessos de alho pertencentes à coleção do Instituto Agronômico de Campinas.
Horticultura Brasileira, Brasília, v.23,
n.4, p.935-939.
VILLAS BÔAS, R. L.; LIMA, C. P.; BACKES, C.; GODOY, L. J. G.; IMAIZUMI, I. 2008. Adubações fosfatada e potássica afetando a produção de bulbos de alho. Revista