Pedro José Pereira da Silva
Pathogenic potential characterization of two
distinct
Pseudomonas aeruginosa
strains
Dissertação de Mestrado em Bioquímica Aplicada
Área de especialização em Biomedicina
Trabalho efetuado sob orientação de
Professora Doutora Andreia Gomes
Professor Doutor Pedro Santos
Professora Doutora Isabel Alcobia
Janeiro de 2016
Universidade do Minho
Escola de Ciências
Declaração
Nome
Pedro José Pereira da Silva
Endereço eletrónico: [email protected] Telefone: 00351915201755 Número de identificação civil: 13758599
Título da dissertação de mestrado:
“Pathogenic potential characterization of two distinct Pseudomonas aeruginosa strains”
“Caracterização do potencial patogénico de duas estirpes distintas de Pseudomonas aeruginosa”
Orientadores:
Professora Doutora Andreia Gomes
Co-orientadores:
Professor Doutor Pedro Santos Professora Doutora Isabel Alcobia
Ano de conclusão: 2016
Designação do Mestrado ou do Ramo de Conhecimento do Doutoramento:
Ciências – Mestrado em Bioquímica Aplicada – Área de especialização em Biomedicina
1. É AUTORIZADA A REPRODUÇÃO INTEGRAL DESTA DISSERTAÇÃO APENAS PARA EFEITOS DE INVESTIGAÇÃO, MEDIANTE DECLARAÇÃO ESCRITA, QUE A TAL SE COMPROMETE.
Universidade do Minho, 29 de Janeiro de 2016
To Hugo, my friend and little brother. Para sempre o rapaz que sempre sorriu.
Acknowledgments
First of all, I would like to sincerely and gratefully acknowledge my supervisors Professor Andreia Gomes and Professor Pedro Santos, for their closely guidance, orientation and patience through the development of this thesis work. Their mentorship was exceedingly significant to my person as a scientist, in providing me a well-rounded experience in scientific research and stimulated me to grow as a critic biochemist and independent thinker. A special and honest thanks to Professor Isabel Alcobia who also took part in the supervision of this thesis work.
Immensely, I want to acknowledge my parents. There is no one who deserves a greater “thank you” than they deserve. They always stood by my side, supporting my academic course, and even in spite of not being easy, they fought for me and they deprive from many comforts, sacrificing them just to fulfil their biggest dream: give their children the education and opportunities that they weren’t allowed to achieve.
To my little sister, Rita, I want to thank for her support and for her thoughtfulness towards my thesis work period. I have much pride on her and I know she will be a great woman.
And to all my family who supported me during this period of my academic life.
To all people and co-works from the Biotechnology Molecular Lab and the Animal Biology Lab I want to thank. And among them all, a special and merited acknowledgement to Artur who motivated me and guided me through the experimental work.
To Liliana, a very special person in my life, who in spite of accompanied me only in the last part of this thesis work, always cheered me up and motivated me to pursuit the objective until the end and never give up, to that I most thankful.
To my great and good friends, Eduardo, Ivo, Júnio and Nelson, for their support and friendship that always make the most of everything. Also, I want to acknowledge my friend Eva, for her support and concern.
To all my colleagues from the Bachelor of Science in Biochemistry and Master of Science in Applied Biochemistry. Especially, to my dear friend Rubén that since the begging of my academic course he proved to be a respectable companion and a loyal friend.
I want to acknowledge, also, the Portuguese Red Cross and the Portuguese Youth Red Cross that has been part of my life, which contributed to the building my character and personality, and motivated me to succeed in my academic course.
Finally, I want to acknowledge someone that cannot share, anymore, from my joys and sorrows, from my achievements and failures. Someone simple in is way of being, but always with something to learn from him. He managed always to come out from the difficult times with a smile in his face. And he taught me so much, so much… For all of that, thank you Hugo, always.
Resumo
“Caracterização do potencial patogénico de duas estirpes distintas de Pseudomonas aeruginosa”
A Pseudomonas aeruginosa é um patogéneo oportunista e ubíquo, exibindo altos níveis de resistência a antibióticos e proliferando em muitos ambientes, incluindo unidades de saúde. A alta infecciosidade deste patogéneo em pacientes debilitados e imunocomprometidos, especialmente em pacientes com fibrose cística, está associada a altas taxas de morbidade e mortalidade. Não é de estranhar que esta bactéria se tenha tornado numa das principais preocupações em termos de infeções hospitalares, e por conseguinte, motivado vários trabalhos de caracterização deste patogéneo.
Uma colaboração entre o Centro de Biologia Molecular e Ambiental da Universidade do Minho e o Hospital de Braga permitiu o acesso a dois diferentes isolados clínicos do muco pulmonar dos pacientes infetados com Pseudomonas aeruginosa, designados como HB13 e HB15. A estirpe HB13 não produz pigmentos e evidenciou resistência a uma ampla gama de antibióticos. Por outro lado, a estirpe HB15 produz uma quantidade significativa de piocianina e é suscetível a antibióticos. A estirpe PAO1 da Pseudomonas aeruginosa foi utilizada neste trabalho de tese como estirpe de referência. Estas estirpes foram selecionadas para avaliar os seus níveis de citotoxicidade nas linhas celulares L929 e A549, por incubação com os fatores de virulência segregados. As alterações morfológicas e stress oxidativo induzido nestas linhas celulares foram também consideradas neste trabalho de tese.
Os resultados do estudo de citotoxicidade mostraram que as estirpes de Pseudomonas aeruginosa quando proliferando fora de um contexto de infeção, continuam capazes de produzir um conjunto de fatores de virulência segregados que induziram altos níveis de inviabilidade celular nas células L929 e A549. De acordo com a literatura, estabeleceu-se que a estirpe HB15 é mais patogênica do que a estirpe HB13, demonstrando um padrão de patogenicidade semelhante ao da estirpe PAO1. A análise da morfologia das células L929 e A549, incubadas com os fatores de virulência das estirpes, por microscopia de contraste de fase e microscopia de fluorescência, revelou várias alterações na morfologia celular, tais como aglutinação celular, alteração da morfologia celular, formação de corpos apoptóticos, desorganização do citoesqueleto e fragmentação nuclear. Os resultados do estudo de stress oxidativo mostraram que, nas fases iniciais de incubação com os fatores de virulência das estirpes, as linhas celulares aumentaram a produção de espécies reativas de oxigénio, conduzindo a uma intensificação do stress oxidativo, apontado como uma das causas da citotoxicidade das estirpes testadas da Pseudomonas aeruginosa.
Este trabalho de tese abriu caminho para uma melhor compreensão do potencial patogênico destas estirpes e trabalhos futuros devem ser direcionados a fim de conseguir-se uma avaliação mais completa dos mecanismos e processos celulares subjacentes à patogenicidade destas estirpes.
Abstract
“Pathogenic potential characterization of two distinct Pseudomonas aeruginosa strains”
Pseudomonas aeruginosa is an opportunist and ubiquitous pathogen, displaying high levels of antibiotic resistance and proliferating in many environments, including healthcare facilities. The high infectivity of this pathogen in impaired and immunocompromised patients, especially cystic fibrosis patients, leads to high rates of morbidity and mortality. It is no surprise that this bacterium became one of the main concerns regarding nosocomial infections, and so forth driven the attention of many researchers to study and characterize this pathogen.
A collaboration between the Molecular and Environment Biology Centre of the University of Minho and the Hospital of Braga, provided two different clinical isolates from the sputum of the patients infected with Pseudomonas aeruginosa, classified as HB13 and HB15. The strain HB13 does not produce pigments and evidenced resistance to a wide range of antibiotics. On the other hand, the strain HB15 produces a significant quantity of pyocianin pigments and is susceptible to antibiotics. The Pseudomonas aeruginosa strain PAO1 was used in this thesis work as a reference strain. These strains were selected to assess their levels of cytotoxicity, in the L929 and A549 cell lines by incubation with the strains’ secreted virulence factors. Morphological changes and oxidative stress induced in these cell lines were also considered in this thesis work.
The cytotoxicity study outcomes showed that the Pseudomonas aeruginosa strains when growing out of an infection context, were still able to produce a set of secreted virulence factors that induced high levels of cellular death on L929 and A549 cells. Previous literature established that the HB15 strain is more pathogenic than the HB13 strain, demonstrating a pathogenic pattern close to the PAO1 strain. The analysis of the morphology of the L929 and A549 cells, incubated with the strains’ virulence factors, by contrast phase microscopy and fluorescence microscopy, unveiled several cellular morphology alterations, such as cell agglutination, loss of cellular shape, cellular blebbing, evidences of apoptotic bodies, cytoskeleton disorganization and nuclear fragmentation. The results of the oxidative stress study showed that in the early stages of incubation with the strains’ virulence factors, the cell lines increased the production of reactive oxygen species, leading to an intensification of oxidative stress, pointed out as one of the causes of the Pseudomonas aeruginosa strains cytotoxicity.
This thesis work paved the way for perceiving and understanding the pathogenic potential of these strains, and future work should be directed in order to achieve a more complete assessment of the mechanisms and cellular processes underlying the pathogenicity of these strains.
Table of contents
Declaração ... ii Acknowledgments ... v Resumo ... vii Abstract ... ix Table of contents ... xi Glossary of abbreviations ... xvList of Figures ... xvii
List of Tables ... xxv
1. Introduction ... 1
1.1. Bacterial Pathogenesis: an actual and worldwide serious concern ... 3
1.2. Pseudomonas aeruginosa, the bacterium and the pathogen ... 7
1.2.1. Pathogenicity ... 8
1.2.1.1. Virulence factors ... 9
1.2.1.1.1. Cell-associated virulence factors ... 9
1.2.1.1.2. Secreted virulence factors ... 11
1.2.1.2. Biofilms ... 14
1.2.1.3. Quorum sensing ... 16
1.2.1.4. Antibiotic resistance ... 16
1.3. Bacterial Strains ... 21
1.3.1. Pseudomonas aeruginosa strains ... 21
1.3.1.1. Clinical isolates HB13 and HB15 ... 25
1.4. Bacterial infection mechanisms and host models ... 27
1.4.1. Infection host models ... 30
1.4.1.1 Cell lines host models ... 34
1.4.1.1.1 L929 and A549 cell lines ... 35
1.5. Objectives ... 38
2. Material and Methods ... 39
2.1. Biological Material ... 41
2.1.1. Bacterial species and strains... 41
2.1.2. Bacterial culture media ... 41
2.1.3. Animal cell lines maintenance ... 41
2.2. Pseudomonas aeruginosa virulence factors ... 43
2.2.1. Growth conditions of Pseudomonas aeruginosa strains ... 43
2.2.2. Bacterial culture supernatants extraction ... 43
2.2.3. Total protein quantification ... 43
2.3. Virulence studies ... 44
2.3.1. Pseudomonas aeruginosa virulent factors testing concentrations ... 44
2.3.2. pH tests ... 44
2.3.3. Cell lines growth conditions ... 44
2.3.4. Cytotoxicity tests ... 44
2.3.4.1. Incubations with virulent factors ... 45
2.3.4.2. MTT assay ... 45
2.3.5. Cellular morphology observations ... 46
2.3.5.1. Sample preparation for fluorescence microscopy ... 46
2.3.5.2. Incubation with virulent factors ... 46
2.3.5.3. Cytoskeleton and nucleus staining ... 46
2.3.6. Oxidative stress tests ... 47
2.3.6.1. Sample preparation... 47
2.3.6.2. Incubation with virulent factors ... 47
2.3.6.3. DCF assay ... 47
2.4. Statistical Analysis ... 48
3. Results and Discussion ... 49
3.1. Bacterial culture growth ... 51
3.2. Virulence factors extraction ... 51
3.3. Protein quantification of the supernatants ... 52
3.4. pH measurements of the supernatants concentrations of the Pseudomonas aeruginosa strains .... 53
3.5. Cytotoxicity tests ... 54
3.5.1. Cytotoxicity of culture supernatants of the Pseudomonas aeruginosa strains in the L929 and A549 cell lines ... 54
3.5.2. Comparison of cytotoxicity in L929 and A549 cell lines exposed to culture supernatants from the P. aeruginosa strains ... 61
3.6. Morphology alteration studies ... 63
3.6.1. Cellular morphological changes in L929 cell line ... 63
3.6.2. Cellular morphological changes in A549 cell line ... 69
3.7. Final considerations and future perspectives ... 74
4. References ... 79
5.1. Appendix 1 – pH measurements of the supernatant concentrations of the Pseudomonas aeruginosa strains ... 99 5.2. Annex 2 – Cytotoxicity of Pseudomonas aeruginosa strains in L929 cell availed in all concentrations tested ... 100 5.3. Annex 3 – Cytotoxicity of Pseudomonas aeruginosa strains in A549 cell availed in all concentrations tested ... 103 5.4. Annex 4 - L929 and A549 cell line culture growth through time ... 106 5.5. Annex 5 - Oxidative stress induced by Pseudomonas aeruginosa strains culture supernatants ... 107
Glossary of abbreviations
AHL N-acyl homoserine lactone
AprA Alkaline protease
AQ 2-alkyl-4-quinolone
ATCC American Type Culture Collection
cAMP Cyclic adenosine monophosphate
CDC Centers for Disease Control and Prevention
CF Cystic fibrosis
CFU Colony forming-unit
DCF Dichlorofluorescein
DCFH-DA 2’,7’ –dichlorofluorescein diacetate
DMEM Dulbecco's Modified Eagle Medium
DMSO Dimethyl sulfoxide
DNA Deoxyribonucleic acid
ECDC European Centre for Disease Prevention and Control
EDTA Ethylenediaminetetraacetic acid
EF2 Elongation factor 2
ESBL Extended spectrum beta-lactamase
ETA Exotoxin A
ExoS Exoenzyme S
ExoT Exoenzyme T
ExoU Exoenzyme U
ExoY Exoenzyme Y
FBS Fetal bovine serum
FliD Flagellar cap protein
CG Guanine-Cytosine
GI Genomic island
HAI Healthcare acquired infections
HB13 Hospital Braga 13
HB15 Hospital Braga 15
HEPES 2-[4-(2-hydroxyethyl)piperazin-1-yl]ethanesulfonic acid
HHQ 2-heptyl-4-quinolone
IC50 Half maximal inhibitory concentration
IgG Immunoglobulin G
LasA Pseudomonas aeruginosa staphylolysin
LasB Elastase B
LB Lysogeny broth
LESB58 Liverpool Epidemic Strain B58
LPS Lipopolysaccharide
MBL Metallo-beta-lactamase
MDR Multidrug-resistance
MRSA Methicillin-resistant Staphylococcus aureus
MTT (3-(4,5-dimethylthiazol-2-yl)-2,5-diphenyltetrazolium bromide
NAD(P)H Nicotinamide adenine dinucleotide phosphate-oxidase
NK Natural Killer
OD Optical density
ORF Open reading frame
PA Pseudomonas aeruginosa
PA7 Pseudomonas aeruginosa 7
PA14 Pseudomonas aeruginosa 14
PAI-1 Pseudomonas aeruginosa autoinducer 1
PAI-2 Pseudomonas aeruginosa autoinducer 2
PAO1 Pseudomonas aeruginosa strain O1
PAPI-1 Pseudomonas aeruginosa pathogenic islands 1
PAPI-2 Pseudomonas aeruginosa pathogenic islands 2
PBS Phosphate-buffered saline
PQS Pseudomonas quinolone signal
QS Quorum sensing
Rhl Rhamnolipid
RND Resistance-nodulation-division
Tfp Type IV pili
TLR5 Toll-like receptor 5
TTSS Type III secretion sytem
VISA Vancomycin-intermediate Staphylococcus aureus
VRE Vancomycin-resistant Enterococci
List of Figures
Figure 1 - Top leading causes of death in the world 2012. In the bar graphic, it is represent the main
leading causes of death worldwide, in the year 2012. The first cause is ischaemic heart disease (7.4 million deaths), second it is stroke also known as cerebrovascular accident (6.7 million deaths), third it is chronic obstructive pulmonary disease (3.1 million deaths), fourth it is lower respiratory infectious (3.1 million deaths), fifth it is trachea, bronchus, lungs cancer (1.6 million deaths), sixth it is HIV/AIDS (1.5 million deaths), seventh it is diarrhoeal diseases (1.5 million deaths), eighth it is diabetes mellitus (1.5 million deaths), ninth it is road injury (1.3 million deaths) and tenth it is hypertensive heart disease (1.1 million deaths). Adapted from World Health Organization, Fact Sheet nº 310 (2014) [2]. ... 3
Figure 2 - Percentage (%) of MDR Pseudomonas aeruginosa isolates by country in Europe, in 2012. Adapted from ECDC surveillance report (2013) [12]. ... 5 Figure 3 – Scanning electron microscopy images of Pseudomonas aeruginosa bacteria. Image of
adherent isolate of Pseudomonas aeruginosa forming clumps of cells. White bar indicates the image scale (1 µm). Adapted from Deligianni (2010) [20]. ... 7
Figure 4 - Model of Pseudomonas aeruginosa pathogenicity in an immunocompromised host's infection. The figure represents the pathogenic features of P. aeruginosa following a context of infection in a cystic fibrosis patient airways. Pathogenic features such as arranged colonization, cell-associated virulence factors, secreted virulence factors, production of biofilms and antibiotic resistance are illustrated in the figure enhancing the infection development in the debilitated host. Adapted from Cohen (2012) [27]. ... 9
Figure 5 - Type IV pilli. Illustrate representation of the type IV pilus mechanism. In the inner membrane the
pilin monomer is embedded with its hydrophilic head placed in the periplasm. The pillin signal sequence is cleaved by a pre-pilin peptidase (PilD). The pilus is extended aided by supplementary assembly proteins. After extension is done, the retraction starts by action of PilT. Adapted from Kaiser (2000) [32]. ... 10
Figure 6 - Schematic representation of Pseudomonas aeruginosa flagellum. Structure of the P.
aeruginosa flagellum embedded in the cell wall and membrane and its components. Adapted from EMBL-EBI BioModels Database (2012) [35]. ... 11
Figure 7 - Model of type III secretion system (TTSS) function. The figure represents the TTSS divided
into 5 components: the regulatory proteins, the effector proteins, the chaperones, the needle complex and the translocation apparatus. The aseemble of this 5 components makes the TTSS function and allows the injection of effector proteins into the host cells. Adapted from Hauser (2009) [42]... 13
Figure 8 - Pseudomonas aeruginosa culture in agar plate displaying pyocyanin production.
Adapted from Mavrodi (2001) [46]... 14
Figure 9 - Biofilm development. The figure represent the 5 stages of the biofilm development. (1) First stage
of biofilm development, the initial attachment. (2) Second stage of biofilm development, the irreversible attachment. (3) Third stage of biofilm development, the initial phase of maturation. (4) Fourth stage of biofilm development, the definitive phase of maturation. (5) Fifth stage of biofilm development, the dispersion. Adapted from Monroe (2007) [51]. ... 15
Figure 10 - Bacterial population variations induced by antibiotic action. Bacteria with acquired
antibiotic resistance (red coloured) compete with the susceptible counterparts in their population niche. (1) When in absence of antibiotic administration, the resistant bacteria will not predominate unless they have a higher inherent biological fitness. Plus, the acquirement of resistance to antibiotics generally represents a loss of biological fitness. (2) When there’s an administration of antibiotic the susceptible bacteria growth is inhibited which turns in an ecological opportunity for the resistant bacteria to thrive. (3) Under this conditions the resistant bacteria will proliferate and dominate the bacterial population. After the population is absent from the antibiotic action the bacterial population may return to its original scenario and the dominance of the resistant bacteria
disappear. (4) Alternatively the resistant bacteria may acquire compensatory mutations which will maintain a noticeable occurrence of the resistant bacteria among the bacterial population. Adapted from Martínez (2007) [61]. ... 17
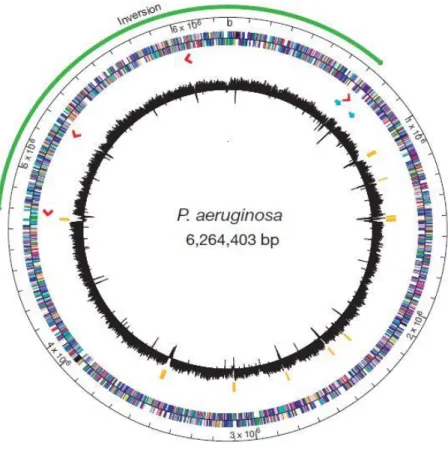
Figure 11 - Genome representation of PAO1. The outer circle is a base pair scale (each tick equivalent to
100,000 bp) that represents the chromosomal location. The colour distribution of the central circle represents genes according to its functional category. The arrow in the representation stands for the direction of transcription (the inner band represents the minus strand, the outer band represents the plus strand). Green arrow represents the inverted region resulting from homologous recombination event between rrnA and rrnB. Red arrows represent transcription direction and locations of rRNA genes. Blue arrows represents locations containing probable bacteriophages. The inner black band represents the G+C percentage schemed as the average for non-overlapping 1000 bp windows spanning one strand for the entire P. aeruginosa genome. Yellow bars represents genome regions of ≥ 3000 bp with G+C content of two standard deviations (<58.8%) below the mean (66.6%). Adapted from Stover (2000) [19]. ... 22
Figure 12 - Pseudomonas aeruginosa strains phylogenetic tree. The tree presented is an unrooted
maximum likelihood tree representing 389 genomes of P. aeruginosa strains, based on SNPs within the core genome, using Harvest method (100 bootstraps). The tree is divided into three major groups of strains (group 1: blue, group 2: orange/pink, group 3: green). The strains distributed for each group are presented in circles. Black circles represent the strains already sequenced before the Freschi et al. study [76]; White circles represent one or more strains sequenced during Freschi et al. study [76]. The group 3 true appearance was contracted for visual proposes, the miniature of the tree true appearance is displayed in a framed miniature. Adapted from Freschi et al., 2015 [76]. ... 24
Figure 13 – Summary of the bacterial mechanisms for pathogenicity. (A) Bacterial pathogens finding
a human host may induce a set of host responses and counter with several host defence evading mechanisms. The components from the pathogen that interact with the host include: (I) the capsule, which “frustrate” the phagocytic function and protect the pathogen from neutrophil and macrophage engulfment; (II) lipopolysaccharides (LPS) and cell wall components which may lead to septic shock; (III) toxins responsible for host cell damage and aiding in invasion; and (IV) adhesins that eases the binding of the pathogen with the host surface. In what level these mechanisms intervene in the pathogenesis of the infection is dependent of some factors such as bacterial species and strains, immune status of the host and pathogen entry site. (B) When the bacterial pathogen adheres to the host surface it can break into cell tissue by expressing and secreting proteases and glycanases that destroy the extracellular matrix. Furthermore, the pathogen invading cell tissue is also able to access intracellular domain. This process can be aided by action of natural phagocytosis mechanisms of macrophages and neutrophils or by action of an induced uptake where pathogen induce the host cell to engulf the adhered bacteria. One of the most common methods of the pathogens to induce uptakes is the type III secretion system which injects bacterial signalling proteins into the host cells. When inside the host cell, the pathogen can reside in the cell host cytosol or as a phagosome or even as a phagolysome (a lysosome fused with hagosome). Adapted from Wilson et al., 2002 [1]. ... 28
Figure 14 – L929 cells. Contrast phase microscope shot of L929 cell culture grown in 96 well plate at 24h
endpoint. The image show abundant distinguishable fibroblasts with spindle and stellate shape. The scale bar is set for 200 µm. ... 36
Figure 15 - A549 cells. Contrast phase microscope shot of A549 cell culture grown in 96 well plate at 24h
endpoint. The image show abundant distinguishable fibroblasts with spindle and stellate shape. The scale bar is set for 200 µm. ... 37
Figure 16 – Comparison between cellular viabilities from two time points of bacterial growth of Pseudomonas aeruginosa culture supernatant in L929 cells. The graphic displays the comparison of
HB15 and HB13) culture supernatants at the concentration 3.42 µg/ml, in all the 3 end times of incubation (24h, 48h, 72), between the bacterial growth periods t1 (24 hours of bacterial growth) and t2 (48 hours of bacterial growth). The resulting data was statistically analysed by a One-way ANOVA with Tukey test where the P value was set for: P <0.05. Significant values comparing cellular viabilities between t1 and t2 were represented in the graphic as, * for P <0.05, ** for P <0.01 and *** for P <0.001. ... 55
Figure 17 - Cytotoxicity of the Pseudomonas aeruginosa strains culture supernatants on L929 cells. The graphic displays the results of the MTT assay performed on L929 cells submitted to two total protein
concentrations (3.42 µg/ml and 20.50 µg/ml) of the culture supernatants of the Pseudomonas aeruginosa strains (PAO1, HB15 and HB13) in cell viability percentage represented by bars with the respective standard deviation represented by vertical lines for a number of replicas n=2. The bar legend represents the end times of incubation (24h, 48h and 72h) with the supernatants. The full data is available in the appendix section of the thesis. The controls are presented in the graphic represented as “CONTROL”. The negative control has the constant value of 100% of viability for each end times of incubation and not shown in the graphic. The positive control is represented as “+” on the graphic. The controls of the bacterial culture media (LB) are represented on the graphic as “LB 25%” and “LB 7.5%”. The resulting data was statistically analysed by a One-way ANOVA with Tukey test where P value was set for: P <0.05. Significant values comparing to the negative control were represented in the graphic as, * for P <0.05, ** for P <0.01 and *** for P <0.001. ... 57
Figure 18 -- Comparison between cellular viabilities from two periods of bacterial growth of Pseudomonas aeruginosa culture supernatant in A549 cells. The graphic displays the comparison of
the cellular viabilities results in A549 cells from the MTT assay for each Pseudomonas aeruginosa strains (PAO1, HB15 and HB13) culture supernatants at the concentration 3.42 µg/ml, in all the 3 end times of incubation (24h, 48h, 72), between the bacterial growth periods t1 (24 hours of bacterial growth) and t2 (48 hours of bacterial growth). The resulting data was statistically analysed by a One-way ANOVA with Tukey test where P value was set for: P <0.05. Significant values comparing cellular viabilities between t1 and t2 were represented
in the graphic as, * for P <0.05, ** for P<0.01 and *** for P<0.001. ... 59
Figure 19 - Cytotoxicity of the Pseudomonas aeruginosa strains culture supernatants on A549 cells. The graphic displays the results of the MTT assay performed on A549 cells submitted to two total protein
concentrations (3.42 µg/ml and 20.50 µg/ml) of the culture supernatants of the Pseudomonas aeruginosa strains (PAO1, HB15 and HB13) in cell viability percentage represented by bars with the respective standard deviation represented by vertical lines for a number of replicas n=2. The bar legend represents the end times of incubation (24h, 48h and 72h) with the supernatants. The full data is available in the appendix section of the thesis. The controls are presented in the graphic represented as “CONTROL”. The negative control has the constant value of 100% of viability for each end times of incubation and not shown in the graphic. The positive control is represented as “+” on the graphic. The controls of the bacterial culture media (LB) are represented on the graphic as “LB 25%” and “LB 7.5%”. The resulting data was statistically analysed by a One-way ANOVA with Tukey test where P value was set for: P <0.05. Significant values comparing to the negative control were represented in the graphic as, * for P <0.05, ** for P <0.01 and *** for P <0.001. ... 60
Figure 20 – Cellular viability comparison of the L929 and A549 cell lines incubated with the supernatants from the Pseudomonas aeruginosa strains. The graphic displays the comparison of the
cellular viabilities results of the MTT assays performed between the two cell lines L929 and A549 incubated with two concentrations (3.42 µg/ml and 20.50 µg/ml) of culture supernatants of the Pseudomonas aeruginosa strains where the viability variance between cell lines were highest. The cellular viabilities are represented for all end time points of incubation with the supernatants. The full data is available in the appendix of the thesis. The graphic bars represents the cellular viability percentage and the respective vertical lines represents the standard deviation, for a number of replicas n=2. The resulting data was statistically analysed by a One-way ANOVA with
Tukey test where p value was set for: P <0.05. Significant values comparing cellular viabilities of L929 cells and A549 cells were represented in the graphic as, * for P <0.05, ** for P <0.01 and *** for P <0.001. ... 61
Figure 21 - Morphologic alterations in L929 cells induced by Pseudomonas aeruginosa strains culture supernatants. The figure shows the L929 cells morphology alterations induced by Pseudomonas aeruginosa strains culture supernatants, cultured in 96 well plate, using phase contrast microscopy. The figure is divided in two sections, referring to morphologic alterations at 3.42 µg/ml and 20.50 µg/ml. The images of the cells are displayed by incubation times (24, 48 and 72 hours) horizontally and by P. aeruginosa strain (PAO1, HB15 and HB13) vertically. The scale bars represents 100µm length. Cytotoxicity data from previous results are shown to make relation between cellular viability and cellular morphology observations. Data represents the means ± SD, n=2 independent experiments. * for P <0.05, ** for P <0.01 and *** for P <0.001. ... 65
Figure 22 - Fluorescence microscopy of L929 cells to study morphological features induced by Pseudomonas aeruginosa strains. The cytoskeleton of the L929 cells are stained with the probe Phalloidin
Alexa Fluor 568 (red) and the nucleus of the L929 cells are stained with the bisbenzimide dye Hoechst 34580 (blue). The merging of the individual stained components provides a composite image refining the cellular morphology observation. The L929 control cells cultured in DMEM medium, grown for 24h and transferred in cover slips for prior microscopy observation are represented as “Control ( – )”. The L929 cells incubated with the supernatants of the P. aeruginosa strains are represented as “PAO1”, “HB15” and “HB13”. All cells were incubated with 3.42 µg/ml of P. aeruginosa strains supernatants during 24h, respectively and transferred in cover slips for prior microscopy observation. The white arrows points to noteworthy morphological features, in the up row (Phalloidin Alexa Fluor 568) indicates a visible cellular blebbing and in the middle row (Hoechst 34580) indicates a visible nuclear fragmentation. The scale bar represents 25 µm length. ... 68
Figure 23 - Morphologic alterations in A549 cells induced by Pseudomonas aeruginosa strains culture supernatants. The figure shows the A549 cells morphology alterations induced by Pseudomonas aeruginosa strains culture supernatants, cultured in 96 well plate, using phase contrast microscopy. The figure is divided in two sections, referring to morphologic alterations at 3.42 µg/ml and 20.50 µg/ml. The images of the cells are displayed by incubation times (24, 48 and 72 hours) horizontally and by P. aeruginosa strain (PAO1, HB15 and HB13) vertically. The scale bars represents 100µm length. Cytotoxicity data from previous results are shown to make relation between cellular viability and cellular morphology observations. Data represents the means ± SD, n=2 independent experiments. * for P <0.05, ** for P <0.01 and *** for P <0.001. ... 70
Figure 24 - Fluorescence microscopy of A549 cells to study morphological features induced by Pseudomonas aeruginosa strains. The cytoskeleton of the A549 cells are stained with the probe Phalloidin
Alexa Fluor 568 (red) and the nucleus of the L929 cells are stained with the bisbenzimide dye Hoechst 34580 (blue). The merging of the individual stained components provides a composite image refining the cellular morphology observation. The A549 control cells cultured in DMEM medium, grown for 24h and transferred in cover slips for prior microscopy observation are represented as “Control ( – )”. The A549 cells incubated with the supernatants of the P. aeruginosa strains are represented as “PAO1”, “HB15” and “HB13”. All cells were incubated with 3.42 µg/ml of P. aeruginosa strains supernatants during 24h, respectively and transferred in cover slips for prior microscopy observation. The white arrows points to noteworthy morphological features, in the up row (Phalloidin Alexa Fluor 568) indicates a visible cellular blebbing and in the middle row (Hoechst 34580) indicates a visible nuclear fragmentation. The scale bar represents 25 µm length. ... 72
Figure A 1 - pH measurements of the supernatant concentrations of the Pseudomonas aeruginosa strains. The graphic exhibits pH measurements of the highest and lowest concentration of the supernatants of
48h) from the serial dilutions made. Grey bars represent the supernatant P. aeruginosa strains dilution concentrations, light grey for the t1 and hard grey for the t2). The pH measurements for the DMEM medium and
LB medium are also shown represent by the white bars. The resulting data was statistically analysed by a One-way ANOVA with Tukey test where P value was set for: P <0.05. Significant values comparing to the negative control were represented in the graphic as, * for P <0.05, ** for P <0.01 and *** for P <0.001. ... 99
Figure A 2 - Cytotoxicity of the Pseudomonas aeruginosa HB15 strain culture supernatant on L929 cells. The graphic displays the results of the MTT assay performed on L929 cells submitted to a range
of total protein concentrations of the culture supernatants of the Pseudomonas aeruginosa HB15 strain, grown in two different time setups, represented in the graphic as t1 and t2, respectively 24 hours of bacterial culture
growth and 48 hours of bacterial culture growth, in cell viability percentage represented by bars with the respective standard deviation represented by vertical lines for a number of replicas n=2. The bar legend represents the end times of incubation (24h, 48h and 72h) with the supernatants. The controls are presented in the graphic represented as “CONTROL”. The negative control has the constant value of 100% of viability for each end times of incubation and not shown in the graphic. The positive control is represented as “+” on the graphic. The controls of the bacterial culture media (LB) are represented on the graphic as “LB 25%” and “LB 7.5%”. The resulting data was statistically analysed by a One-way ANOVA with Tukey test where P value was set for: P <0.05. Significant values comparing to the negative control were represented in the graphic as, * for P <0.05, ** for P <0.01 and *** for P <0.001. ... 100
Figure A 3 - Cytotoxicity of the Pseudomonas aeruginosa HB13 strain culture supernatant on L929 cells. The graphic displays the results of the MTT assay performed on L929 cells submitted to a range
of total protein concentrations of the culture supernatants of the Pseudomonas aeruginosa HB13 strain, grown in two different time setups, represented in the graphic as t1 and t2, respectively 24 hours of bacterial culture
growth and 48 hours of bacterial culture growth, in cell viability percentage represented by bars with the respective standard deviation represented by vertical lines for a number of replicas n=2. The bar legend represents the end times of incubation (24h, 48h and 72h) with the supernatants. The controls are presented in the graphic represented as “CONTROL”. The negative control has the constant value of 100% of viability for each end times of incubation and not shown in the graphic. The positive control is represented as “+” on the graphic. The controls of the bacterial culture media (LB) are represented on the graphic as “LB 25%” and “LB 7.5%”. The resulting data was statistically analysed by a One-way ANOVA with Tukey test where P value was set for: P <0.05. Significant values comparing to the negative control were represented in the graphic as, * for P <0.05, ** for P <0.01 and *** for P <0.001. ... 101
Figure A 4 - Cytotoxicity of the Pseudomonas aeruginosa PAO1 strain culture supernatant on L929 cells. The graphic displays the results of the MTT assay performed on L929 cells submitted to a range
of total protein concentrations of the culture supernatants of the Pseudomonas aeruginosa PAO1 strain, grown in two different time setups, represented in the graphic as t1 and t2, respectively 24 hours of bacterial culture
growth and 48 hours of bacterial culture growth, in cell viability percentage represented by bars with the respective standard deviation represented by vertical lines for a number of replicas n=2. The bar legend represents the end times of incubation (24h, 48h and 72h) with the supernatants. The controls are presented in the graphic represented as “CONTROL”. The negative control has the constant value of 100% of viability for each end times of incubation and not shown in the graphic. The positive control is represented as “+” on the graphic. The controls of the bacterial culture media (LB) are represented on the graphic as “LB 25%” and “LB 7.5%”. The resulting data was statistically analysed by a One-way ANOVA with Tukey test where P value was set for: P <0.05. Significant values comparing to the negative control were represented in the graphic as, * for P <0.05, ** for P <0.01 and *** for P <0.001. ... 102
Figure A 5 - Cytotoxicity of the Pseudomonas aeruginosa HB15 strain culture supernatant on A549 cells. The graphic displays the results of the MTT assay performed on A549 cells submitted to a range
of total protein concentrations of the culture supernatants of the Pseudomonas aeruginosa HB15 strain, grown in two different time setups, represented in the graphic as t1 and t2, respectively 24 hours of bacterial culture
growth and 48 hours of bacterial culture growth, in cell viability percentage represented by bars with the respective standard deviation represented by vertical lines for a number of replicas n=2. The bar legend represents the end times of incubation (24h, 48h and 72h) with the supernatants. The controls are presented in the graphic represented as “CONTROL”. The negative control has the constant value of 100% of viability for each end times of incubation and not shown in the graphic. The positive control is represented as “+” on the graphic. The controls of the bacterial culture media (LB) are represented on the graphic as “LB 25%” and “LB 7.5%”. The resulting data was statistically analysed by a One-way ANOVA with Tukey test where P value was set for: P <0.05. Significant values comparing to the negative control were represented in the graphic as, * for P <0.05, ** for P <0.01 and *** for P <0.001. ... 103
Figure A 6 - Cytotoxicity of the Pseudomonas aeruginosa HB13 strain culture supernatant on A549 cells. The graphic displays the results of the MTT assay performed on A549 cells submitted to a range
of total protein concentrations of the culture supernatants of the Pseudomonas aeruginosa HB13 strain, grown in two different time setups, represented in the graphic as t1 and t2, respectively 24 hours of bacterial culture
growth and 48 hours of bacterial culture growth, in cell viability percentage represented by bars with the respective standard deviation represented by vertical lines for a number of replicas n=2. The bar legend represents the end times of incubation (24h, 48h and 72h) with the supernatants. The controls are presented in the graphic represented as “CONTROL”. The negative control has the constant value of 100% of viability for each end times of incubation and not shown in the graphic. The positive control is represented as “+” on the graphic. The controls of the bacterial culture media (LB) are represented on the graphic as “LB 25%” and “LB 7.5%”. The resulting data was statistically analysed by a One-way ANOVA with Tukey test where P value was set for: P <0.05. Significant values comparing to the negative control were represented in the graphic as, * for P <0.05, ** for P <0.01 and *** for P <0.001. ... 104
Figure A 7 - Cytotoxicity of the Pseudomonas aeruginosa PAO1 strain culture supernatant on A549 cells. The graphic displays the results of the MTT assay performed on A549 cells submitted to a range
of total protein concentrations of the culture supernatants of the Pseudomonas aeruginosa PAO1 strain, grown in two different time setups, represented in the graphic as t1 and t2, respectively 24 hours of bacterial culture
growth and 48 hours of bacterial culture growth, in cell viability percentage represented by bars with the respective standard deviation represented by vertical lines for a number of replicas n=2. The bar legend represents the end times of incubation (24h, 48h and 72h) with the supernatants. The controls are presented in the graphic represented as “CONTROL”. The negative control has the constant value of 100% of viability for each end times of incubation and not shown in the graphic. The positive control is represented as “+” on the graphic. The controls of the bacterial culture media (LB) are represented on the graphic as “LB 25%” and “LB 7.5%”. The resulting data was statistically analysed by a One-way ANOVA with Tukey test where P value was set for: P <0.05. Significant values comparing to the negative control were represented in the graphic as, * for P <0.05, ** for P <0.01 and *** for P <0.001. ... 105
Figure A 8 - L929 cell line culture growth through time. Contrast phase microscope shot of L929 cell
culture grown in 96 well plate at 24h, 48h and 72h. The image show abundant distinguishable fibroblasts with spindle and stellate shape and some round shape fibroblast. The scale bar is set for 200 µm. ... 106
Figure A 9 – A549 cell line culture growth through time. Contrast phase microscope shot of A549 cell
culture grown in 96 well plate at 24h, 48h and 72h. The image show abundant distinguishable fibroblasts with spindle and stellate shape and some round shape fibroblast. The scale bar is set for 200 µm. ... 106
Figure A 10 -- Oxidative stress induced by Pseudomonas aeruginosa strains culture supernatant in A549 cells. The graphic displays the results of the DCF assay performed on A549 cells submitted 3.42
in fluorescence intensity (absolute units) obtained from fluorimetry using an emission wavelength of 538nm and excitation wavelength of 485nm, with the respective standard deviation represented by vertical lines for a number of replicas n=2. The bar legend represents the end times of incubation (white bar = 1h and grey bar = 4h) with the supernatants. The controls are presented in the graphic represented as “CONTROL”. The negative control represents the fluorescence intensity from the oxidative stress of the cells growing with only DMEM medium. The H2O2- control represent represents the fluorescence intensity from the oxidative stress of the cells
growing with 2mM H2O2. The resulting data was statistically analysed by a One-way ANOVA with Tukey test where
List of Tables
Table 1 - Major resistance mechanisms to antipseudomonal antibiotics. Adapted from Hancock
(2000) [64]. ... 20
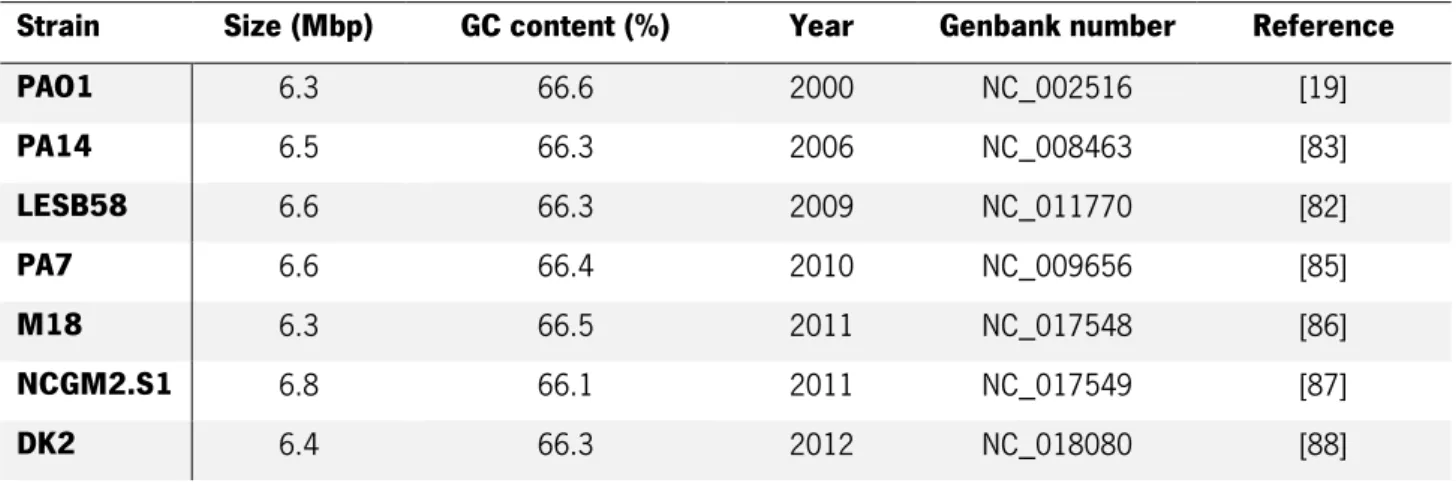
Table 2 - Pseudomonas aeruginosa fully sequenced genomes. ... 23 Table 3 – Comparison summary of general features between the two clinical isolates HB13 and HB15. ... 26 Table 4 - Comparison between different animal host model features for studying infection mechanisms. ... 31 Table 5 - List of bacteria strains used in this thesis work. ... 41 Table 6 - Generic properties of the animal cell lines used in this work thesis. ... 42 Table 7 - L929 and A549 cell culture medium formulation. ... 42 Table 8 – Table of supernatant culture protein concentration gradient. ... 44 Table 9 – Optical densities of the culture growth and total protein determinations of the culture supernatants from the Pseudomonas aeruginosa strains. The table shows the optical densities (OD)
of 24h and 48h bacterial culture growth from P. aeruginosa strains, and the subsequent protein concentration from its culture supernatants. ... 52
1.1. Bacterial Pathogenesis: an actual and worldwide serious concern
One of the main afflictions nowadays regarding worldwide public health is the pathogenesis associated to the onset of a widespread infectious bacteria. Bacteria causing infectious diseases are one of the major leads of worldwide mortality [1]. The World Health Organization (WHO) published statistic data from the leading causes of death in the world at the year 2012, where lower respiratory tract infections, majorly caused by pathogenic bacteria, was responsible for more than 3 million deaths worldwide, which represents one of the main global health threats (Figure 1). Moreover, bacteria pathogenesis are implicated in other main leading causes of death, such as diarrhoeal diseases [2]. Another study from WHO stated that infectious diseases are the main cause for worldwide deaths of children and young adults. In developing countries, infectious diseases were responsible for 45% of all deaths and 63% of all deaths in early infants [3]. These statistic facts enlighten the affect that pathogenic bacteria has in global health and why it is an established field of study among researchers and regarded under careful surveillance of governments and non-governmental organizations.
Figure 1 - Top leading causes of death in the world 2012. In the bar graphic, it is represent the main leading causes of death
worldwide, in the year 2012. The first cause is ischaemic heart disease (7.4 million deaths), second it is stroke also known as cerebrovascular accident (6.7 million deaths), third it is chronic obstructive pulmonary disease (3.1 million deaths), fourth it is lower respiratory infectious (3.1 million deaths), fifth it is trachea, bronchus, lungs cancer (1.6 million deaths), sixth it is HIV/AIDS (1.5 million deaths), seventh it is diarrhoeal diseases (1.5 million deaths), eighth it is diabetes mellitus (1.5 million deaths), ninth it is road injury (1.3 million deaths) and tenth it is hypertensive heart disease (1.1 million deaths). Adapted from World Health Organization, Fact Sheet nº 310 (2014) [2].
The impact of bacterial pathogenesis, not only lies in the occurrence of new infectious diseases, but also in the re-emergence of lethal infectious diseases and in the increasing prevalence of antibiotic resistant bacteria strains [1]. 1.1 1.3 1.5 1.5 1.5 1.6 3.1 3.1 6.7 7.4 0 1 2 3 4 5 6 7 8
Hypertensive heart disease Road injury HIV/AIDS Diarrhoeal diseases Diabetes mellitus Trachea, bronchus, lung cancer COPD Lower respiratory infections Stroke Ischaemic heart disease
Millions
T H E 10 L E A D I N G C AU S E S O F D E AT H I N T H E WO R L D 2 012
The emergence of antibiotic resistant bacteria strains has been established as a main concern in general bacterial infections and as an actual and predominant threat to global health. These pathogens are identified as multidrug-resistant (MDR) bacteria, also informally known as “superbugs”. These microorganisms are able to survive to a generality of antibiotics, at least non-susceptible to 1 or more drugs in 3 or more classes of antibiotics, precluding treatment of infectious diseases that culminate in high numbers of morbidity and mortality, which make them a serious public health threat, concerning several governments and organizations [4], [5]. The world health organization (WHO) has recognized the potential of the impact of these bacteria in public health, in its first global report release on antibiotic resistance, shouting that antibiotic resistance problem is no longer an issue of the future because it is taking place at the moment all over the world. The WHO assistant director-general for health security, Dr. Keiji Fukuda, stated that if there isn’t a synchronized and hurried response to the MDR pathogens progress, the world will enter in a “post-antibiotic era” where common illnesses will be fatal again. The relevance of this problem of public health has led most of the global microbial research to an extensive study of these organisms [6].
The emergence of prevalent MDR bacteria has led to outbreaks, generally common in close environment, such as hospitals and residual care facilities. In hospitals, the emergence of MDR bacteria is a regular occurrence and take the major role concerning the outbreak threat. The disseminated administration of antibiotic is a propeller for resistance acquirement and the plentiful vehicles of bacteria dissemination are ideal for antibiotic-resistant bacteria to thrive in these environments [7]. Nosocomial infections are infections acquired by patients under medical care, also known as healthcare/hospital associated/acquired infections (HAI). These kind of infections caused by MDR pathogens turn out to be a major concern in the hospital environment given its high prevalence and the increasing rates of morbidity and mortality. Currently, resistant bacteria such as methicillin-resistant Staphylococcus aureus (MRSA), resistant Enterococci (VRE), vancomycin-intermediate Staphylococcus aureus (VISA), multidrug-resistant Acinetobacter baumannii (MRBA) and extended spectrum beta-lactamase (ESBL) bacteria, as also multidrug-resistant Gram-negative bacilli like Pseudomonas aeruginosa, became common and regular terms of the hospital environment vocabulary. The prevalence of these pathogens causing nosocomial infections have become a serious concern. The resistant form of S. aureus (MRSA) has had an increasing incidence in the number of hospitalizations in Europe and the United States (US). The rates of incidence in the United States of MRSA has already exceed 50% and in some Asian countries the rate of incidence came close to 90% [8]. Plus, the WHO shouted that people infected with the resistant form of S. aureus (MRSA) are estimated to be 64% more susceptible to decease than people infected with the non-resistant form [6].
The vancomycin-resistant Enterococci (VRE) is one of the currently concerning antibiotic resistant pathogen. Data from Centers for Disease Control and Prevention (CDC) in the year of 2004 show that in US the VRE caused about 1/3 of the infections in hospital intensive care units [4].
The ESBL infections incidence in hospital environment has reached concerning numbers. In intensive care units, in the US, it is estimated a rate of 20% of ESBL Klebsiella pneumoniae infections and a rate of 31% of Enterobacter spp infections that now involve resistance to a third-generation cephalosporins [9].
One of the most studied MDR bacteria with concerning numbers is the Pseudomonas aeruginosa. This bacteria is responsible for 10% of all nosocomial infections. Infections by P. aeruginosa take amplified proportions because of its opportunistic characteristic infecting impaired and immunocompromised patients raising the mortality rates. Patients with cystic fibrosis are frequently infected with P. aeruginosa, in hospital environment. Treatment of these patients was for the first time verified that the constant use of various antibiotics led to a sequential emergence of resistance in these bacteria. Also, MDR P. aeruginosa is high transmissible among cystic fibrosis patients sometimes leading to outbreaks in clinic context [10].
The CDC stated that MDR P. aeruginosa infections represents a high risk of mortality for patients in critical care. In US, it is estimated to be 51,000 P. aeruginosa infections in healthcare centres each year, in which more than 6,000 of these infections were caused by multi-resistant strains, and culminating in approximately 400 death per year [4].
In Europe, the European Centre for Disease Prevention and Control (ECDC) published in 2013 a survey that estimates that 80,000 patients in European hospitals has a nosocomial infection (1/18 of the all hospitalized patients), where the fourth most common microorganisms causing these infections was P. aeruginosa with 8,9% of occurrence [11]. In other surveillance report of ECDC, in the year before, the European countries displayed worrying reported numbers of MDR P. aeruginosa isolates. In Portugal, 18.1% of the P. aeruginosa isolates showed resistance to at least 3 classes of antibiotics, which is fairly concerning (Figure 2) [12].
Figure 2 - Percentage (%) of MDR Pseudomonas aeruginosa isolates by country in Europe, in 2012. Adapted from
Furthermore data from National Nosocomial Infections Surveillance system reported that infections by P. aeruginosa was the second most common cause of pneumonia (18.1%), the third most common cause of urinary tract infections (16.3%) and the eighth most frequently isolated pathogen from the bloodstream (3,4%) [13].
As the antibiotic resistance in P. aeruginosa is on the increase and given their opportunistic and resilient characteristics this bacteria became one of the most concerning issues in pathogenesis at the present time and turn the attention of many researchers into getting more knowledge and understanding of this pathogen [10].
1.2.
Pseudomonas aeruginosa
, the bacterium and the pathogen
The Pseudomonas aeruginosa species was described for the first time in 1872 by Schroeter. Years later, in 1882, Gessard isolated in pure culture these bacteria from the surface of wound exacerbations in a form of a “blue-green pus”. Afterwards, this bacterium species was continuously studied [14], [15].
The Pseudomonas aeruginosa is a bacillus shaped gram-negative bacterium with an aerobic metabolism, having mostly only one flagellum (Figure 3). These bacteria have a remarkable and versatile metabolism which allows it to survive and proliferate in numerous environments, from soil to the human organism [16]–[18]. This biological success of Pseudomonas aeruginosa has taken advantage from its huge genomic and metabolic potential. The first sequenced Pseudomonas aeruginosa strain, PAO1, revealed 6.3 million base pairs, including 5,570 predicted open reading frames (ORF), which contains a large fraction of transcriptional regulators or two-component regulatory systems (about 10%), that engender a facilitated adaptive physiological response [19].
Figure 3 – Scanning electron microscopy images of Pseudomonas aeruginosa bacteria. Image of adherent isolate of
Pseudomonas aeruginosa forming clumps of cells. White bar indicates the image scale (1 µm). Adapted from Deligianni (2010) [20].
Metabolically, this bacterium can utilize a variety of different carbon sources to survive. Despite of its characterized aerobic metabolism, Pseudomonas aeruginosa can respire under anaerobic conditions using nitrogen as an alternative carbon source. It can also subsist with minimal nutrient requirement and can keep growing through temperatures up to 42˚C [21].
This bacterium belongs to the Proteobacteria phylum the large bacteria phylum that includes a large variety of known pathogens. In this group, Pseudomonas aeruginosa appears as a ubiquitous and opportunistic pathogen that infects several organisms including the human organism. In the era of antimicrobial research, P. aeruginosa turns to be one of the main agents of nosocomial infections causing morbidity and mortality in the
hospital infected patients [22]. The way of infecting of this bacterium is the great example of an opportunistic agent action rarely infecting healthy patients, waiting for the moment when the host organism becomes feeble to attack [23]. This is observable in several clinical cases like pneumonia, urinary tract infections, surgical wound infections, bloodstream infections. Imunocompromised patients, like in cases of bone marrow transplants, neutropenic cancer, burns and AIDS, are also susceptible to this pathogen infection action. In patients suffering from cystic fibrosis, P. aeruginosa represents the most common pathogen that leads to the progression of this disease and death [24].
Pseudomonas infections can be classified into chronic and acute infections. In chronic infections the pathogen lives inside the host during long periods of time. On the other hand, the acute infections like pneumonia and urinary tract infections are categorized by a quick bacterial progression and growth, leading in some cases to septicaemias and to host death [22].
The versatility of the P. aeruginosa as an opportunistic and resistant pathogen supports the interest of scientific research about this bacteria potentialities and their large field of applications ranging from their associated pathogenicity and clinical concern to biotechnological and biomedical applications. Within this range, the most prominent point of focus in P. aeruginosa research interests is its infectiousness [25].
1.2.1. Pathogenicity
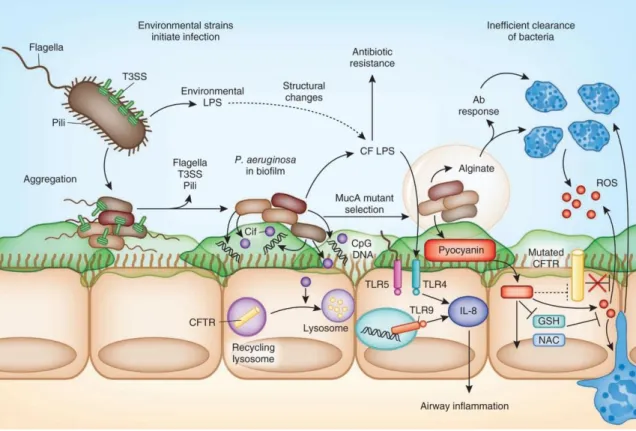
P. aeruginosa is an opportunistic pathogen that leads to much discussion and concern as it became one of the most dangerous and recurrent agent of infection in hospital environments [22]. Its status as a major opportunistic human pathogen is due to its antibiotic and disinfectant resistance that eradicates other environmental bacteria [19]. The immune condition of the host and the given environment influence the attack mechanism of Pseudomonas aeruginosa which can behave as quiescent colonizer, a highly virulent invader during acute infection or cause of chronic infection (Figure 4) [25]. In some human cases have been described the colonization in chronic obstructive pulmonary disease by P. aeruginosa, the abrupt and acute ventilator-associated pneumonia in respiratory tract of patients and also chronic infections in cystic fibrosis patients that lead to a progressive and deteriorating lung function [26]. Its infectivity potential comes in part from a large sort of virulence factors derived from P. aeruginosa versatile and flexible genome, where 10% of its genes are organized in “pathogenic genomic islands” [21].
This fact triggers a combined effort between extensive molecular, biologic, clinical and therapeutic research to better understand the pathogenicity potential of P. aeruginosa [22].
There is a large set of pathogenic features underlying the overall infectious capacity of P. aeruginosa. The combination of the several pathogenic determinants of the P. aeruginosa is assumed to be more relevant to the infectious success than the effect of one given infectious element, and the mechanisms of the combined action of the different pathogenic features is very relevant to research [21].
Figure 4 - Model of Pseudomonas aeruginosa pathogenicity in an immunocompromised host's infection. The figure
represents the pathogenic features of P. aeruginosa following a context of infection in a cystic fibrosis patient airways. Pathogenic
features such as arranged colonization, cell-associated virulence factors, secreted virulence factors, production of biofilms and antibiotic resistance are illustrated in the figure enhancing the infection development in the debilitated host. Adapted from Cohen (2012) [27].
1.2.1.1. Virulence factors
One of the most infectious characteristics of P. aeruginosa is its associated virulence factors. Factors such bacterial surface components and lipopolysaccharide (LPS), as well as secreted toxins and enzymes, enhance the impact of P. aeruginosa in infections [26].
These factors can be categorized into secreted virulence factors or cell-associated virulence factors [24]. 1.2.1.1.1. Cell-associated virulence factors
The several cell-associated virulence factors of P. aeruginosa are essential for the bacterial colonization process. The components of the cell structure of P. aeruginosa that have virulence potential include motility prompters such as pili and flagella, delivery systems that carry effector proteins into the host cells and LPS which has capacity to block the host immune response and also contribute to the maintenance of persistent infections [28], [29].
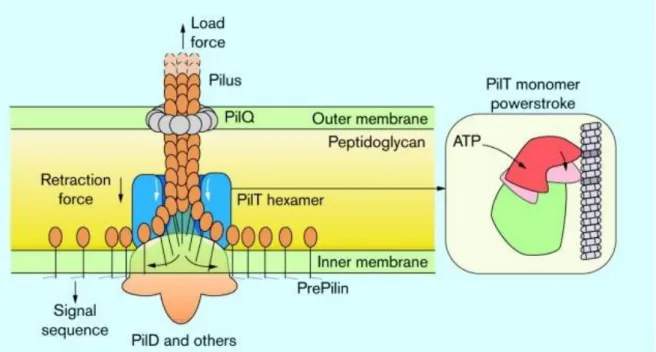
Type IV pili (Tfp) are polarity localized cell appendages constituted by pili polymers having the capacity of reversible assemblage and disassembling, providing to P. aeruginosa movement across solid surfaces, process called twitching motility (Figure 5). This feature confers P. aeruginosa the ability to move or glide through nutritional and environment signals and enables biofilm formation as well fast colonization on surfaces [30]. Tfp
can act as a phage receptor playing roles in early biofilm formation and adhesion to mammalian cells. In many studies was found glycosphingolipids as host receptors for Tfp, in bacteria binding to the apical surface of host polarized cells, though the binding mechanism is not yet totally clear [31]. The connexion of P. aeruginosa with host cells seems to modulate the Tfp expression, when the bacteria binds to the host cell the expression of pili proteins is instantly annulled [29].
Figure 5 - Type IV pilli. Illustrate representation of the type IV pilus mechanism. In the inner membrane the pilin monomer is
embedded with its hydrophilic head placed in the periplasm. The pillin signal sequence is cleaved by a pre-pilin peptidase (PilD). The pilus is extended aided by supplementary assembly proteins. After extension is done, the retraction starts by action of PilT. Adapted from Kaiser (2000) [32].
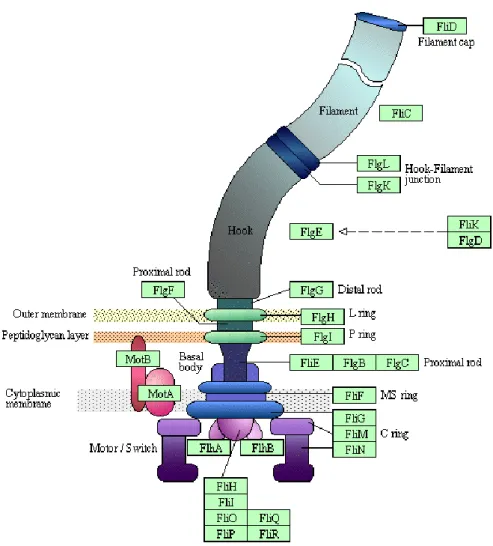
The bacterial flagellum is a polymer composed of flagellin, often presented in P. aeruginosa as a single polar unit [31]. It is a product of the fliC gene, though other genes products are necessary to the flagellar self-construct [33]. Structurally is an organelle consisting in a filament with a connecting hook, bond to the cell surface by a basal body embedded in it (Figure 6) [24], [30]. P. aeruginosa flagella are essential for cell swimming and swarming motility, adhesion to cells and biofilm formation. Also the flagella constituent, monomeric flagelin, is detected by the innate immune system, either by recognition of individual subunits by intracellular cytosolic sensors or by ligation to Toll-like receptor 5 (TLR5) at the cell surface [31].
There is still incomplete understanding about the mechanistic and structural details of the interaction of flagella with the host epithelium. The flagellar cap protein (FliD) of the P. aeruginosa strain O1 (PAO1), but not other strains, demonstrated to be involved in bacterial adherence to mucin on the respiratory tract, by binding to LewisX oligosaccharides and glycolipids receptors [24], [31].
LPS are key cell-associated factors in virulence and both innate and acquired host responses to infection. In outer-membrane of P. aeruginosa LPS is a main component composed by Lipid A, a hydrophobic domain, and a hydrophilic tail of core polysaccharides and O-specific polysaccharide coming out from the cell surface [24], [34].
In summary, these cell-associated virulence factors aid P. aeruginosa in colonization of host organisms, helping the bacteria to adhere and invade breaking the host immune responses and blocking the antibiotic’s action [21].
Figure 6 - Schematic representation of Pseudomonas aeruginosa flagellum. Structure of the P. aeruginosa flagellum embedded in the cell wall and membrane and its components. Adapted from EMBL-EBI BioModels Database (2012) [35].
In terms of pathogenicity conferred by virulence factors, there are other P. aeruginosa features that have special relevance in the mechanisms of infection which are related with the bacterial population activity and interactions.
1.2.1.1.2. Secreted virulence factors
Several extracellular factors are secreted by P. aeruginosa after colonization with the potential to cause extensive tissue damage, bloodstream invasion and dissemination. The type of infection may vary with the given factor contribution, associated to systems involving cell-to-cell signalling [21].
Proteases among other virulence factors play a major role in acute infection. There are four types of proteases currently known to be secreted: protease IV, alkaline protease, LasA elastase and LasB elastase
(staphylolysin). These secreted proteases improve the capacity of the P. aeruginosa to invade cellular tissues and block mechanisms of defence [21], [36].
The destruction of elastin is a major virulence feature of the P. aeruginosa in acute infections. This protein is one of the main components of the cell tissues of the lungs responsible for the organ expansion and contraction. This protein is also an essential component responsible for blood vessels’ resilience [21].
The two proteases LasA and LasB give a defined elastolytic activity when acting together. This lytic action is acknowledged to destroy elastin-containing human lung tissue and cause pulmonary haemorrhages. LasA elastase is a zinc metalloendopeptidase, also known as staphylolysin. This elastase is one of the most abundant secreted virulence factors of P. aeruginosa. Its action consists in cleaving the elastin, turning it susceptible to degradation by other proteases, like LasB and neutrophil elastase, and alkaline protease. LasB elastase is a zinc metalloprotease acts in many other proteins besides elastin. This enzyme is highly effective, with about ten times of the alkaline protease lytic activity and an activity against casein four times that of trypsin [37]. These two proteases, LasA and LasB, were found in the mucus of the lungs of cystic fibrosis (CF) patients. The role of one of these elastases, LasB, in tissue destruction of cystic fibrosis remains less understood. The wide range of action of this enzyme permits not only to destroy tissue structures but also disturbing the infected organism defense mechanisms. In animal study models, P. aeruginosa mutants of LasB elastase are less pathogenic than the parental strains, sustaining the LasB crucial function as a virulence factor [25], [38].
The alkaline protease (AprA) also called aeruginolysin belongs to the subfamily B of the M10 peptidase family, included in the metzincin superfamily. This enzyme is a zinc-dependent metallo-endopeptidase secreted by P. aeruginosa [38]. One of the AprA targets is laminin which is an essencial component of the basal lamina of cellular tissues. AprA and LasB have the capacity of inactivate human γ-interferon and human necrosis factor-α responsible for effective host immune response [38].
Also, AprA and LasB can inhibit neutrophils’ function affecting their chemotaxis providing bacteria with more chances to escape by affecting the phagocytic activity of leucocytes, through cleavage of cell receptors. Natural killer (NK) cells are also affected by inhibition of the effector/target cell conjugate formation. Furthermore the alkaline protease can inactivate different human protease inhibitors and degrade cytokines such as interleukin-6 [38].
The protease IV, also called lysyl endopeptidase or iron-regulated protein PrpL, is a serine protease secreted by P. aeruginosa, belonging to the chymotrypsin family S1. This protease has the capacity of cleavage of bovine fibrinogen, a large biopolymer and part of the blood coagulation system. Disruption on the fibrinogen integrity leads to haemorrhages in the host. Plasminogen, immunoglobulin G (IgG), complement components 3 and C1q are also degradation targets for protease IV that interferes with the host immune system [38].
One of the known secreted virulence factors is Exotoxin A (ETA). This toxin has the ability to blockade protein synthesis and lead to cell death, via ADP-ribosylation and inhibition of the elongation factor 2 (EF2). Local tissue damage is one of the consequences of ETA action, from renal-necrosis and liver cell-necrosis to lung haemorrhage. In CF patients, this exotoxin has its main role in bacterial invasion and immunosuppression [39].
P. aeruginosa has a delivery mechanism for virulence factors, the type III secretion system (TTSS or T3SS) that transports exoenzimes to the host cells (Figure 7). These are four enzymes: exoenzyme S (ExoS), exoenzyme T (ExoT), exoenzyme U (ExoU) and exoenzyme Y (ExoY) which they are expressed inequality in different isolates [40]. In a study conducted by Feltman et al., it was concluded that all isolates contained ExoT whereas the presence of other exoenzymes seemed to be reciprocally exclusive [41].
Figure 7 - Model of type III secretion system (TTSS) function. The figure represents the TTSS divided into 5 components: the
regulatory proteins, the effector proteins, the chaperones, the needle complex and the translocation apparatus. The aseemble of this 5 components makes the TTSS function and allows the injection of effector proteins into the host cells. Adapted from Hauser (2009) [42]
The virulence mechanisms of these exoenzymes are distinct. While the ExoS and ExoT acts in the damage of the cytoskeleton of the host cells by disrupting the actin assemblage, leading to programmed cell death, the ExoU make host sensible to secondary infections. ExoY raises the levels of intracellular cyclic AMP (cAMP) which in turn damages the actin cytoskeleton, indirectly [24].
The bacterial surfactants named rhamnolipids are virulence factors frequently secreted by P. aeruginosa. Their action is related to the development and maintenance of biofilms and in ex-vivo studies showed to interfere with cell-to-cell communication, by modulating and disrupting tight junctions of respiratory epithelial cells [43].