Copyright: This is an open-access article distributed under the terms of the Creative Commons Attribution License®, which permits unrestricted use, distribution, and reproduction in any medium, provided that the original author and source are credited.
Introduction
Sedentary behavior refers to remaining in a sitting or reclining position in a state of wakefulness spending a minimum of energy (≤ 1.5 units of equivalent
ener-gy [Mets])1. The most common sedentary behavior is
screen time, that is, time spent watching television, playing videogames and using a computer, tablet or smartphone. Compared to other sedentary behaviors,
Prevalence of excessive screen time and correlates
factors in Brazilian schoolchildren
Prevalência de tempo de tela excessivo e fatores correlatos em escolares brasileiros
AUTHOR’SDartagnan Pinto Guedes1
Robson Antônio Desiderá1
Hélcio Rossi Gonçalves2
1 University of Northern Parana, Londrina, Parana, Brazil.
2 State University of Londrina, Parana, Brazil. CORRESPONDING
Dartagnan Pinto Guedes [email protected]
Rua Ildefonso Werner 177, Condomínio Royal Golf, Londrina, Paraná, Brazil. CEP: 86055-545.
DOI
10.12820/rbafs.23e0003
ABSTRACT
The objective of this study was to identify excessive screen time, through the use of TV and other screen-based devices, including computers, videogames, tablets and smartphones, and analyze asso-ciated demographic, behavioral and anthropometric correlates. This is a cross-sectional school-based epidemiological study of approximately 17,000 schoolchildren aged 4-20 years who participated in the 2014 Healthy Paraná Project. Anthropometric measurements were collected by applying a questionnaire with structured questions. Excessive screen time was defined as the combined use of TV and other screen-based devices for > 2 hours/day. Data were analyzed using bivariate anal-ysis and hierarchical multiple regression. The overall prevalence of excessive screen time was 70.4% [68.1–72.9]. Multivariate analysis showed a significant association between excessive screen time and age (OR = 1.92; 95%CI: 1.60–2.33), economic status (OR = 2.48; 95%CI: 1.99–3.17), mother’s schooling (OR = 1.98; 95%CI: 1.57–2.68), living area (OR = 1.26; 95%CI: 1.04–1.56) and urbani-zation (OR = 2.94; 95%CI: 2.41–3.75). Among the behavioral correlates, less physical activity (OR = 1.42; 95%CI: 1.25–1.85), low fruit/vegetable intake (OR = 2.89; 95%CI: 2.25–3.70), consuming sweetened products/soft drinks (OR = 2.07; 95%CI: 1.63–2.70) and fewer hours of sleep (OR = 2.01; 95%CI: 1.60–2.62) were independently associated with excessive screen time. Likewise, excess body weight (OR = 1.81; 95%CI: 1.35–2.51) and abdominal fat (OR = 2.01; 95%CI: 1.62–2.73) were significantly associated with the outcome. In conclusion, the findings of the study suggest that policies and interventions targeting health education programs in school and family settings should include elements that focus on reducing excessive screen time.
Keywords: Child; Adolescent; School health; Lifestyle; Sedentary behavior. RESUMO
O objetivo do estudo foi identificar a exposição ao tempo de tela excessivo, mediante o uso de TV e de outros dispositivos de tela, incluindo computador, videogame, tablet e smartphone, e analisar correlatos demográ-ficos, comportamentais e antropométricos associados. Trata-se de estudo epidemiológico transversal de base escolar, com aproximadamente 17 mil escolares de 4 a 20 anos que participaram do Projeto Paraná Saudável em 2014. Foram realizadas medidas antropométricas e aplicado questionário com questões estruturadas para levantar as informações. Tempo de tela excessivo foi definido pelo uso combinado de TV e outros dispositi-vos de tela por tempo > 2 horas/dia. Os dados foram tratados estatisticamente mediante análise bivariada e regressão múltipla hierarquizada. Prevalência global de tempo de tela excessivo foi de 70,4% (IC95%: 68,1–72,9). Análise multivariada apontou associação significativa entre tempo de tela excessivo e idade (OR = 1,92; IC95%: 1,60–2,33), classe econômica (OR = 2,48; IC95%: 1,99–3,17), escolaridade materna (OR = 1,98; 95%CI: 1,57–2,68), área de moradia (OR = 1.26; IC95%: 1.04–1.56) e urbanização (OR = 2,94; IC95%: 2,41–3,75). Entre fatores comportamentais, menor prática de atividade física (OR = 1,42; IC95%: 1,25–1,85), baixo consumo de frutas/hortaliças (OR = 2,89; IC95%: 2,25–3,70), elevado consumo de produtos açucarados/refrigerantes (OR = 2,07; IC95%: 1,63–2,70) e menos horas de sono (OR = 2,01; IC95%: 1,60–2,62) se mostraram independentemente associados ao tempo de tela excessivo. Da mesma for-ma, excesso de peso corporal (OR = 1,81; IC95%: 1,35–2,51) e gordura abdominal (OR = 2,01; IC95%: 1,62–2,73) apresentaram associações significativas com o desfecho. Concluindo, achados do estudo sugerem que políticas e intervenções destinadas aos programas de educação em saúde nos contextos escolar e familiar devam incluir componentes que se concentram na redução do tempo de tela excessivo.
such as sitting in a classroom, reading, listening to mu-sic, talking with friends, etc., screen time tends to exhi-bit greater variation among young people and more effective voluntary control2.
Recent studies have shown that, regardless of physical activity level, greater screen time at young ages is closely related to a number of harmful effects on health, including overweight and obesity, changes in cardiometabolic markers, metabolic syndrome and lower mineral content, with important lifelong reper-cussions3. Moreover, excessive screen time favors the
adoption of a poor diet4, psychosocial problems5, sleep
disorders6 and diminished school performance2.
Due to the increased risk in various dimensions of physical and mental health, the guidelines proposed by public health entities worldwide recommend that school-age children and adolescents accumulate no more than 2 hours/day of screen time7. However,
epi-demiological surveys conducted in different countries have shown that only a small proportion of these in-dividuals comply with screen time guidelines2,4,8-10 and
that average screen time can reach 6 hours/day8. In
Bra-zil, a systematic review investigated 24 surveys carried out in young people, revealing a prevalence of excess TV viewing, varying between 11.3% and 79.5%11.
Fur-thermore, National School Health Research (PeNSE) data collected from 9th grade students in public and
private schools in all the state capitals and the Federal District found that 61.3% of girls and 58.1% of boys watch television for more than 2 hours a day12. It is
also important to note that the trend towards excessive screen time in adolescents persists in adulthood3.
Given these findings, it is essential to attempt to minimize the time young people spend in front of screens. An earlier systematic review collected data on interventions performed in children and adolescents, but with slightly favorable results13. In this respect,
identifying the correlates associated with screen time may more effectively guide future interventions aimed at increasing the chances of success. Studies involv-ing young Brazilians have sought to identify screen time correlates14,15. However, they exhibited important
limitations, such as small sample sizes, restricted geo-graphic areas, little sociocultural diversity, and narrow age range, in addition to considering only TV viewing time, disregarding all other screen display devices
As such, the aim of the present study was to iden-tify excessive screen time, including TV viewing and other screen-based devices (computers, videogames,
tablets and smartphones), in a representative sample of school-age children and adolescents in Paraná state, Brazil, and establish associations with demographic, behavioral and anthropometric correlates.
Methods
The data analyzed are from the Healthy Paraná Project, a cross-sectional school-based study aimed at analyzing the associations between anthropometric nutritional status, lifestyle behaviors as well as school and family setting indicators in young people aged 4 to 20 years enrolled in the public schools of Paraná state, Brazil.
In 2014, the public school population in Paraná was around 1.8 million students. The sample size was es-tablished assuming an unknown success rate (p = 50%), 95% confidence interval and 3% sampling error. How-ever, considering that sample planning involved a clus-ter, the design effect was defined as three and sample size was increased by 25% in order to compensate for possible losses, resulting in 17,438 students in the in-itial sample. However, the final sample was composed of 17,074 students (8,776 girls and 8,298 boys).
Sample composition was determined by a random draw involving a cluster of four stages: geographic mi-croregions, cities, schools, and grades, with probability proportional to size. The students selected for the sam-ple and their respective parents or guardians were in-formed about the nature and objectives of the study, in addition to ensuring their anonymity, the non-influence of school performance, and inviting them to take part in data collection. Those who refused to participate in the study or did not respond to the invitation after being contacted three times on different days and at different times were considered sampling losses. The rights of all participants were guaranteed in the informed consent form signed by the students or their legal guardians.
The intervention protocols used were approved by the Research Ethics Committee of the Universidade Norte do Paraná – Plataforma Brasil (no. 95.056/2012). The study originally proposed to collect anthropomet-ric data and apply a 50-item questionnaire divided into five sections: demographic aspects, eating habits, sleep, physical activity, and sedentary behavior.
The questionnaire was applied individually to each student, at a single session held at the school during class time. However, for kindergarten and 1st to 5th
grad-ers (age ≤ 11 years), the questionnaire was applied in the form of a face-to-face interview in the presence of their parents/guardians, who, when asked, helped the
stu-dents answer the questions. In the other grades (grades 6 to 9of elementary school and 9 to 11 of high school), students were handed out the questionnaire with in-structions and recommendations for filling it out, and no time limit was established for completing the instru-ment. The average time spent on the questionnaire was 40 minutes. Questionnaire reliability was analyzed by reapplying it to 10% of the subjects seven days later. All the items demonstrated Cohen’s kappa ≥ 0.70.
Data were collected between August/2013 and June/2014 by a team of 40 investigators, divided into eight groups distributed into the different geographic regions and cities. Anthropometric data consisted of height, body weight and waist circumference measures, in line with the methodology proposed by the World Health Organization16. Body mass index (BMI) was
calculated as the ratio between weight in kilograms and height in meters (kg/m2) and waist/height ratio (WHR)
as the waist circumference divided by height, expressed in centimeters. Based on BMI, the anthropometric nu-tritional status of the students was classified into four categories, according to the cutoff points for sex and aged suggested by the International Obesity Task Force – IOFT17: low body weight, eutrophic, overweight and
obesity. WHR values were used to analyze abdominal fat accumulation, adopting a cutoff point of 0.5018.
With respect to demographic aspects, in addition to sex and age, information was collected on ethnicity, economic class, mother’s schooling, family structure, living area and hometown population. Economic class was established based on National Association of Mar-ket Research Companies (ABEP) guidelines19. Eating
habit information was obtained using the Youth Risk Behavior Survey (YRBS), translated, adapted and val-idated for Brazil20. In this case, the students reported
the intake frequency of fruits/vegetables and sweet-ened products/soft drinks in the week prior to data collection. Intake frequency was classified as none; 1-4 days/week; ≥ 5 days/week.
Sleep duration indicators were collected consid-ering weekdays and weekends, based on a typical or usual week and four questions: on school days, (a) what time do you usually go to bed? and (b) what time do you wake up? On weekends, (a) what time do you usu-ally go to bed? and (b) what time do you wake up? With this information, sleep duration was calculated for weekdays and weekends. The weighted mean of weekday and weekend data was used to obtain sleep duration per night.
The Physical Activity Questionnaire for Older Chil-dren – PAQ-C and Physical Activity Questionnaire for Adolescents – PAQ-A, translated and validated for Brazil, were used to determine physical activity levels21.
Specific cutoff points for sex and age, based on tertile distribution, were used to characterize the scores. Thus, the least active group of students was stratified with PAQ-C or PAQ-A scores ≤ 1st tertile, the moderately
active group with scores between the 1st and 2nd tertile,
and the most active group with scores ≥ 2nd tertile.
Screen time was determined by structured questions on TV viewing and using a computer, videogame, tablet and smartphone during a typical or usual week. An-swers were divided into four categories ranging from “none” to “> 4 hours/day”. The questions considered TV viewing time separately from computer, videogame, tablet and smartphone screen time, on weekdays and weekends. The weighted mean of weekday and week-end data was used to calculate students’ screen time per day. Excessive screen time was defined as the combined use of TV and other screen devices for > 2 hours/day7.
The data were digitized in duplicate in the EpiData 3.1 program and analyses were conducted using Statis-tical Package for the Social Sciences (SPSS) 22.0 soft-ware. Screen time estimates and demographic, behav-ioral and anthropometric correlates were presented in percentages, along with their 95% confidence intervals (95% CI). To analyze the associations between excessive screen time and potential correlates, the prevalence ratio was calculated. Statistical differences between the strata under study were determined using the chi-squared test (χ2). Next, correlates that show at least marginally
sig-nificant associations (p ≤ 0.20) in bivariate analysis were included in hierarchized multiple regression procedures. In this case, the correlates were included in blocks, and demographic aspects (level one) were the first to enter the model, followed by those related to behavioral com-ponents (level two) and finally, anthropometric indica-tors (level three). All the correlates with statistical sig-nificance (p < 0.05) remained in the multivariate model.
Results
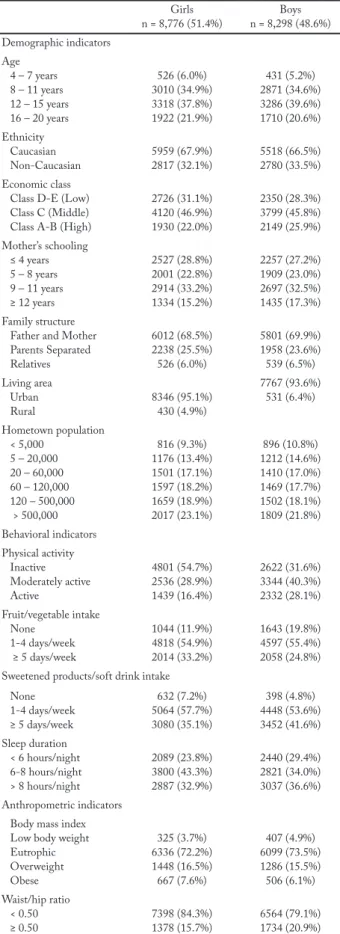
Descriptive information of the study sample is shown in table 1. Approximately half the sample consists of girls (51.4%) and the highest concentration of school-children is found in 8-to-15-year-olds (≈ 73%). De-mographic aspects were comparable in both sexes; however, differences were identified in behavioral com-ponents and anthropometric indicators.
Table 1 – Descriptive information of the sample selected for the Healthy Paraná Project, 2014.
Girls n = 8,776 (51.4%) n = 8,298 (48.6%)Boys Demographic indicators Age 4 – 7 years 8 – 11 years 12 – 15 years 16 – 20 years 526 (6.0%) 3010 (34.9%) 3318 (37.8%) 1922 (21.9%) 431 (5.2%) 2871 (34.6%) 3286 (39.6%) 1710 (20.6%) Ethnicity Caucasian Non-Caucasian 5959 (67.9%)2817 (32.1%) 5518 (66.5%)2780 (33.5%) Economic class
Class D-E (Low) Class C (Middle) Class A-B (High)
2726 (31.1%) 4120 (46.9%) 1930 (22.0%) 2350 (28.3%) 3799 (45.8%) 2149 (25.9%) Mother’s schooling ≤ 4 years 5 – 8 years 9 – 11 years ≥ 12 years 2527 (28.8%) 2001 (22.8%) 2914 (33.2%) 1334 (15.2%) 2257 (27.2%) 1909 (23.0%) 2697 (32.5%) 1435 (17.3%) Family structure
Father and Mother Parents Separated Relatives 6012 (68.5%) 2238 (25.5%) 526 (6.0%) 5801 (69.9%) 1958 (23.6%) 539 (6.5%) Living area Urban Rural 8346 (95.1%)430 (4.9%) 7767 (93.6%) 531 (6.4%) Hometown population < 5,000 5 – 20,000 20 – 60,000 60 – 120,000 120 – 500,000 > 500,000 816 (9.3%) 1176 (13.4%) 1501 (17.1%) 1597 (18.2%) 1659 (18.9%) 2017 (23.1%) 896 (10.8%) 1212 (14.6%) 1410 (17.0%) 1469 (17.7%) 1502 (18.1%) 1809 (21.8%) Behavioral indicators Physical activity Inactive Moderately active Active 4801 (54.7%) 2536 (28.9%) 1439 (16.4%) 2622 (31.6%) 3344 (40.3%) 2332 (28.1%) Fruit/vegetable intake None 1-4 days/week ≥ 5 days/week 1044 (11.9%) 4818 (54.9%) 2014 (33.2%) 1643 (19.8%) 4597 (55.4%) 2058 (24.8%) Sweetened products/soft drink intake
None 1-4 days/week ≥ 5 days/week 632 (7.2%) 5064 (57.7%) 3080 (35.1%) 398 (4.8%) 4448 (53.6%) 3452 (41.6%) Sleep duration < 6 hours/night 6-8 hours/night > 8 hours/night 2089 (23.8%) 3800 (43.3%) 2887 (32.9%) 2440 (29.4%) 2821 (34.0%) 3037 (36.6%) Anthropometric indicators
Body mass index Low body weight Eutrophic Overweight Obese 325 (3.7%) 6336 (72.2%) 1448 (16.5%) 667 (7.6%) 407 (4.9%) 6099 (73.5%) 1286 (15.5%) 506 (6.1%) Waist/hip ratio < 0.50 ≥ 0.50 7398 (84.3%)1378 (15.7%) 6564 (79.1%)1734 (20.9%)
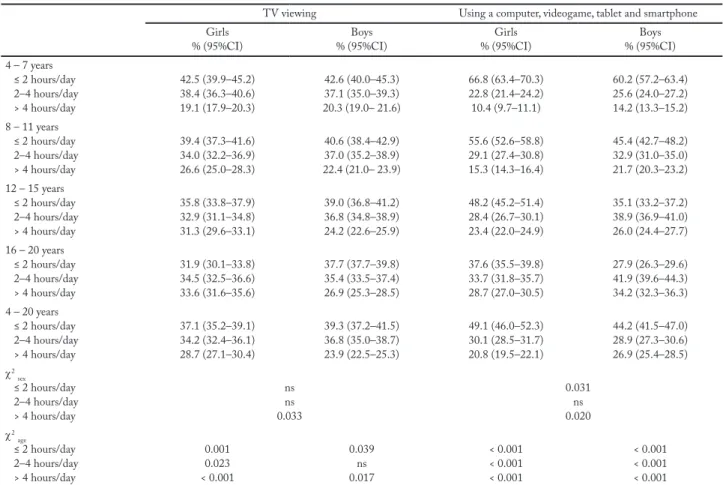
Table 2 shows TV viewing times, according to sex and age, separately from computers, videogames, tablets and smartphones. Considering the different age groups, similar percentages of girls and boys reported watching TV (37.1%; CI95%: 35.2–39.1) and 39.3% (CI95%: 37.2–41.2), respectively and using a computer, video-game, tablet or smartphone (49.1%; CI95%: 46.0–52.3 and 44.2; CI95%: 41.5–47.0, respectively) for ≤ 2 hours/ day. However, a significantly higher proportion of girls watch TV (28.7%; CI95%: 27.1–30.4) versus 23.9% (CI95%: 22.5–25.3; p = 0.033), while more boys use computers, videogames, tablets or smartphones (26.9%; CI95%: 25.4–28.5) versus 20.8% (CI95%: 19.5–22.1; p = 0.020) for > 4 hours/day. Up to 15 years of age in both sexes, more students spend > 2 hours/day watch-ing TV than use other screen-based devices. However, time spent by older students on computers, videogames, tablets or smartphones was the main contributor to ex-cessive screen time, especially among boys.
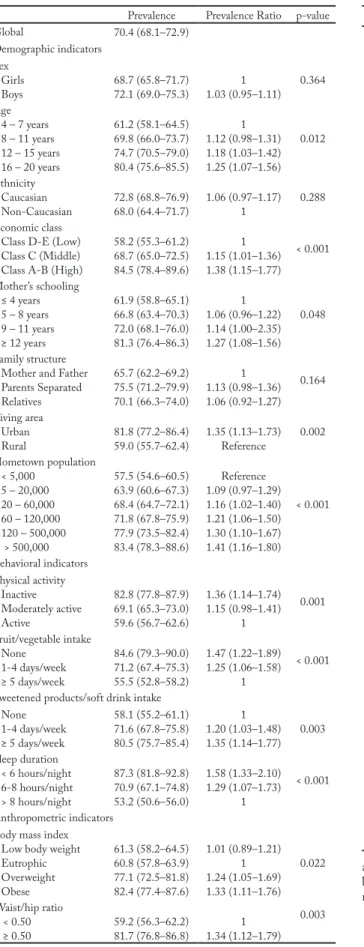
Estimated prevalence of excessive screen time, cal-culated by stratifying each demographic, behavioral and anthropometric correlate, is presented in table 3. The overall prevalence of excessive screen time was 70.4% (CI95%: 68.1–72.9). Of the potential correlates considered, bivariate analyses show that sex and eth-nicity were not statistically significant (p < 0.20).
Hierarchized multiple regression results are de-scribed in table 4. With respect to demographic cor-relates, the final model revealed significant associations between excessive screen time and age, economic class, mother’s schooling, living area and number of home-town inhabitants.Among thebehavioral components, the four correlates considered (physical activity, fruit/ vegetable intake, consuming sweetened products/soft drink and sleep duration) were associated with screen time of > 2 hours/day. Likewise, the anthropometric correlates related to indicators of nutritional status (BMI) and body fat accumulation (WHR) were sig-nificantly associated with the outcome.
Discussion
The aim of the study was to collect updated informa-tion on excessive screen time in young students in Para-ná state, Brazil, and their demographic, behavioral and anthropometric correlates. The primary findings de-monstrated that around three out of every ten students reported spending ≤ 2 hours/day watching TV and using a computer, videogame, tablet or smartphone, complying with current screen time guidelines
recom-mended by public health institutions7. In addition to
being older, belonging to a higher economic class, their mother having more schooling and living in cities with larger populations, the students who reported excessive screen time were the least physically active, consumed less healthy food, slept for fewer hours, had higher body weight and greater abdominal fat accumulation.
Comparisons between the findings of the present study and those of earlier surveys in Brazil and oth-er countries are difficult to make due to the diffoth-erent methodological designs used, non-representative sam-ples of the population under study, as well as different measurement procedures, cutoff points and screen-based devices. Investigations with wider student age ranges (from 4 to 20 years) are scarce and data clusters by age are not consensual.
However, if on one hand the proportion of students that comply with the current screen time guidelines contained in the Healthy Paraná Project is low (≈ 30%), on the other, it does not to seem different from that observed in other studies. For example, considering specifically excessive TV viewing time, school-based
population surveys conducted in Brazilian adolescents between 14 and 20 years old revealed a prevalence of 59.1% and 27.3% in the states of Pernambuco14 and
Santa Catarina15, respectively. National School Health
Survey (PeNSE) data collected from 9th graders at
public and private schools in Brazilian capitals and the Federal District showed that 40.1% of the students watched TV ≤ 2 hours/day12. The Health Behaviour in
School-Age Children report, an international study of around 200,000 adolescents aged 11, 13 and 15 years of age from 41 countries in Europe and North America, found that between 37% and 50% of these individuals watched TV ≤ 2 hours/day9 in the United States. More
recent data from the Youth Risk Behavior Survey, a bi-ennial survey of 9th to 12th graders, shows that 41.7%
of American adolescents use a computer, videogame, tablet or smartphone ≥ 3 hours/day, and 24.7% watch TV for the same amount of time22.
In addition to the methodological differences iden-tified in the studies, questions related to the socio-cultural and environmental context inherent to each Brazilian region and other countries may influence Table 2 – Screen time exposure according to sex and age of the schoolchildren from Paraná state, Brazil, 2014.
TV viewing Using a computer, videogame, tablet and smartphone Girls
% (95%CI) % (95%CI)Boys % (95%CI)Girls % (95%CI)Boys 4 – 7 years ≤ 2 hours/day 2–4 hours/day > 4 hours/day 42.5 (39.9–45.2) 38.4 (36.3–40.6) 19.1 (17.9–20.3) 42.6 (40.0–45.3) 37.1 (35.0–39.3) 20.3 (19.0– 21.6) 66.8 (63.4–70.3) 22.8 (21.4–24.2) 10.4 (9.7–11.1) 60.2 (57.2–63.4) 25.6 (24.0–27.2) 14.2 (13.3–15.2) 8 – 11 years ≤ 2 hours/day 2–4 hours/day > 4 hours/day 39.4 (37.3–41.6) 34.0 (32.2–36.9) 26.6 (25.0–28.3) 40.6 (38.4–42.9) 37.0 (35.2–38.9) 22.4 (21.0– 23.9) 55.6 (52.6–58.8) 29.1 (27.4–30.8) 15.3 (14.3–16.4) 45.4 (42.7–48.2) 32.9 (31.0–35.0) 21.7 (20.3–23.2) 12 – 15 years ≤ 2 hours/day 2–4 hours/day > 4 hours/day 35.8 (33.8–37.9) 32.9 (31.1–34.8) 31.3 (29.6–33.1) 39.0 (36.8–41.2) 36.8 (34.8–38.9) 24.2 (22.6–25.9) 48.2 (45.2–51.4) 28.4 (26.7–30.1) 23.4 (22.0–24.9) 35.1 (33.2–37.2) 38.9 (36.9–41.0) 26.0 (24.4–27.7) 16 – 20 years ≤ 2 hours/day 2–4 hours/day > 4 hours/day 31.9 (30.1–33.8) 34.5 (32.5–36.6) 33.6 (31.6–35.6) 37.7 (37.7–39.8) 35.4 (33.5–37.4) 26.9 (25.3–28.5) 37.6 (35.5–39.8) 33.7 (31.8–35.7) 28.7 (27.0–30.5) 27.9 (26.3–29.6) 41.9 (39.6–44.3) 34.2 (32.3–36.3) 4 – 20 years ≤ 2 hours/day 2–4 hours/day > 4 hours/day 37.1 (35.2–39.1) 34.2 (32.4–36.1) 28.7 (27.1–30.4) 39.3 (37.2–41.5) 36.8 (35.0–38.7) 23.9 (22.5–25.3) 49.1 (46.0–52.3) 30.1 (28.5–31.7) 20.8 (19.5–22.1) 44.2 (41.5–47.0) 28.9 (27.3–30.6) 26.9 (25.4–28.5) χ2 sex ≤ 2 hours/day 2–4 hours/day > 4 hours/day ns ns 0.033 0.031 ns 0.020 χ2 age ≤ 2 hours/day 2–4 hours/day > 4 hours/day 0.001 0.023 < 0.001 0.039 ns 0.017 < 0.001 < 0.001 < 0.001 < 0.001 < 0.001 < 0.001 ns = no significant.
Table 3 – Prevalence (95%CI) and prevalence ratio (95%CI) of excessive screen time with stratification for demographic, behavioral and anthropometric correlates of the schoolchildren from Paraná state, Brazil, 2014.
Prevalence Prevalence Ratio p-value Global 70.4 (68.1–72.9) Demographic indicators Sex Girls Boys 68.7 (65.8–71.7)72.1 (69.0–75.3) 1.03 (0.95–1.11)1 0.364 Age 4 – 7 years 8 – 11 years 12 – 15 years 16 – 20 years 61.2 (58.1–64.5) 69.8 (66.0–73.7) 74.7 (70.5–79.0) 80.4 (75.6–85.5) 1 1.12 (0.98–1.31) 1.18 (1.03–1.42) 1.25 (1.07–1.56) 0.012 Ethnicity Caucasian Non-Caucasian 72.8 (68.8–76.9)68.0 (64.4–71.7) 1.06 (0.97–1.17)1 0.288 Economic class
Class D-E (Low) Class C (Middle) Class A-B (High)
58.2 (55.3–61.2) 68.7 (65.0–72.5) 84.5 (78.4–89.6) 1 1.15 (1.01–1.36) 1.38 (1.15–1.77) < 0.001 Mother’s schooling ≤ 4 years 5 – 8 years 9 – 11 years ≥ 12 years 61.9 (58.8–65.1) 66.8 (63.4–70.3) 72.0 (68.1–76.0) 81.3 (76.4–86.3) 1 1.06 (0.96–1.22) 1.14 (1.00–2.35) 1.27 (1.08–1.56) 0.048 Family structure
Mother and Father Parents Separated Relatives 65.7 (62.2–69.2) 75.5 (71.2–79.9) 70.1 (66.3–74.0) 1 1.13 (0.98–1.36) 1.06 (0.92–1.27) 0.164 Living area Urban Rural 81.8 (77.2–86.4)59.0 (55.7–62.4) 1.35 (1.13–1.73)Reference 0.002 Hometown population < 5,000 5 – 20,000 20 – 60,000 60 – 120,000 120 – 500,000 > 500,000 57.5 (54.6–60.5) 63.9 (60.6–67.3) 68.4 (64.7–72.1) 71.8 (67.8–75.9) 77.9 (73.5–82.4) 83.4 (78.3–88.6) Reference 1.09 (0.97–1.29) 1.16 (1.02–1.40) 1.21 (1.06–1.50) 1.30 (1.10–1.67) 1.41 (1.16–1.80) < 0.001 Behavioral indicators Physical activity Inactive Moderately active Active 82.8 (77.8–87.9) 69.1 (65.3–73.0) 59.6 (56.7–62.6) 1.36 (1.14–1.74) 1.15 (0.98–1.41) 1 0.001 Fruit/vegetable intake None 1-4 days/week ≥ 5 days/week 84.6 (79.3–90.0) 71.2 (67.4–75.3) 55.5 (52.8–58.2) 1.47 (1.22–1.89) 1.25 (1.06–1.58) 1 < 0.001 Sweetened products/soft drink intake
None 1-4 days/week ≥ 5 days/week 58.1 (55.2–61.1) 71.6 (67.8–75.8) 80.5 (75.7–85.4) 1 1.20 (1.03–1.48) 1.35 (1.14–1.77) 0.003 Sleep duration < 6 hours/night 6-8 hours/night > 8 hours/night 87.3 (81.8–92.8) 70.9 (67.1–74.8) 53.2 (50.6–56.0) 1.58 (1.33–2.10) 1.29 (1.07–1.73) 1 < 0.001 Anthropometric indicators
Body mass index Low body weight Eutrophic Overweight Obese 61.3 (58.2–64.5) 60.8 (57.8–63.9) 77.1 (72.5–81.8) 82.4 (77.4–87.6) 1.01 (0.89–1.21) 1 1.24 (1.05–1.69) 1.33 (1.11–1.76) 0.022 Waist/hip ratio < 0.50 ≥ 0.50 59.2 (56.3–62.2)81.7 (76.8–86.8) 1.34 (1.12–1.79)1 0.003
Table 4 – Hierarchized multiple logistic regression for demographic (level 1), behavioral (level 2) and anthropometric (level 3) correlated of excessive screen time of schoolchildren from Paraná state, Brazil, 2014.
Correlates OR Crude (95%CI)a OR Adjusted (95%)b
Level 1 Age 4 – 7 years 8 – 11 years 12 – 15 years 16 – 20 years 1 1.31 (1.07–1.61) 1.52 (1.22–1.93) 1.98 (1.57–2.60) 1 1.27 (1.08–1.51) 1.46 (1.20–1.82) 1.92 (1.60–2.33) Economic Class
Class D-E (Low) Class C (Middle) Class B-A (High)
1 1.74 (1.37–2.24) 2.53 (1.92–3.37) 1 1.67 (1.38–2.08) 2.48 (1.99–3.17) Mother’s Schooling ≤ 4 years 5 – 8 years 9 – 11 years ≥ 12 years 1 1.22 (1.02–1.52) 1.61 (1.26–2.13) 2.05 (1.55–2.87) 1 1.18 (0.98–1.43) 1.57 (1.31–2.01) 1.98 (1.57–2.68) Living area Urban Rural 1.34 (1.10–1.68)1 1.26 (1.04–1.56)1 Hometown Population < 5,000 5 – 20,000 20 – 60,000 60 – 120,000 120 – 500,000 > 500,000 1 1.23 (1.01–1.51) 1.47 (1.17–1.98) 1.82 (1.41–2.47) 2.11 (1.59–2.96) 2.96 (2.25–3.99) 1 1.19 (0.98–1.42) 1.46 (1.22–1.85) 1.80 (1.50–2.31) 2.06 (1.65–2.77) 2.94 (2.41–3.75) Level 2 Physical activity Inactive Moderately active Active 2.13 (1.62–2.95) 1.51 (1.29–2.03) 1 1.96 (1.56–2.67) 1.42 (1.25–1.85) 1 Fruit/vegetable intake None 1-4 days/week ≥ 5 days/week 3.05 (2.30–4.11) 1.70 (1.33–2.25) 1 2.89 (2.25–3.70) 1.56 (1.26–2.02) 1 Sweetened products/soft drink intake None 1-4 days/week ≥ 5 days/week 1 1.62 (1.28–2.12) 2.23 (1.67–3.11) 1 1.42 (1.17–1.83) 2.07 (1.63–2.70) Sleep duration < 6 hours/night 6-8 hours/night > 8 hours/night 2.18 (1.65–3.03) 1.44 (1.18–1.85) 1 2.01 (1.60–2.62) 1.26 (1.07–1.60) 1 Level 3
Body mass index Low body weight Eutrophic Overweight Obese 1.09 (0.98–1.29) 1 1.88 (1.45–2.51) 2.07 (1.52–2.97) 1.01 (0.92–1.19) 1 1.69 (1.33–2.28) 1.81 (1.35–2.51) Waist/hip ratio < 0.50 ≥ 0.50 2.23 (1.69–3.11)1 2.01 (1.62–2.73)1
a Non-adjusted Odds ratio
b Odds ratio adjusted for the remaining variables included in the model
excessive screen time, thereby justifying the differenc-es between studidifferenc-es. Easy accdifferenc-ess to electronic devicdifferenc-es, changes in family relationships, fewer public spaces for outdoor activities and lack of security in urban centers result in young people’s engaging in more leisure activ-ities at home, which leads to more exposure to screen-based devices4. Furthermore, the simultaneous use of
more than one electronic device is increasingly com-mon in young people, which favors a rise in screen time in this population2.
Several correlates identified in the present study are consistent with literature reports2,4,9,10,15,23. However, it
is important to underscore that, in contrast to some studies15,23 but in line with others2,4,9,10, sex showed
no significant association with excessive screen time. This lack of consensus may be related to the number of electronic devices considered in the definition of screen time in the different studies. Research that has shown sex as a correlate of screen time only investigated TV viewing time, while other studies also considered the use of a computer, videogame, tablet and smartphone. The family’s education should also be taken into ac-count. In some families, girls are more encouraged than in others to stay at home for longer periods studying and doing domestic chores, increasing the likelihood of watching TV and using other screen-based devices.
Age was found to be an important correlate of ex-cessive screen time, which coincides with the findings of earlier studies2,4,9,10,15,23. Older students exhibit
progres-sively more probability of exceeding the recommend-ed daily screen time than their younger counterparts, such that, at 16-20 years of age, the chance of students spending > 2 hours/day using screen-based devices is about two-fold higher than those aged 4-7 years (OR = 1.92; CI95%: 1.60–2.33). Another aspect observed in the study is the trend to less TV time with advancing age, concomitantly with a rise in computer, videogame, tablet and smartphone use. This situation may be relat-ed to the fact that older adolescents are not as restrictrelat-ed by their parents to use electronic devices, show less in-terest and expectation for other types of entertainment involving physical activity, especially sports, feel strong-ly attracted to social networks, intensify their online in-teractions with peers, and may use the computer more effectively for study and work3.
No significant associations were observed between excessive screen time, ethnicity and family structure. Bivariate analysis demonstrated that family structure was a likely correlate of excessive screen time (p =
0.164); however, following multivariate analysis, after adjusting for the other demographic variables, it was no longer associated. In relation to economic class, in developed countries economic level has been shown to be negatively associated with screen time, and young people from less privileged families spend more time using screen-based devices, especially when consid-ering only time spent watching TV9. However, in the
present study and similar to that reported in other Bra-zilian surveys14,15 and in Latin American countries10,23,
the opposite trend was observed, that is, students from families with higher purchasing power are more prone to using screen-based devices for > 2 hours/day. As such, the higher purchasing power of Brazilian families and resulting ease in acquiring technological equipment for their children have contributed strongly to raising the screen time of students, unlike that observed in more developed countries.
With respect to living area, the urban/rural gradi-ent was also a correlate of excessive screen time, which is consistent with the findings of earlier studies involv-ing young Brazilians15 and individuals from other
Lat-in American countries10,23. Although this observation
may partially reflect differences in the economic class of families living in urban and rural areas, it is impor-tant to note that the association between excessive screen time and living area remained in multivariate analyses, even after the other demographic indicators were adjusted, including economic class. This suggests that students from urban areas likely have more ac-cess to screen-based technologies, for example, more TV channels and faster internet, which increases the chance of spending more time on screen devices.
Data stratified by the number of inhabitants in the students’ hometown showed that excessive screen time is not restricted to large urban centers (83.4%; CI95%: 78.3–88.6). In this case, more than half the students that live in smaller, less developed cities (57.5%; CI95%: 54.6–60.5) also reported using screen-based devices for more than 2 hours/day. Multivariate anal-ysis, controlling the other demographic correlates, in-dicated that living in cities with more than 500,000 inhabitants nearly triples the chances of students’ ex-ceeding screen time (OR = 2.94; CI95%: 2.41–3.75). This may be explained by the greater risk of social dis-orders and conflicts, caused by the high concentration of people, contributing significantly to families living in more populated centers placing greater value on en-tertainment and leisure options for their children that
involve screen-based devices24.
In regard to physical activity, an earlier meta-anal-ysis involving children and adolescents revealed that their association with screen time, when significant, was of low magnitude25. Furthermore, intervention
proposals aimed at increasing physical activity have not achieved the desired effect of reducing TV view-ing time26. However, the results obtained here
demon-strate that less physically active young people are twice as likely to exceed the screen time recommended by current guidelines compared to their more active counterparts (OR = 1.96; 95%CI:1.56–2.67). Possible differences in the strength of the association between physical activity and screen time may sometimes occur due to the different ages of the young people sampled in the studies, measurement instruments used and analysis procedures applied in data interpretation.
The significant association with the intake of fruits/ vegetables and sweetened products/soft drinks rein-forces the position that eating habits are another im-portant behavioral correlate of excessive screen time. In this case, an inverse association was found between greater fruit/vegetable intake and screen time > 2 hours/ day and a direct association between higher sweetened products/soft drink consumption and excessive screen time. Other studies also indicate, specifically in children and adolescents, that excessive screen time is associated with less healthy eating habits4. Given that watching
TV accounts for the largest proportion of screen time, one of the reasons that may justify the close association between excessive screen time and unhealthy eating habits is the fact that young people are more intensely exposed to advertisements for sweetened products/soft drink, making them more likely to consume both types of food27. Moreover, the prolonged use of computers,
videogames, tablets and smartphones may cause alien-ation and abstraction, which lead to less awareness of the need for healthy eating or result in young people ignoring meal times and substituting them with ready-to-eat processed foods28.
Another finding obtained in the present study was the significant inverse relationship between excessive screen time and sleep duration, which corroborates oth-er litoth-erature results6. The effects of exposure to
screen-based devices on the sleep of students have been in-tensely investigated in recent decades. At this age, sleep is considered particularly important for learning and memory, in addition to having implications for emo-tional regulation and behavior. More specifically, poor
sleep quality and insufficient duration are related to stimuli processing deficiencies and the ability to con-centrate, which, in turn, translates into compromised academic performance29. In this case, if the
screen-based device is used at night, three primary mechanisms may justify insufficient sleep duration. The first is the reduced time available for sleeping, given the time spent in front of the screen-based device. The second is relat-ed to psychological and physiological excitation, due to the involvement and interaction with electronic media content that interferes in young people’s ability to fall asleep and remain asleep. Furthermore, screen bright-ness affects the circadian rhythm, mediated by the phys-iological suppression of melatonin, the sleep-promoting hormone30.
The fact that longer screen times correlated with greater excess weight and body fat is consistent with earlier findings observed in cross-sectional9 and
longi-tudinal3 studies, confirming the hypothesis that
exces-sive screen time is strongly associated with anthropo-metric nutritional status. Investigators in the area have sought to attribute the behavioral traits of young peo-ple who use screen-based devices for extended periods of time (for example, greater intake of unhealthy food and less physical activity) to the association between excessive screen time and excess weight and body fat4,9.
However, it is important to underscore that, specifi-cally in the present study, both anthropometric indi-cators related to nutritional status (BMI and WHR) remained significantly associated with excessive screen time even when adjusted for demographic and behav-ioral correlates (physical activity, fruit/vegetable and sweetened products/soft drink intake and sleep dura-tion). In this respect, future studies on the issue should be conducted to elucidate the independent effect of excessive screen time on greater weight and body fat accumulation.
Among the limitations of the present study is that the investigation method used involved a self-reported questionnaire, which may cause memory bias or even emphasis on positive findings. However, these indica-tors are reported by parents, guardians or the students themselves, the usual procedure in these types of stud-ies and the most viable method of conducting school-based or population surveys. Furthermore, the large sample makes it possible, to a certain extent, to min-imize potential inaccuracies in the estimates calculat-ed. In addition, the cross-sectional analysis of the data precludes inferring causality in the association between
excessive screen time and the correlates investigated, because the outcome and the remaining variables were identified at the same time.
On the other hand, the main strengths are relat-ed to the concept, design and implementation of the Healthy Paraná Project. The project exhibits cultural diversity, covers a wide geographic area, and provides robust updated data on the health-related lifestyle of students from a state in Southern Brazil, which makes it possible to generalize its findings to a broader pop-ulation. The team of investigators completed the train-ing phase before data collection, which were tested periodically via replicate measurements to ensure the quality of the information collected. The refusal rate to take part in the study was minimal, thereby guarantee-ing the reliability of results.
In conclusion, the students selected for the study spent an excessive amount of time watching TV and in front of other screen-based devices (computer, videog-ame, tablet and smartphone), especially older individuals, the economically advantaged, those whose mothers had more schooling and residents of cities with high pop-ulations. Most of the students (around 70%) exceeded the screen time recommended by current guidelines (≤ 2 hours/day). The inverse significant associations between excessive screen time and behavioral correlates (physical activity, healthy eating habits and sleep duration), along with a direct association with anthropometric correlates (greater weight and body fat accumulation), suggest that policies and interventions aimed at health education programs in school and family settings should concen-trate on reducing excessive screen time.
Conflict of interest
The authors declared no conflict of interest.
Funding
The study was funded by the Secretary of Sport of the State of Pa-rana, Brazil. The primary author is supported by Brazilian Natio-nal Board for Scientific and Technological Development – CNPq.
Authors’ contributions:
Guedes DP, Gonçalves HR and Desiderá RA participated equally in article design, data collection and analysis, writing and critical review of the manuscript.
Acknowledgments
The authors extend special thanks to staff of the Secretary of Sport of the State of Parana, Brazil, for valuable help in
conduc-ting this study.
References
1. Sedentary Behaviour Research Network. Letter to the Editor:
standardized use of the terms “sedentary” and “sedentary behaviours”. Appl Physiol Nutr Metab. 2012;37:540–42.
2. Temmel CSD, Rhodes R. Correlates of Sedentary Behaviour
in Children and Adolescents Aged 7–18: A Systematic Review. Health Fit J Can. 2013;6:119–99.
3. Biddle SJ, Pearson N, Ross GM, Braithwaite R. Tracking of
sedentary behaviours of young people: a systematic review. Prev Med. 2010;51:345-51.
4. Cillero IH, Jago R. Systematic review of correlates of
screen-viewing among young children. Prev Med. 2010;51:3-10.
5. Herman KM, Hopman WM, Sabiston CM. Physical activity,
screen time and self-rated health and mental health in Canadian adolescents. Prev Med. 2015;73C:112–6.
6. Hale L, Guan S. Screen time and sleep among school-aged
children and adolescents: a systematic literature review. Sleep Med Rev. 2015;21:50-8.
7. American Academy of Pediatrics; Council on
Communications and Media. Children, adolescents, obesity, and the media. Pedriatrics. 2011;128:201-8.
8. Mark AE, Boyce WF, Janssen I. Television viewing, computer
use and total screen time in Canadian youth. Paediatr Child Health 2006; 11(9):595-9.
9. Inchley J, Currie C, Young T, Samda IO, Torsheim T,
Augustson L et al. Growing up unequal: gender and socioeconomic differences in young people´s health and well-being. Health Behaviour in School-Aged Children (HBSC) Study: International Report from the 2013/2014 Survey. Health Policy for Children and Adolescents. No. 7. Copenhagen, Denmark: WHO Regional Office for Europe. 2016. p.1-292.
10. Janssen I, Medina C, Pedroza A, Barquera S. Screen time in
Mexican children: findings from the 2012 National Health and Nutrition Survey (ENSANUT 2012). Salud Publica Mex 2013;55:484-91.
11. Barbosa Filho VC, Campos W, Lopes AS. Epidemiology of
physical inactivity, sedentary behaviors, and unhealthy eating habits among Brazilian adolescents: a systematic review. Cien Saude Colet. 2014;19:173-93.
12. IBGE – Instituto Brasileiro de Geografia e Estatística.
Pesquisa Nacional de Saúde do Escolar. PeNSE/2015. Rio de Janeiro: Coordenação de População e Indicadores Sociais/ IBGE. 2016.
13. van Sluijs EM, Kriemler S, McMinn AM. The effect of
community and family interventions on young people’s physical activity levels: a review of reviews and updated systematic review. Br J Sports Med. 2011;45:914–22.
14. Tenório M, Barros M, Tassitano R, Bezerra J, Tenório J,
Hallal P. Atividade física e comportamento sedentário em adolescentes estudantes do ensino médio. Rev Bras Epidemiol. 2010; 13:105-17.
15. Silva KS, Nahas MV, Peres KG, Lopes AS. Fatores associados
à atividade física, comportamento sedentário e participação na Educação Física em estudantes do Ensino Médio em Santa Catarina, Brasil. Cad Saude Publica. 2009;25(10):2187-200.
16. World Health Organization – WHO. Physical Status: The
Use and Interpretation of Anthropometry. Report of a WHO Expert Committee. WHO – Technical Report Series, v. 854, p.1-452. 1995.
Quote this article as:
Guedes DP, Desidera RA, Gonçalves HR. Prevalence of excessive screen time and associated correlates in brazilian schoolchildren. Rev Bras Ativ Fis Saude. 2018;23:e0003. DOI: 10.12820/rbafs.23e0003
17. Cole TJ, Lobstein T. Extended international (IOTF) body
mass index cut-offs for thinness, overweight and obesity. Pediatr Obes. 2012;7:284-94.
18. Bauer KW, Marcus MD, El Ghormli L, Ogden CL, Foster
GD. Cardio-metabolic risk screening among adolescents: understanding the utility of body mass index, waist circumference and waist to height ratio. Pediatr Obes. 2015;10(5):329-37.
19. Associação Brasileira de Empresas de Pesquisa – ABEP.
Critério de Classificação Econômica Brasil. São Paulo: Associação Brasileira de Empresas de Pesquisa. 2014.
20. Guedes DP, Lopes CC. Validation of the Brazilian version
of the 2007 Youth Risk Behavior Survey. Rev Saude Publica. 2010; 44(5):840-50.
21. Guedes DP, Guedes JERP. Measuring physical activity in
Brazilian youth: reproducibility and validity of the PAQ-C and PAQ-A. Rev Bras Med Esporte. 2015;21(6):425-32.
22. Kann L, McManus T, Harris WA, Shanklin SL, Flint KH,
Hawkins J et al. Youth Risk Behavior Surveillance — United States, 2015. MMWR. 2016; 65(4).
23. Gómez LF, Lucumí DI, Parra DC, Lobelo F. Niveles de
urbanización, uso de televisión y video-juegos en niños colombianos: Posibles implicaciones en salud pública. Rev Salud Pública. 2008;10(4):505-16.
24. Carson V, Janssen I. Neighborhood disorder and screen time
among 10-16 year old Canadian youth: a cross-sectional study. Int J Behav Nutr Phys Act. 2012;9:66.
25. Pearson N, Braithwaite ER, Biddle SJ, Van Sluijs EM, Atkin
AJ. Associations between sedentary behaviour and physical activity in children and adolescents: a meta-analysis. Obes Rev. 2014;15:666-75.
26. Biddle SJ, Petrolini I, Pearson N. Interventions designed to
reduce sedentary behaviours in young people: a review of reviews. Br J Sports Med. 2014;48:182-6.
27. Temple JL, Giacomelli AM, Kent KM, et al. Television
watching increases motivated responding for food and energy intake in children. Am J Clin Nutr. 2007;85:355–61.
28. Marsh S, Ni Mhurchu C, Maddison R. The non-advertising
effects of screen-based sedentary activities on acute eating behaviours in children, adolescents, and young adults. A systematic review. Appetite. 2013;71:259–73.
29. Dewald JF, Meijer AM, Oort FJ, Kerkhof GA, Bögels SM.
The influence of sleep quality, sleep duration and sleepiness on school performance in children and adolescents: a meta-analytic review. Sleep Med Rev. 2010;14:179–89.
30. Dube N, Khan K, Loehr S, Chu Y, Veugelers P. The use of
entertainment and communication technologies before sleep could affect sleep and weight status: a population-based study among children. Int J Behav Nutr Phys Act. 2017;14(1):97.
Recebido: 20/08/2017 Aprovado: 29/11/2017