1 Jazan University, College of Dentistry, Department of Preventive Sciences, Division of Orthodontics and Dentofacial Orthopedics (Jazan, Saudi Arabia). 2 Ibb University, Faculty of Oral and Dental Medicine, Department of
Orthodontics and Dentofacial Orthopedics (Ibb, Republic of Yemen). 3 Jazan University, College of Dentistry, Department of Maxillofacial Surgery
and Diagnostic Sciences (Jazan, Saudi Arabia).
4 Cairo University, Faculty of Oral and Dental Medicine, Department of Orthodontics and Dentofacial Orthopedics (Cairo, Egypt).
5 University of Malaya, Faculty of Dentistry, Department of Pediatric Dentistry and Orthodontics (Kuala Lumpur, Malaysia).
6 Kyoto University, Graduate School of Medicine, Department of Global Health and Socio-epidemiology (Kyoto, Japan).
Global distribution of malocclusion traits:
A systematic review
Maged Sultan Alhammadi1,2, Esam Halboub3, Mona Salah Fayed4,5, Amr Labib4, Chrestina El-Saaidi6
Objective: Considering that the available studies on prevalence of malocclusions are local or national-based, this study aimed to pool
data to determine the distribution of malocclusion traits worldwide in mixed and permanent dentitions. Methods: An electronic search
was conducted using PubMed, Embase and Google Scholar search engines, to retrieve data on malocclusion prevalence for both mixed
and permanent dentitions, up to December 2016. Results: Out of 2,977 retrieved studies, 53 were included. In permanent dentition,
the global distributions of Class I, Class II, and Class III malocclusion were 74.7% [31 – 97%], 19.56% [2 – 63%] and 5.93% [1 – 20%], respectively. In mixed dentition, the distributions of these malocclusions were 73% [40 – 96%], 23% [2 – 58%] and 4% [0.7 – 13%]. Regarding vertical malocclusions, the observed deep overbite and open bite were 21.98% and 4.93%, respectively. Posterior crossbite affected 9.39% of the sample. Africans showed the highest prevalence of Class I and open bite in permanent dentition (89% and 8%, respectively), and in mixed dentition (93% and 10%, respectively), while Caucasians showed the highest prevalence of Class II in perma-nent dentition (23%) and mixed dentition (26%). Class III malocclusion in mixed dentition was highly prevalent among Mongoloids.
Conclusion: Worldwide, in mixed and permanent dentitions, Angle Class I malocclusion is more prevalent than Class II, specifically among Africans; the least prevalent was Class III, although higher among Mongoloids in mixed dentition. In vertical dimension, open bite was highest among Mongoloids in mixed dentition. Posterior crossbite was more prevalent in permanent dentition in Europe.
Keywords: Prevalence. Malocclusion. Global health. Population. Permanent dentition. Mixed dentition.
DOI: https://doi.org/10.1590/2177-6709.23.6.40.e1-10.onl
How to cite: Alhammadi MS, Halboub E, Fayed MS, Labib A, El-Saaidi C. Global distribution of malocclusion traits: A systematic review. Dental Press J Or-thod. 2018 Nov-Dec;23(6):40.e1-10.
DOI: https://doi.org/10.1590/2177-6709.23.6.40.e1-10.onl
Submitted: July 12, 2017 - Revised and accepted: June 01, 2018
» The authors report no commercial, proprietary or financial interest in the products or companies described in this article.
Contact address: Esam Halboub
Department of Maxillofacial Surgery and Diagnostic Sciences College of Dentistry, Jazan University, Jazan, Saudi Arabia E-mail: [email protected]
Objetivo: considerando-se que os estudos disponíveis sobre a prevalência das más oclusões são de base local ou nacional, esse estudo teve como objetivo reunir dados para determinar a distribuição dos tipos de má oclusão em uma escala global, nas dentições permanente
e mista. Métodos: foi realizada uma busca eletrônica através das ferramentas de pesquisa do PubMed, Embase e Google Acadêmico,
para reunir estudos publicados até dezembro de 2016 sobre a prevalência das más oclusões, tanto na dentição permanente quanto na
dentição mista. Resultados: dos 2.977 estudos encontrados, 53 foram analisados. Na dentição permanente, a distribuição mundial das
más oclusões de Classe I, II e III foi, respectivamente, de 74,7% [31 – 97%], 19,56% [2 – 63%] e 5,93% [1 – 20%]. Na dentição mista, a distribuição dessas más oclusões foi de 73% [40 – 96%], 23% [2 – 58%] e 4% [0,7 – 13%]. Em relação às más oclusões verticais, observou--se prevalência de 21,98% de sobremordida profunda e 4,93% de mordida aberta. A mordida cruzada posterior afetou 9,39% da amostra. Os africanos mostraram a maior prevalência de Classe I e mordida aberta na dentição permanente (89% e 8%, respectivamente) e na dentição mista (93% e 10% respectivamente), enquanto os caucasianos apresentaram a maior prevalência de Classe II na dentição
perma-nente (23%) e na dentição mista (26%). A má oclusão de Classe III na dentição mista foi mais prevalente entre xantodermas.
Conclu-são: mundialmente, nas dentições mista e permanente, as más oclusões de Classe I de Angle são mais prevalentes do que as de Classe II, especificamente entre os africanos; a menos prevalente foi a Classe III, ainda que mais prevalente entre os xantodermas na dentição mista. Na dimensão vertical, as mordidas abertas foram mais prevalentes entre xantodermas na dentição mista. A mordida cruzada posterior apresentou maior prevalência na dentição permanente na Europa.
INTRODUCTION
Angle introduced his famous classification of
malocclusion in 1899.1 Now the World Health
Or-ganization estimates malocclusions as the third most prevalent oral health problem, following dental caries and periodontal diseases.2
Many etiological factors for malocclusion have been proposed. Genetic, environmental, and ethnic factors are the major contributors in this context. Certain types of malocclusion, such as Class III rela-tionship, run in families, which gives a strong relation between genetics and malocclusion. Likewise is the ethnic factor, where the bimaxillary protrusion, for example, affects the African origin more frequently than other ethnicities. On the other hand, functional adaptation to environmental factors affects the sur-rounding structures including dentitions, bone, and soft tissue, and ultimately resulting in different mal-occlusion problems. Thus, malmal-occlusion could be considered as a multifactorial problem with no spe-cific cause so far.3
A search in the literature for studies on prevalence of malocclusion and related factors revealed that most of these epidemiological investigations were pub-lished between the 1940s and the 1990s. Thereafter, publications have been turned into focusing more on determination of treatment needs, treatment
tech-niques and mechanisms, and treatment outcomes.4
Epidemiological studies play a pivotal role in terms of determining the size of the health problems, pro-viding the necessary data and generating and analyz-ing hypotheses of associations, if any. Through these valuable information, the priorities are set and the
health policies are developed.5 Hence, the quality
of these epidemiological studies must be evaluated crucially and it will be valuable to pool their results, whenever possible.
In this regard, there has been a continuous increase in conducting critical analyses for the published epi-demiological health studies. The aim behind this is to generate a more precise and trusted evidence on the health problem under investigation using strict criteria for quality analysis. However, few have been conducted in orthodontics. The objective of the cur-rent study, therefore, was to present a comprehensive estimation on the prevalence of malocclusion in dif-ferent populations and continents.
MATERIALS AND METHODS Search method
A literature search in PubMed, Embase, and Google Scholar search engines was conducted up to December 2016. The following search terms were used: ‘Prevalence’, ‘Malocclusion’, ‘Mixed denti-tion', and 'Permanent dentition’. In addition, an electronic search in websites of the following jour-nals was conducted: Angle Orthodontist, American Journal of Orthodontics and Dentofacial Orthope-dics, Journal of Orthodontics, and European Jour-nal of Orthodontics.
Studies that fulfilled the following criteria were included:
1) Population-based studies.
2) Sample size greater than 200 subjects.
3) Studies that evaluated malocclusion during mixed and/ or permanent dentitions.
4) Studies that used Angle's classification of mal-occlusion.
5) Studies that considered the following defini-tions of the specified malocclusion characteristics: “abnormal overjet” if more than 3mm; “reverse over-jet” when all four maxillary incisors were in a cross-bite; “abnormal overbite” if more than 2.5 mm (for deep bite) and if less than 0 mm (for open bite); and “posterior crossbite” when affecting more than two teeth. The malocclusion traits included were: Angle Classification (Class I / II / III), overjet (increased / reversed), overbite (deep bite / open bite), posterior crossbite, based on the above mentioned definitions for these traits.
A study was excluded if it was conducted in a clin-ical/hospital-based setting and/or targeted malocclu-sion prevalence in primary dentition or in a popula-tion with specific medical problem.
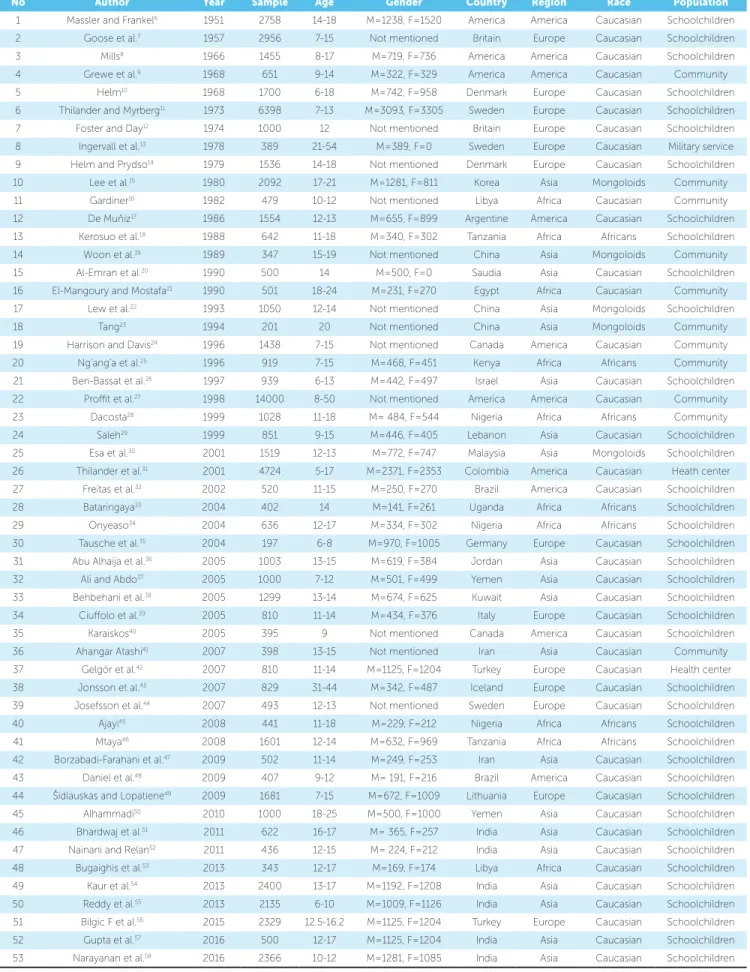
Characteristics of all studies6-58 analyzed were for-mulated similar to that used in analysis of epidemio-logical studies59,60 (Table 1).
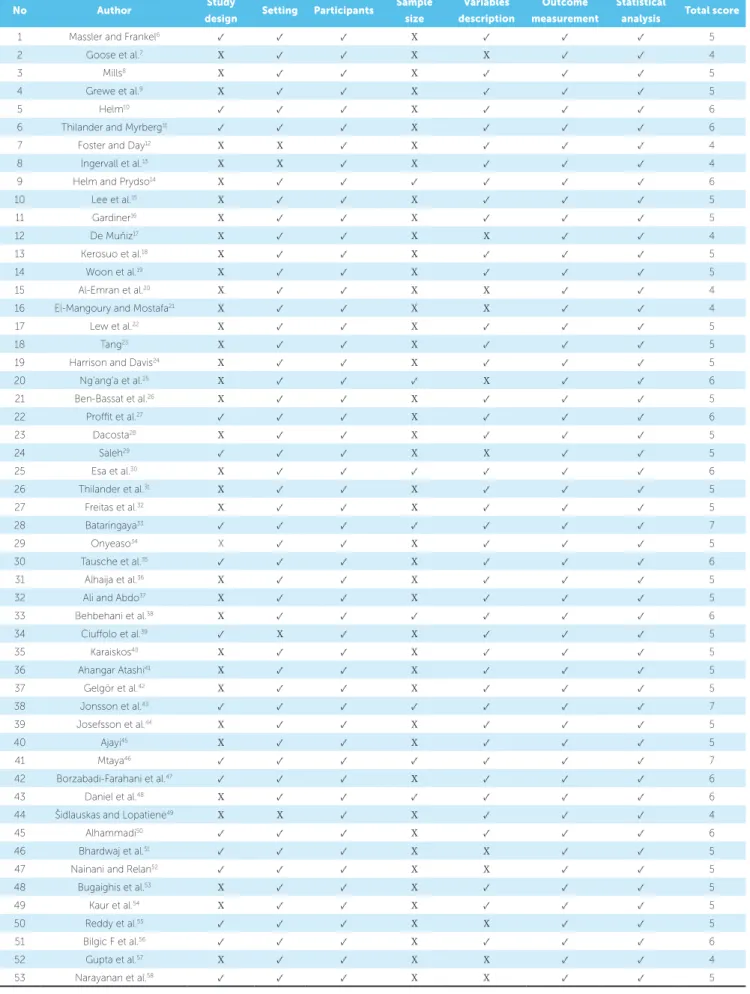
Critical appraisal of the included studies was done based on a modified version of STROBE
check-list61,62 comprising seven items related to: study
Table 1 - Characteristics of the included studies.
M = male; F = female.
No Author Year Sample Age Gender Country Region Race Population
1 Massler and Frankel6 1951 2758 14-18 M=1238, F=1520 America America Caucasian Schoolchildren
2 Goose et al.7 1957 2956 7-15 Not mentioned Britain Europe Caucasian Schoolchildren
3 Mills8 1966 1455 8-17 M=719, F=736 America America Caucasian Schoolchildren
4 Grewe et al.9 1968 651 9-14 M=322, F=329 America America Caucasian Community
5 Helm10 1968 1700 6-18 M=742, F=958 Denmark Europe Caucasian Schoolchildren
6 Thilander and Myrberg11 1973 6398 7-13 M=3093, F=3305 Sweden Europe Caucasian Schoolchildren
7 Foster and Day12 1974 1000 12 Not mentioned Britain Europe Caucasian Schoolchildren
8 Ingervall et al.13 1978 389 21-54 M=389, F=0 Sweden Europe Caucasian Military service
9 Helm and Prydso14 1979 1536 14-18 Not mentioned Denmark Europe Caucasian Schoolchildren
10 Lee et al.15 1980 2092 17-21 M=1281, F=811 Korea Asia Mongoloids Community
11 Gardiner16 1982 479 10-12 Not mentioned Libya Africa Caucasian Community
12 De Muňiz17 1986 1554 12-13 M=655, F=899 Argentine America Caucasian Schoolchildren
13 Kerosuo et al.18 1988 642 11-18 M=340, F=302 Tanzania Africa Africans Schoolchildren
14 Woon et al.19 1989 347 15-19 Not mentioned China Asia Mongoloids Community
15 Al-Emran et al.20 1990 500 14 M=500, F=0 Saudia Asia Caucasian Schoolchildren
16 El-Mangoury and Mostafa21 1990 501 18-24 M=231, F=270 Egypt Africa Caucasian Community
17 Lew et al.22 1993 1050 12-14 Not mentioned China Asia Mongoloids Schoolchildren
18 Tang23 1994 201 20 Not mentioned China Asia Mongoloids Community
19 Harrison and Davis24 1996 1438 7-15 Not mentioned Canada America Caucasian Community
20 Ng’ang’a et al.25 1996 919 7-15 M=468, F=451 Kenya Africa Africans Community
21 Ben-Bassat et al.26 1997 939 6-13 M=442, F=497 Israel Asia Caucasian Schoolchildren
22 Proffit et al.27 1998 14000 8-50 Not mentioned America America Caucasian Community
23 Dacosta28 1999 1028 11-18 M= 484, F=544 Nigeria Africa Africans Community
24 Saleh29 1999 851 9-15 M=446, F=405 Lebanon Asia Caucasian Schoolchildren
25 Esa et al.30 2001 1519 12-13 M=772, F=747 Malaysia Asia Mongoloids Schoolchildren
26 Thilander et al.31 2001 4724 5-17 M=2371, F=2353 Colombia America Caucasian Heath center
27 Freitas et al.32 2002 520 11-15 M=250, F=270 Brazil America Caucasian Schoolchildren
28 Bataringaya33 2004 402 14 M=141, F=261 Uganda Africa Africans Schoolchildren
29 Onyeaso34 2004 636 12-17 M=334, F=302 Nigeria Africa Africans Schoolchildren
30 Tausche et al.35 2004 197 6-8 M=970, F=1005 Germany Europe Caucasian Schoolchildren
31 Abu Alhaija et al.36 2005 1003 13-15 M=619, F=384 Jordan Asia Caucasian Schoolchildren
32 Ali and Abdo37 2005 1000 7-12 M=501, F=499 Yemen Asia Caucasian Schoolchildren
33 Behbehani et al.38 2005 1299 13-14 M=674, F=625 Kuwait Asia Caucasian Schoolchildren
34 Ciuffolo et al.39 2005 810 11-14 M=434, F=376 Italy Europe Caucasian Schoolchildren
35 Karaiskos40 2005 395 9 Not mentioned Canada America Caucasian Schoolchildren
36 Ahangar Atashi41 2007 398 13-15 Not mentioned Iran Asia Caucasian Community
37 Gelgör et al.42 2007 810 11-14 M=1125, F=1204 Turkey Europe Caucasian Health center
38 Jonsson et al.43 2007 829 31-44 M=342, F=487 Iceland Europe Caucasian Schoolchildren
39 Josefsson et al.44 2007 493 12-13 Not mentioned Sweden Europe Caucasian Schoolchildren
40 Ajayi45 2008 441 11-18 M=229, F=212 Nigeria Africa Africans Schoolchildren
41 Mtaya46 2008 1601 12-14 M=632, F=969 Tanzania Africa Africans Schoolchildren
42 Borzabadi-Farahani et al.47 2009 502 11-14 M=249, F=253 Iran Asia Caucasian Schoolchildren
43 Daniel et al.48 2009 407 9-12 M= 191, F=216 Brazil America Caucasian Schoolchildren
44 Šidlauskas and Lopatienė49 2009 1681 7-15 M=672, F=1009 Lithuania Europe Caucasian Schoolchildren
45 Alhammadi50 2010 1000 18-25 M=500, F=1000 Yemen Asia Caucasian Schoolchildren
46 Bhardwaj et al.51 2011 622 16-17 M= 365, F=257 India Asia Caucasian Schoolchildren
47 Nainani and Relan52 2011 436 12-15 M= 224, F=212 India Asia Caucasian Schoolchildren
48 Bugaighis et al.53 2013 343 12-17 M=169, F=174 Libya Africa Caucasian Schoolchildren
49 Kaur et al.54 2013 2400 13-17 M=1192, F=1208 India Asia Caucasian Schoolchildren
50 Reddy et al.55 2013 2135 6-10 M=1009, F=1126 India Asia Caucasian Schoolchildren
51 Bilgic F et al.56 2015 2329 12.5-16.2 M=1125, F=1204 Turkey Europe Caucasian Schoolchildren
52 Gupta et al.57 2016 500 12-17 M=1125, F=1204 India Asia Caucasian Schoolchildren
Table 2 - STROBE -based quality analysis of the included studies.
No Author Study
design Setting Participants
Sample size
Variables description
Outcome measurement
Statistical
analysis Total score
1 Massler and Frankel6 ✓ ✓ ✓ X ✓ ✓ ✓ 5
2 Goose et al.7 X ✓ ✓ X X ✓ ✓ 4
3 Mills8 X ✓ ✓ X ✓ ✓ ✓ 5
4 Grewe et al.9 X ✓ ✓ X ✓ ✓ ✓ 5
5 Helm10 ✓ ✓ ✓ X ✓ ✓ ✓ 6
6 Thilander and Myrberg11 ✓ ✓ ✓ X ✓ ✓ ✓ 6
7 Foster and Day12 X X ✓ X ✓ ✓ ✓ 4
8 Ingervall et al.13 X X ✓ X ✓ ✓ ✓ 4
9 Helm and Prydso14 X ✓ ✓ ✓ ✓ ✓ ✓ 6
10 Lee et al.15 X ✓ ✓ X ✓ ✓ ✓ 5
11 Gardiner16 X ✓ ✓ X ✓ ✓ ✓ 5
12 De Muňiz17 X ✓ ✓ X X ✓ ✓ 4
13 Kerosuo et al.18 X ✓ ✓ X ✓ ✓ ✓ 5
14 Woon et al.19 X ✓ ✓ X ✓ ✓ ✓ 5
15 Al-Emran et al.20 X ✓ ✓ X X ✓ ✓ 4
16 El-Mangoury and Mostafa21 X ✓ ✓ X X ✓ ✓ 4
17 Lew et al.22 X ✓ ✓ X ✓ ✓ ✓ 5
18 Tang23 X ✓ ✓ X ✓ ✓ ✓ 5
19 Harrison and Davis24 X ✓ ✓ X ✓ ✓ ✓ 5
20 Ng’ang’a et al.25 X ✓ ✓ ✓ X ✓ ✓ 6
21 Ben-Bassat et al.26 X ✓ ✓ X ✓ ✓ ✓ 5
22 Proffit et al.27 ✓ ✓ ✓ X ✓ ✓ ✓ 6
23 Dacosta28 X ✓ ✓ X ✓ ✓ ✓ 5
24 Saleh29 ✓ ✓ ✓ X X ✓ ✓ 5
25 Esa et al.30 X ✓ ✓ ✓ ✓ ✓ ✓ 6
26 Thilander et al.31 X ✓ ✓ X ✓ ✓ ✓ 5
27 Freitas et al.32 X ✓ ✓ X ✓ ✓ ✓ 5
28 Bataringaya33 ✓ ✓ ✓ ✓ ✓ ✓ ✓ 7
29 Onyeaso34 X ✓ ✓ X ✓ ✓ ✓ 5
30 Tausche et al.35 ✓ ✓ ✓ X ✓ ✓ ✓ 6
31 Alhaija et al.36 X ✓ ✓ X ✓ ✓ ✓ 5
32 Ali and Abdo37 X ✓ ✓ X ✓ ✓ ✓ 5
33 Behbehani et al.38 X ✓ ✓ ✓ ✓ ✓ ✓ 6
34 Ciuffolo et al.39 ✓ X ✓ X ✓ ✓ ✓ 5
35 Karaiskos40 X ✓ ✓ X ✓ ✓ ✓ 5
36 Ahangar Atashi41 X ✓ ✓ X ✓ ✓ ✓ 5
37 Gelgör et al.42 X ✓ ✓ X ✓ ✓ ✓ 5
38 Jonsson et al.43 ✓ ✓ ✓ ✓ ✓ ✓ ✓ 7
39 Josefsson et al.44 X ✓ ✓ X ✓ ✓ ✓ 5
40 Ajayi45 X ✓ ✓ X ✓ ✓ ✓ 5
41 Mtaya46 ✓ ✓ ✓ ✓ ✓ ✓ ✓ 7
42 Borzabadi-Farahani et al.47 ✓ ✓ ✓ X ✓ ✓ ✓ 6
43 Daniel et al.48 X ✓ ✓ ✓ ✓ ✓ ✓ 6
44 Šidlauskas and Lopatienė49 X X ✓ X ✓ ✓ ✓ 4
45 Alhammadi50 ✓ ✓ ✓ X ✓ ✓ ✓ 6
46 Bhardwaj et al.51 ✓ ✓ ✓ X X ✓ ✓ 5
47 Nainani and Relan52 ✓ ✓ ✓ X X ✓ ✓ 5
48 Bugaighis et al.53 X ✓ ✓ X ✓ ✓ ✓ 5
49 Kaur et al.54 X ✓ ✓ X ✓ ✓ ✓ 5
50 Reddy et al.55 ✓ ✓ ✓ X X ✓ ✓ 5
51 Bilgic F et al.56 ✓ ✓ ✓ X ✓ ✓ ✓ 6
52 Gupta et al.57 X ✓ ✓ X X ✓ ✓ 4
Statistical analysis
Prevalence rates, by different variables, were pre-sented as means and standard deviations (SD), with the minimum and maximum values. The data were checked for normal distribution using Kolmogorov-Smirnov test. As the distribution was not normal, analyses were conducted using non-parametric tests. Kruskal-Wallis test was used for comparisons between more than two groups. Mann-Whitney U test was used for pair-wise comparisons between groups whenever Kruskal-Wallis test was significant. Spearman's coefficient was calculat-ed to determine the correlations, if any, between differ-ent variables. All tests were supposed to be two-tailed, and the power and the significance values were set at 0.8 and 0.05, respectively. Statistical analysis was performed with IBM® SPSS® Statistics for Windows software, ver-sion 21 (Armonk, NY: IBM Corp.)
RESULTS
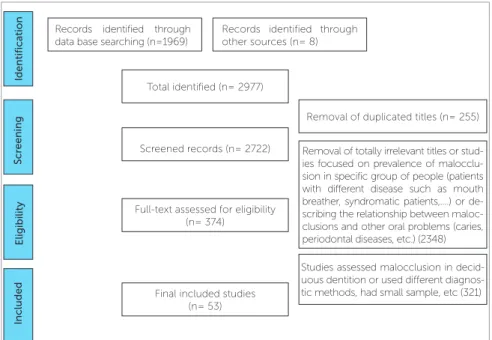
Two thousands nine hundreds and seventy seven studies were found to be potentially relevant to the study. The flow diagram (Fig 1) describes the process of articles retrieval; 255 articles were excluded due to du-plication. The main cause of dropping of the retrieved articles was removal of irrelevant titles (2,348). The final closely related were 374 articles published between years 1951 and 2016. After reading their abstracts, only 53 ar-ticles (Table 1) fulfilled the inclusion criteria and were included in the subsequent analyses.
The results of the critical appraisal of the included studies are presented in Table 2. The total quality score ranged from 4 to 7. Thirty eight studies (72%) were considered of moderate quality and fifteen (28%), of high quality. The most common drawbacks among all studies were failure to declare the study design (whether it is of cross-sectional, follow-up, etc.) and lack of sam-ple size calculation.
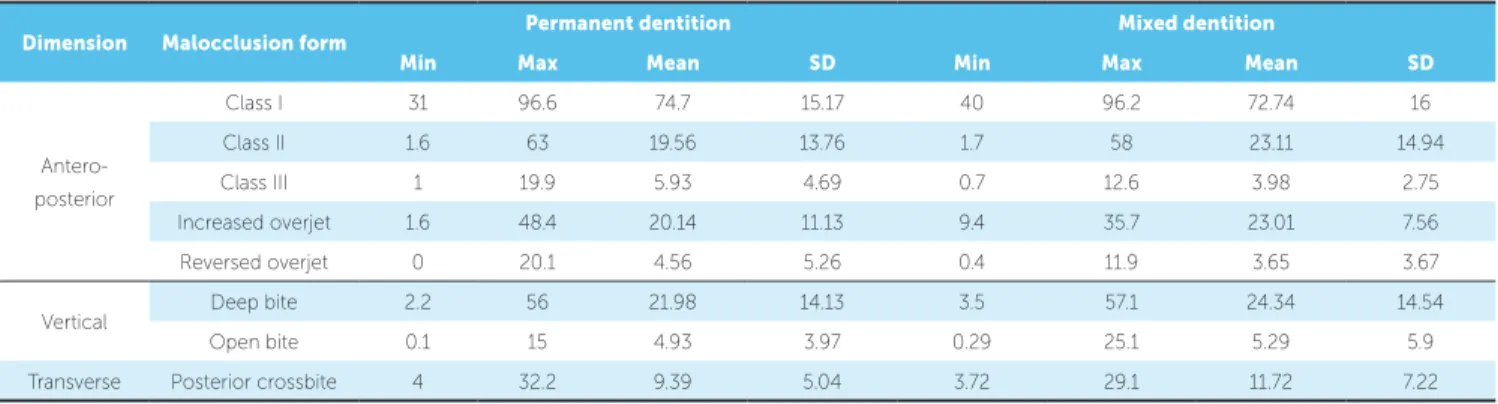
In permanent dentition (Table 3), the global distri-butions of Class I, Class II, and Class III were 74.7%, 19.56% and 5.93%, respectively. Increased and reverse overjet was recorded in 20.14% and 4.56%, respec-tively. Regarding vertical malocclusions, the observed deep overbite and open bite were 21.98% and 4.93%, respectively. Considering the transverse occlusal dis-crepancies, the posterior crossbite affected 9.39% of the total examined sample.
Regarding the distribution of malocclusion in adults according to geographical location (Table 4), four con-tinents classification system was considered, in which Americas are considered as one continent. In perma-nent dentition, Europe showed the highest prevalence of Class II and posterior crossbite (33.51% and 13.8%, respectively), and the lowest prevalence of Class I (60.38%). This was applied to mixed dentition regard-ing Class I and Class II. No statistically significant dif-ferences in prevalence of Class III, increased overjet, re-versed overjet, deep bite and open bite between the four geographic areas were reported.
Figure 1 - Flowchart of the literature selection process.
Records identified through data base searching (n=1969)
Records identified through other sources (n= 8)
Full-text assessed for eligibility (n= 374)
Studies assessed malocclusion in decid-uous dentition or used different diagnos-tic methods, had small sample, etc (321) Final included studies
(n= 53)
Removal of duplicated titles (n= 255)
Removal of totally irrelevant titles or stud-ies focused on prevalence of malocclu-sion in specific group of people (patients with different disease such as mouth breather, syndromatic patients,....) or de-scribing the relationship between maloc-clusions and other oral problems (caries, periodontal diseases, etc.) (2348) Total identified (n= 2977)
Screened records (n= 2722)
Included
Eligibility
Scr
eening
Identifica
Table 3 - Global prevalence of malocclusion in permanent and mixed dentitions
Table 4 - Prevalence of malocclusion in different geographic locations.
*: Significant at P ≤ 0.05.
Dimension Malocclusion form Permanent dentition Mixed dentition
Min Max Mean SD Min Max Mean SD
Antero-posterior
Class I 31 96.6 74.7 15.17 40 96.2 72.74 16
Class II 1.6 63 19.56 13.76 1.7 58 23.11 14.94
Class III 1 19.9 5.93 4.69 0.7 12.6 3.98 2.75
Increased overjet 1.6 48.4 20.14 11.13 9.4 35.7 23.01 7.56
Reversed overjet 0 20.1 4.56 5.26 0.4 11.9 3.65 3.67
Vertical Deep bite 2.2 56 21.98 14.13 3.5 57.1 24.34 14.54
Open bite 0.1 15 4.93 3.97 0.29 25.1 5.29 5.9
Transverse Posterior crossbite 4 32.2 9.39 5.04 3.72 29.1 11.72 7.22
Variable
Permanent dentition
P-value
America Africa Asia Europe
Mean SD Mean SD Mean SD Mean SD
Antero-posterior
Class I 78.53 8.56 83.68 12.48 78.93 9.77 60.39 16.76 0.019*
Class II 15.25 7.06 11.45 9.08 12.26 4.28 33.51 17.73 0.016*
Class III 6.23 2.68 4.75 4.6 6.32 6.46 6.2 2.75 0.5
Increased
overjet 16.67 5.61 21.4 13.91 19.79 10.5 20.79 12.38 0.9
Reversed
overjet 2.26 2.17 3.47 2.89 6.09 7 4.37 4.96 0.829
Vertical Deep bite 11.13 6.41 25.83 18.96 23.83 12.95 21.56 13.33 0.227
Open bite 5.03 4.32 6.34 3.12 4.01 3.86 4.92 4.82 0.378
Transverse Posterior
crossbite 7.08 2.24 7.9 1.78 8.27 2.65 13.08 7.93 0.029*
Mixed dentition
Antero-posterior
Class I 69.98 19.67 90 6.11 72.78 10.29 63.95 13.77 0.035*
Class II 27.22 20.22 7.5 5.71 21.42 10.4 31.95 12.47 0.024*
Class III 2.78 0.84 2.48 0.59 5.76 3.91 3.53 1.21 0.226
Increased
overjet 21.12 8.23 21.23 11.3 25.09 7.62 23.02 5.12 0.841
Reversed
overjet 3.9 5.01 5.25 4.22 4.35 3.63 1.33 0.9 0.348
Vertical Deep bite 14.98 7.73 23.3 15.5 22.09 9.97 37.4 17.62 0.122
Open bite 5.57 3.09 8.3 5.31 4.5 7.79 4.18 5.79 0.077
Transverse Posterior
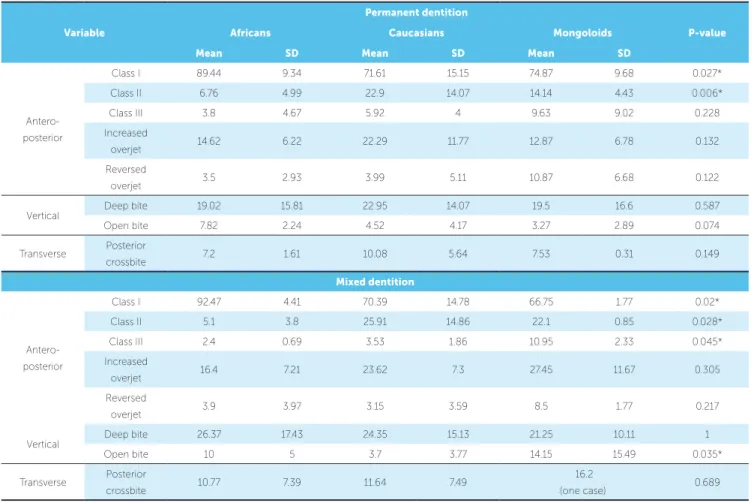
In permanent stage of dentition by ethnic groups, the highest prevalences of Class I malocclusion and open bite (89.44% and 7.82%, respectively) were reported among African population, although the difference of the lat-ter was not statistically significant. However, the high-est prevalence of Class II (22.9%) was reported among Caucasians. Otherwise, no statistically significant dif-ferences were found in prevalence of Class III, increased overjet, reversed overjet, deep bite and posterior cross-bite between the three main populations (Table 5).
The global distributions of Class I, Class II, and Class III in mixed dentition stage were 72.74%, 23.11% and 3.98%, respectively. The prevalence figures of in-creased and reverse overjet were 23.01% and 3.65%, re-spectively. Deep overbite and open bite cases were report-ed in 24.34% and 5.29%, respectively. Posterior crossbite represented 11.72% of the total pooled studies (Table 3).
Regarding prevalence of malocclusion in mixed dentition according to geographical location (Table 4), Africa showed the highest prevalence of Class I (90%)
but the lowest prevalence of Class II malocclusions (7.5%). The highest prevalence figures of Class II, Class III, and open bite malocclusions were reported in Europe (31.95%), Asia (5.76%), and Africa (8.3%), re-spectively. Deep bite was significantly higher in Europe (37.4%) compared to other geographical areas.
In mixed dentition, African population showed the highest prevalence of Class I (92.47%), but the low-est prevalence of Class II malocclusions (5.1%), while Caucasians showed the lowest prevalence of open bite (3.7%). Mongoloid showed significantly higher preva-lence of Class III (10.95%). No significant differences in the prevalence of other malocclusions were found be-tween different ethnicities (Table 5).
The prevalence of Class II was observed less frequently in permanent than in mixed dentition (19.56 ± 13.76 and 23.11 ± 14.94%, respectively), while the prevalence of Class III was observed more frequently in permanent than in mixed dentition (5.93 ± 4.96 and 3.98 ± 2.75, respectively).
Table 5 - Prevalence of malocclusion in different races
*: Significant at P ≤ 0.05.
Variable
Permanent dentition
P-value
Africans Caucasians Mongoloids
Mean SD Mean SD Mean SD
Antero-posterior
Class I 89.44 9.34 71.61 15.15 74.87 9.68 0.027*
Class II 6.76 4.99 22.9 14.07 14.14 4.43 0.006*
Class III 3.8 4.67 5.92 4 9.63 9.02 0.228
Increased
overjet 14.62 6.22 22.29 11.77 12.87 6.78 0.132
Reversed
overjet 3.5 2.93 3.99 5.11 10.87 6.68 0.122
Vertical Deep bite 19.02 15.81 22.95 14.07 19.5 16.6 0.587
Open bite 7.82 2.24 4.52 4.17 3.27 2.89 0.074
Transverse Posterior
crossbite 7.2 1.61 10.08 5.64 7.53 0.31 0.149
Mixed dentition
Antero-posterior
Class I 92.47 4.41 70.39 14.78 66.75 1.77 0.02*
Class II 5.1 3.8 25.91 14.86 22.1 0.85 0.028*
Class III 2.4 0.69 3.53 1.86 10.95 2.33 0.045*
Increased
overjet 16.4 7.21 23.62 7.3 27.45 11.67 0.305
Reversed
overjet 3.9 3.97 3.15 3.59 8.5 1.77 0.217
Vertical Deep bite 26.37 17.43 24.35 15.13 21.25 10.11 1
Open bite 10 5 3.7 3.77 14.15 15.49 0.035*
Transverse Posterior
crossbite 10.77 7.39 11.64 7.49
16.2
DISCUSSION
Global, regional and racial epidemiological assessment of malocclusions is of paramount importance, since it provides important data to assess the type and distribu-tion of occlusal characteristics. Such data will aid in de-termining and directing the priorities in regards to mal-occlusion treatment need, and the resources required to offer treatment — in terms of work capacity, skills, agility and materials to be employed. In addition, assessment of malocclusion prevalence by different populations and lo-cations may reflect existence of determining genetic and environmental factors. In line with that, the hypothesized tendency of changing prevalence of a specific type of malocclusion, such as Class II, from mixed to permanent dentition stage may give an indication about the effect of adolescent growth in correction of this problem. Fi-nally, the availability of such global data will be important for educational purposes. Regional and/or racial-specific malocclusion may change the health policy toward devel-oping the specialists’ skills and offering the resources re-quired for that malocclusion. It must be emphasized that the current study summarizes the global distribution of malocclusion in mixed and permanent dentitions based on data extracted from studies of moderate (72% of the included studies) to high (28%) quality. None of the in-cluded studies was of low quality.
The pooled global prevalence of Class I was the highest (74.7 ± 15.17%), ranging from 31% (Belgium) to 96.6% (Nigeria). It was higher among Africans (89.44%), but equivalent among Caucasians and Mongoloids (71.61% and 74.87%, respectively). This pattern of distribution was reported for both dentitions with slight differences. Noteworthy, the prevalence of Class I in permanent dentition of Mongoloids tends to increase with pubertal growth, mostly due to the associated tendency for Class II correction in this race specifically.
The overall global prevalence of Class II was 19.56%. However, it was interesting to see a wide range from 1.6% (Nigeria) to 63% (Belgium). The lowest prevalence was reported for Africans 6.76% and the highest was re-ported for Caucasian (22.9%); the rere-ported prevalence for Mongoloids was in-between (14.14%). The pattern of global distribution of Class II malocclusion by race was somewhat similar in mixed and permanent denti-tions. With exception of African people (Africa), there is a tendency for correction of Class II with pubertal growth upon transition from mixed to permanent dentition.
Both, prevalence and growth correction of Class II, can be attributed to the genetic influence. Recent research emphasizes the pivotal role of genetic control over con-dylar cartilage and concon-dylar growth.63,64
The global prevalence of Class III was the lowest among all Angle’s classes of malocclusion (5.93 ± 4.69%). The range was interestingly wide: 0.7% (Israel) to 19.9% (China). The corresponding figures for Caucasians, Af-ricans and Mongoloids were 5.92, 3.8% and 9.63%, re-spectively. This pattern of global distribution of Class III applies to mixed and permanent dentitions. A tendency to develop this type of malocclusion appears to increase upon transition from mixed to permanent dentition among Af-ricans and Caucasians, rather than among Mongoloids. The role of genetics must be emphasized. In fact, Class III malocclusion in Asians is mainly due to the mid-face defi-ciency, rather than mandibular prognathism.65
The positive correlation found between Class II and in-creased overjet is logical. Simply, this is due to the fact that the most prevalent Class II malocclusion globally is Class II division 1.66 Similarly, the positive correlation of Class III malocclusion with reversed overjet is related to skeletal base discrepancy with minimal dentoalveolar compensation.67
The lowest prevalent malocclusion traits globally were reversed overjet and open bite (4.56 and 4.93, respectively). There is a high variation in prevalence of both traits as re-ported in the literature. Most of the studies rere-ported that open bite trait is highly prevalent in African populations and low in Caucasian populations,17,18,20,25 in contrast to the re-versed overjet, which reported to be prevalent in Mongol-oids. In general, both traits are genetically determined.63,64
An interesting finding was the higher prevalence of Class II malocclusion in the mixed dentition than in the permanent dentition. This could be explained by the fact that self-correction of a skeletal Class II problem might occur in the late mixed and early permanent dentition stage as a result of a potential mandibular growth spurt. However, a sound conclusion can’t be drawn, as the pres-ent study was not prospective. In addition, the difference in leeway space between maxillary and mandibular arch-es, and residual growth in the permanent dentition stage could explain the higher prevalence of Class III maloc-clusion in the permanent dentition than in the mixed dentition, and the fact that the mandible might continue to grow till the mid- twenties.
permanent dentition. Thilander et al,31 likewise, showed that increased overbite was more prevalent in the mixed dentition. Such an overbite reduction from the mixed to the permanent dentition is due to both occlusal stabili-zation involving full eruption of premolars and second
molars, and the more pronounced mandibular growth.35
This also explains the reduction in Class II cases as well as the increase in Class III cases (reverse overjet as well) during the period of changing dentition.
In addition to the importance of reporting global mal-occlusion, it is of an equal importance to report the world-wide orthodontic treatment needs. We planned to do so if the included studies had covered both issues. This was not the case, however, and hence we recommend addressing this latter issue with a similar systematic review.
CONCLUSIONS
1) Consistent with most of the included individu-al studies, Class I and II mindividu-alocclusions were the most prevalent, while Class III and open bite were the least prevalent malocclusions.
2) African populations showed the highest preva-lence of Class I and open bite malocclusions, while Caucasian populations showed the highest prevalence of Class II malocclusion.
3) Europe continent showed the highest prevalence of Class II among all continents.
4) Class III malocclusion was more prevalent in permanent dentition than mixed dentition, conversely finding for Class II, while all other malocclusions vari-ables showed no difference between the two stages.
1. Angle EH. Classification of malocclusion. Dent Cosmos. 1899;41:248-64.
2. Guo L, Feng Y, Guo HG, Liu BW, Zhang Y. Consequences of orthodontic
treatment in malocclusion patients: clinical and microbial effects in adults and children. BMC Oral Health. 2016 Oct 28;16(1):112.
3. Heimer MV, Tornisiello Katz CR, Rosenblatt A. Non-nutritive sucking
habits, dental malocclusions, and facial morphology in Brazilian children: a longitudinal study. Eur J Orthod. 2008 Dec;30(6):580-5.
4. Brook PH, Shaw WC. The development of an index of orthodontic
treatment priority. Eur J Orthod. 1989 Aug;11(3):309-20.
5. Foster TD, Menezes DM. The assessment of occlusal features for public
health planning purposes. Am J Orthod. 1976 Jan;69(1):83-90.
6. Massler M, Frankel JM. Prevalence of malocclusion in children aged 14 to
18 years. Am J Orthod 1951;37(10):751-68.
7. Goose DH, Thompson, D.G., and Winter, F.C. Malocclusion in School
Children of the West Midlands. Brit Dent J. 1957;102:174-8.
8. Mills LF. Epidemiologic studies of occlusion. IV. The prevalence of
malocclusion in a population of 1,455 school children. J Dent Res. 1966;45:332-6.
9. Grewe JM, Cervenka J, Shapiro BL, Witkop CJ Jr. Prevalence of
malocclusion in Chippewa Indian children. J Dent Res. 1968 Mar-Apr;47(2):302-5.
10. Helm S. Malocclusion in Danish children with adolescent dentition: an epidemiologic study. Am J Orthod. 1968 May;54(5):352-66.
11. Thilander B, Myrberg N. The prevalence of malocclusion in Swedish schoolchildren. Scand J Dent Res. 1973;81(1):12-21.
12. Foster TD, Day AJ. A survey of malocclusion and the need for orthodontic treatment in a Shropshire school population. Br J Orthod. 1974 Apr;1(3):73-8.
13. Ingervall B, Mohlin B, Thilander B. Prevalence and awareness of malocclusion in Swedish men. Community Dent Oral Epidemiol. 1978 Nov;6(6):308-14.
14. Helm S, Prydso U. Prevalence of malocclusion in medieval and modern Danes contrasted. Scand J Dent Res. 1979 Apr;87(2):91-7.
15. Lee KS CK, Ko JH, Koo CH. Occlusal variations in the posterior and anterior segments of the teeth. Korean J Orthod. 1980;10:70-9. 16. Gardiner JH. An orthodontic survey of Libyan schoolchildren. Br J
Orthod. 1982 Jan;9(1):59-61.
17. Muniz BR. Epidemiology of malocclusion in Argentine children. Community Dent Oral Epidemiol. 1986 Aug;14(4):221-4.
18. Kerosuo H, Laine T, Kerosuo E, Ngassapa D, Honkala E. Occlusion among a group of Tanzanian urban schoolchildren. Community Dent Oral Epidemiol. 1988 Oct;16(5):306-9.
19. Woon KC, Thong YL, Abdul Kadir R. Permanent dentition occlusion in Chinese, Indian and Malay groups in Malaysia. Aust Orthod J. 1989 Mar;11(1):45-8.
20. al-Emran S, Wisth PJ, Boe OE. Prevalence of malocclusion and need for orthodontic treatment in Saudi Arabia. Community Dent Oral Epidemiol. 1990 Oct;18(5):253-5.
21. El-Mangoury NH, Mostafa YA. Epidemiologic panorama of dental occlusion. Angle Orthod. 1990 Fall;60(3):207-14.
REFERENCES
Author’s Contribution (ORCID )
Maged S. Alhammadi (MSA): 0000-0002-1402-0470 Esam Halboub (EH): 0000-0002-1894-470X
Mona Saleh Fayed (MSF): 0000-0001-8124-6587 Amr Labib (AL): 0000-0003-1387-9571
Chrestina El-Saaidi (CES) 0000-0002-3993-9029
22. Lew KK, Foong WC, Loh E. Malocclusion prevalence in an ethnic Chinese population. Aust Dent J. 1993 Dec;38(6):442-9.
23. Tang EL. The prevalence of malocclusion amongst Hong Kong male dental students. Br J Orthod. 1994 Feb;21(1):57-63.
24. Harrison RL, Davis DW. Dental malocclusion in native children of British Columbia, Canada. Community Dent Oral Epidemiol. 1996 June;24(3):217-21.
25. Ng'ang'a PM, Ohito F, Ogaard B, Valderhaug J. The prevalence of malocclusion in 13- to 15-year-old children in Nairobi, Kenya. Acta Odontol Scand. 1996 Apr;54(2):126-30.
26. Ben-Bassat Y, Harari D, Brin I. Occlusal traits in a group of school children in an isolated society in Jerusalem. Br J Orthod. 1997 Aug;24(3):229-35. 27. Proffit WR, Fields HW Jr, Moray LJ. Prevalence of malocclusion and
orthodontic treatment need in the United States: estimates from the NHANES III survey. Int J Adult Orthodon Orthognath Surg. 1998;13(2):97-106.
28. Dacosta OO. The prevalence of malocclusion among a population of northern Nigeria school children. West Afr J Med. 1999 Apr-June;18(2):91-6. 29. Saleh FK. Prevalence of malocclusion in a sample of Lebanese
schoolchildren: an epidemiological study. East Mediterr Health J. 1999 Mar;5(2):337-43.
30. Esa R, Razak IA, Allister JH. Epidemiology of malocclusion and orthodontic treatment need of 12-13-year-old Malaysian schoolchildren. Community Dent Health. 2001 Mar;18(1):31-6.
31. Thilander B, Pena L, Infante C, Parada SS, de Mayorga C. Prevalence of malocclusion and orthodontic treatment need in children and adolescents in Bogota, Colombia. An epidemiological study related to different stages of dental development. Eur J Orthod. 2001 Apr;23(2):153-67.
32. Freitas MR, Freitas DS, Pinherio FH, Freitas KMS. Prevalência das más oclusöes em pacientes inscritos para tratamento ortodôntico na Faculdade de Odontologia de Bauru-USP. Rev Fac Odontol. 2002;10(3):164-9. 33. Bataringaya A. Survey of occlusal trait in an adolescent population in
Uganda. Cabo: University of the Western Cape; 2004.
34. Onyeaso CO. Prevalence of malocclusion among adolescents in Ibadan, Nigeria. Am J Orthod Dentofacial Orthop. 2004 Nov;126(5):604-7. 35. Tausche E, Luck O, Harzer W. Prevalence of malocclusions in the early
mixed dentition and orthodontic treatment need. Eur J Orthod. 2004 June;26(3):237-44.
36. Abu Alhaija ES, Al-Khateeb SN, Al-Nimri KS. Prevalence of malocclusion in 13-15 year-old North Jordanian school children. Community Dent Health. 2005 Dec;22(4):266-71.
37. Ali AH AM. Prevalence of Malocclusion in a Sample of Yemeni
Schoolchildren: an epidemiological study. Abstracts Yemeni Health Med Res. 2005;44:44.
38. Behbehani F, Artun J, Al-Jame B, Kerosuo H. Prevalence and severity of malocclusion in adolescent Kuwaitis. Med Princ Pract. 2005 Nov-Dec;14(6):390-5.
39. Ciuffolo F, Manzoli L, D'Attilio M, Tecco S, Muratore F, Festa F, et al. Prevalence and distribution by gender of occlusal characteristics in a sample of Italian secondary school students: a cross-sectional study. Eur J Orthod. 2005 Dec;27(6):601-6.
40. Karaiskos N, Wiltshire WA, Odlum O, Brothwell D, Hassard TH. Preventive and interceptive orthodontic treatment needs of an inner-city group of 6- and 9-year-old Canadian children. J Can Dent Assoc. 2005 Oct;71(9):649. 41. Ahangar Atashi MH. Prevalence of Malocclusion in 13-15 Year-old
Adolescents in Tabriz. J Dent Res Dent Clin Dent Prospects. 2007 Spring;1(1):13-8.
42. Gelgor IE, Karaman AI, Ercan E. Prevalence of malocclusion among adolescents in central anatolia. Eur J Dent. 2007 July;1(3):125-31. 43. Jonsson T, Arnlaugsson S, Karlsson KO, Ragnarsson B, Arnarson EO,
Magnusson TE. Orthodontic treatment experience and prevalence of malocclusion traits in an Icelandic adult population. Am J Orthod Dentofacial Orthop. 2007 Jan;131(1):8.e11-8.
44. Josefsson E, Bjerklin K, Lindsten R. Malocclusion frequency in Swedish and immigrant adolescents--influence of origin on orthodontic treatment need. Eur J Orthod. 2007 Feb;29(1):79-87.
45. Ajayi EO. Prevalence of Malocclusion among School children in Benin City, Nigeria. J Biomed Res. 2008;7(1-2):58-65.
46. Mtaya M, Astrom AN, Brudvik P. Malocclusion, psycho-social impacts and treatment need: a cross-sectional study of Tanzanian primary school-children. BMC Oral Health. 2008 May 6;8:14.
47. Borzabadi-Farahani A, Borzabadi-Farahani A, Eslamipour F. Malocclusion and occlusal traits in an urban Iranian population. An epidemiological study of 11- to 14-year-old children. Eur J Orthod. 2009 Oct;31(5):477-84.
48. Daniel IB PF, Rogerio G. Prevalência de más oclusões em crianças de 9 a 12 anos de idade da cidade de Nova Friburgo (Rio de Janeiro). Rev Dental Press Ortod Ortop Facial. 2009;14(6):118-24.
49. Sidlauskas A, Lopatiene K. The prevalence of malocclusion among 7-15-year-old Lithuanian schoolchildren. Medicina (Kaunas). 2009;45(2):147-52.
50. Alhammadi M. The prevalence of malocclusion in a group of Yemeni adult population: an epidemiologic study [thesis]. Cairo: Cairo University; 2010.
51. Bhardwaj VK, Veeresha KL, Sharma KR. Prevalence of malocclusion and orthodontic treatment needs among 16 and 17 year-old school-going children in Shimla city, Himachal Pradesh. Indian J Dent Res. 2011 July-Aug;22(4):556-60.
52. Nainani JT, Relan S. Prevalence of Malocclusion in School Children of Nagpur Rural Region - An Epidemiological Study. J Dental Assoc. 2011;5:865-7. 53. Bugaighis I. Prevalence of malocclusion in urban libyan preschool
children. J Orthod Sci. 2013 Apr;2(2):50-4.
54. Kaur H, Pavithra US, Abraham R. Prevalence of malocclusion among adolescents in South Indian population. J Int Soc Prev Community Dent. 2013 July;3(2):97-102.
55. Reddy ER, Manjula M, Sreelakshmi N, Rani ST, Aduri R, Patil BD. Prevalence of Malocclusion among 6 to 10 Year old Nalgonda School Children. J Int Oral Health. 2013 Dec;5(6):49–54.
56. Bilgic F, Gelgor IE, Celebi AA. Malocclusion prevalence and orthodontic treatment need in central Anatolian adolescents compared to European and other nations' adolescents. Dental Press J Orthod. 2015 Nov-Dec;20(6):75-81.
57. Gupta DK, Singh SP, Utreja A, Verma S. Prevalence of malocclusion and assessment of treatment needs in beta-thalassemia major children. Prog Orthod. 2016;17:7.
58. Narayanan RK, Jeseem MT, Kumar TA. Prevalence of Malocclusion among 10-12-year-old Schoolchildren in Kozhikode District, Kerala: An Epidemiological Study. Int J Clin Pediatr Dent. 2016 Jan-Mar;9(1):50-5. 59. Mattheeuws N, Dermaut L, Martens G. Has hypodontia increased in
Caucasians during the 20th century? A meta-analysis. Eur J Orthod. 2004 Feb;26(1):99-103.
60. Polder BJ, Van't Hof MA, Van der Linden FP, Kuijpers-Jagtman AM. A meta-analysis of the prevalence of dental agenesis of permanent teeth. Community Dent Oral Epidemiol. 2004 June;32(3):217-26.
61. Vandenbroucke JP, von Elm E, Altman DG, Gotzsche PC, Mulrow CD, Pocock SJ et al. Strengthening the Reporting of Observational Studies in Epidemiology (STROBE): explanation and elaboration. Int J Surg. 2014;12:1500-24.
62. Kalakonda B, Al-Maweri SA, Al-Shamiri HM, Ijaz A, Gamal S, Dhaifullah E. Is Khat (Catha edulis) chewing a risk factor for periodontal diseases? A systematic review. J Clin Exp Dent. 2017;9:e1264-70.
63. Shibata S, Suda N, Suzuki S, Fukuoka H, Yamashita Y. An in situ hybridization study of Runx2, Osterix, and Sox9 at the onset of condylar cartilage formation in fetal mouse mandible. J Anat. 2006 Feb;208(2):169-77.
64. Hinton RJ. Genes that regulate morphogenesis and growth of the temporomandibular joint: a review. Dev Dyn. 2014 July;243(7):864-74. 65. Newman GV. Prevalence of malocclusion in children six to fourteen
years of age and treatment in preventable cases. J Am Dent Assoc. 1956 May;52(5):566-75.
66. Silva Filho OG, Ferrari Junior FM, Okada Ozawa T. Dental arch dimensions in Class II division 1 malocclusions with mandibular deficiency. Angle Orthod. 2008 May;78(3):466-74.