Alison Jacqueline Pestana Setim
Licenciada em Ciências da Engenharia Química e Bioquímica
Upgrade of an Experimental Volumetric Unit for
Gas Adsorption Equilibrium Studies
Dissertação para obtenção do Grau de Mestre em
Engenharia Química e Bioquímica
Orientador:
Isabel A. A. C. Esteves, Investigadora Auxiliar, FCT/UNL
Co-Orientadores:
José P. B. Mota, Professor Catedrático FCT/UNL
Rui P. P. L. Ribeiro, Investigador Pós-Doutoramento, FCT/UNL
Presidente: Professor Doutor Mário Eusébio
Arguente: Doutora Inês do Nascimento Matos
Vogal: Doutor Rui P. P. L. Ribeiro
Alison Jacqueline Pestana Setim
Licenciada em Ciências da Engenharia Química e Bioquímica
Upgrade of an Experimental Volumetric Unit for
Gas Adsorption Equilibrium Studies
Dissertação para obtenção do Grau de Mestre em
Engenharia Química e Bioquímica
Orientador:
Isabel Esteves, Investigadora Auxiliar, FCT/UNL
Co-Orientadores:
José P. B. Mota, Professor Catedrático FCT/UNL
Rui P. P. L. Ribeiro, Investigador Pós-Doutoramento, FCT/UNL
Presidente: Professor Doutor Mário Eusébio
Arguente: Doutora Inês do Nascimento Matos
Vogal: Doutor Rui P. P. L. Ribeiro
“Copyright” Alison Jacqueline Pestana Setim, FCT/UNL e UNL
Agradecimentos
A elaboração desta tese de mestrado não seria possível sem o esforço contínuo na sua construção mas também sem a colaboração e ajuda que recebi. Desta forma gostaria de agradecer, em primeiro lugar, aos meus orientadores, Doutora Isabel Esteves e Doutor Rui Ribeiro, que se disponibilizaram para me orientar durante a tese de mestrado. Pelo profissionalismo, pelos conhecimentos transmitidos, colaboração, preocupação, paciência e disponibilidade para ajudar.
Agradeço a todas as pessoas do grupo de investigação pela forma como fui recebida, pela atenção e disponibilidade. Em especial ao Professor Doutor Paulo Mota, pelo exemplo de competência científica e a Bárbara Camacho pela disponibilidade, apoio e paciência que demonstrou ao longo destes seis meses.
Gostaria também de agradecer à Faculdade de Ciências e Tecnologias – Universidade Nova de Lisboa pelas condições de trabalho que ao longo destes anos proporcionou, possibilitando a concretização de este Mestrado.
Um agradecimento muito especial à Ana Cristina Dias pela enorme amizade, carinho, confiança e incondicional apoio que sempre demonstrou.
Abstract
In this work, a volumetric unit previously assembled by the research group was upgraded. This unit revamping was necessary due to the malfunction of the solenoid valves employed in the original experimental setup, which were not sealing the gas properly leading to erroneous adsorption equilibrium measurements. Therefore, the solenoid valves were substituted by manual ball valves.
After the volumetric unit improvement its operation was validated. For this purpose, the adsorption equilibrium of carbon dioxide (CO2) at 323K and 0 - 20 bar was measured on two different
activated carbon samples, in the of extrudates (ANG6) and of a honeycomb monolith (ACHM). The adsorption equilibrium results were compared with data previously measured by the research group, using a high-pressure microbalance from Rubotherm GmbH (Germany) – gravimetric. The results obtained using both apparatuses are coincident thus validating the good operation of the volumetric unit upgraded in this work.
Furthermore, the adsorption equilibrium of CO2 at 303K and 0 - 10 bar on Metal-Organic
Frameworks (MOFs) Cu-BTC and Fe-BTC was also studied. The CO2 adsorption equilibrium results
for both MOFs were compared with the literature results showing good agreement, which confirms the good quality of the experimental results obtained in the new volumetric unit. Cu-BTC sample showed significantly higher CO2 adsorption capacity when compared with the Fe-BTC sample.
The revamping of the volumetric unit included a new valve configuration in order to allow testing an alternative method for the measurement of adsorption equilibrium. This new method was employed to measure the adsorption equilibrium of CO2 on ANG6 and ACHM at 303, 323 and 353K within 0-10
bar. The good quality of the obtained experimental data was testified by comparison with data previously obtained by the research group in a gravimetric apparatus.
Resumo
Neste trabalho a unidade volumétrica previamente desenhada e construída pelo grupo de investigação foi modificada. Esta alteração foi necessária devido a problemas de operação válvulas automáticas utilizadas na unidade original, visto que as mesmas não garantiam o completo controlo do gás levando a problemas na determinação de dados de equilíbrio de adsorção. Desta forma, as válvulas automáticas foram substituídas por válvulas de bola de operação manual.
Após a alteração da unidade volumétrica, o seu foi validado. Para tal, o equilíbrio de adsorção de dióxido de carbono (CO2) a 323K e 0 -10 bar foi medido em duas amostras de carvão activado, na
forma de extrudados (ANG6) e monólito tipo favo-de-mel (ACHM). Os dados de equilíbrio de adsorção obtidos foram comparados com dados previamente obtidos pelo grupo de investigação utilizando uma microbalança de alta precisão para medição a alta pressão da Rubotherm GmbH (Alemanha) – método gravimétrico. Os resultados obtidos utilizando as duas instalações são coincidentes, validando o bom funcionamento da unidade volumétrica alterada neste trabalho.
Adicionalmente, o equilíbrio de adsorção de CO2 a 303K e 0 - 10 bar em dois metal-organic
frameworks, Cu-BTC e Fe-BTC foi também estudado. Os resultados de equilíbrio de adsorção de CO2
em ambos os MOFs foram comparados com os dados de literatura mostrando boa coincidência, o que confirma a boa qualidade dos resultados experimentais obtidos na nova instalação volumétrica. A amostra de Cu-BTC mostrou uma capacidade significativamente mais alta para adsorção de CO2 do
que a amostra de Fe-BTC.
A alteração da unidade volumétrica incluiu uma modificação da configuração de válvulas, de modo a permitir testar um método alternativo para a medição de equilíbrios de adsorção. Este novo método foi utilizado na medição do equilíbrio de adsorção de CO2 em ANG6 e ACHM a 303, 323 e
353K entre 0 - 10 bar. A boa qualidade dos resultados experimentais foi confirmada por comparação com dados obtidos pelo grupo na instalação gravimétrica.
List of Contents
AGRADECIMENTOS ... VII
ABSTRACT ... IX
RESUMO ... XI
LIST OF TABLES ...XVII
CHAPTER I ... 1
1. INTRODUCTION ... 1
1.1. MOTIVATION ... 1
1.2. STRUCTURE OF THE THESIS ... 2
2. BACKGROUND ... 3
2.1. ADSORPTION PHENOMENA ... 3
2.2. ADSORPTION EQUILIBRIUM:ISOTHERMS ... 4
2.3. ADSORBENT MATERIALS:GENERAL CONCEPTS ... 6
2.4. ADSORPTION EQUILIBRIUM MEASUREMENT:EXPERIMENTAL METHODS... 9
2.4.1. Gravimetric Method ... 9
2.4.2. Volumetric / Manometric Method ... 10
2.5. SUMMARY ... 11
CHAPTER III ... 13
3. VOLUMETRIC UNIT: UPGRADE, CALIBRATION AND VALIDATION ... 13
3.1. EXPERIMENTAL ... 13
3.1.1. Apparatus Description ... 13
3.1.2. Materials ... 15
3.2. THEORY ... 16
3.3. EXPERIMENTAL RESULTS AND DISCUSSION ... 17
3.4. VOLUMETRIC UNIT UPGRADE ... 19
3.4.1. Volumetric Unit Upgraded: Reference and Cell Volume Calibration ... 21
3.5. VALIDATION OF THE UPGRADED VOLUMETRIC UNIT ... 26
3.6. ADSORPTION EQUILIBRIUM OF CO2ON METAL-ORGANIC FRAMEWORKS CU-BTC AND FE-BTC ... 29
3.7. SUMMARY ... 33
CHAPTER IV ... 35
4. ALTERNATIVE VOLUMETRIC METHOD FOR ADSORPTION EQUILIBRIUM DETERMINATION ... 35
XIV
4.2. EXPERIMENTAL RESULTS AND DISCUSSION ... 37
4.3. SUMMARY ... 40
CHAPTER V ... 41
5. CONCLUSIONS AND FUTURE WORK ... 41
BIBLIOGRAPHY ... 43
APPENDIX ... 51
APPENDIX A – EXPERIMENTAL ETHANE (C2H6) ADSORPTION EQUILIBRIUM DATA ON THE CARBON SAMPLE ANGUARD5 AT 303, 323 AND 373K. SEVEN EXPERIMENTAL POINTS WERE MEASURED. ... 51
APPENDIX B – EXPERIMENTAL ETHANE (C2H6) ADSORPTION EQUILIBRIUM DATA ON THE MOF SAMPLE MIL-53 (AL) AT 303, 323 AND 373K. SEVEN EXPERIMENTAL POINTS WERE MEASURED. ... 51
APPENDIX C – EXPERIMENTAL CARBON DIOXIDE (CO2) ADSORPTION EQUILIBRIUM DATA ON THE CARBON SAMPLE ANGUARD6 AT 323K. NINE EXPERIMENTAL POINTS WERE MEASURED. ... 52
APPENDIX D – EXPERIMENTAL CARBON DIOXIDE (CO2) ADSORPTION EQUILIBRIUM DATA ON THE CARBON SAMPLE ACHM HONEYCOMB MONOLITH AT 323K. NINE EXPERIMENTAL POINTS WERE MEASURED. ... 52
APPENDIX E – EXPERIMENTAL CARBON DIOXIDE (CO2) ADSORPTION EQUILIBRIUM DATA ON THE MOF SAMPLE FE-BTC AT 303K. SEVEN POINTS WERE MEASURED ... 53
APPENDIX F – EXPERIMENTAL CARBON DIOXIDE (CO2) ADSORPTION EQUILIBRIUM DATA ON THE MOF SAMPLE CU-BTC AT 303K. ... 53
List of Figures
Figure 2.1 - IUPAC classification for adsorption isotherms [9] ... 5
Figure 2.2 - Structure of Cu-BTC metal organic framework [45]. ... 8
Figure 2.3 - Experimental setup for gravimetric measurements of pure gas adsorption equilibria [15] .. 9
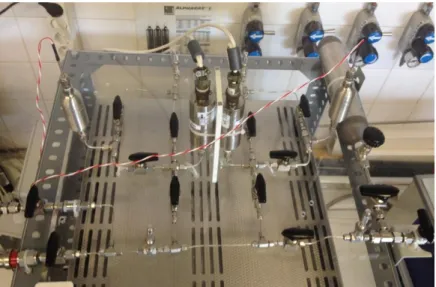
Figure 3.1 - General view of the original volumetric unit ... 14
Figure 3.2 – Schematic representation of the original volumetric unit. The green section represents the reference volume (Vref); PT denote the pressure transducers and V denote the valves and T the Pt100 sensors. ... 14
Figure 3.3 – Single-component adsorption equilibrium isotherms for ethane at 303K, 323K and 373K on ANG5. Solid lines are a guide-to-the-eye. ... 17
Figure 3.4 - Single-component adsorption equilibrium isotherms for ethane at 303K, 323K and 373K on MIL-53(Al). Solid lines are a guide-to-the-eye. ... 18
Figure 3.5 - Single-component adsorption equilibrium isotherms for ethane at 303K, 323K and 353K on MIL-53(Al). Filled plots denote the experimental data obtained previously by Gravimetry by the research group [73]; empty plots denote the volumetric results obtained in this work. Solid lines are a guide-to-the-eye. ... 19
Figure 3.6 - General view of the upgraded volumetric unit ... 20
Figure 3.7 - Detail of the volumetric unit main section ... 20
Figure 3.8 - Schematic representation of the upgraded volumetric unit. The green section represents the reference volume (Vref); PT denote the pressure transducers, V the valves, and T the Pt100 sensor. ... 21
Figure 3.9 - Schematic representation of the first step of the volumes calibration. ... 22
Figure 3.10 - Schematic representation of the second step in the volume calibration. ... 22
Figure 3.11 - Schematic representation of the third step in the volumes calibration. This step permits the determination of the volume of the green section, VA. ... 23
Figure 3.12 - Schematic representation of the fourth step of the volume calibration. This step permits the determination of the volume of the green section, VB. ... 24
Figure 3.13 - Schematic representation of the fifth step of the volume calibration. ... 25
Figure 3.14 - Schematic representation of the sixth step of the volume calibration... 25
Figure 3.15 – Single-component adsorption equilibrium isotherm for CO2 at 323K on ANG6. ... 27
Figure 3.16 - Single-component adsorption equilibrium isotherm for CO2 at 323K on ACHM monolith. ... 28
Figure 3.17 - Single-component adsorption equilibrium isotherm for CO2 at 323K on ANG 6. Comparison between the gravimetric and volumetric data. ... 28
Figure 3.18 - Single-component adsorption equilibrium isotherm for CO2 at 323K on ACHM monolith. Comparison between the gravimetric and volumetric data. ... 29
XVI
Figure 3.20 - Single-component adsorption equilibrium isotherm for CO2 at 303K on Cu-BTC. ... 31
Figure 3.21 – Single-component adsorption equilibrium isotherm of CO2 at 303K on Fe-BTC.
Comparison with the Deniz and co-workers data [85]. ... 32 Figure 3.22 - Single-component adsorption equilibrium isotherm of CO2 at 303K on Cu-BTC-
Comparison with the Grajciar and co-workers data [89]. ... 32 Figure 4.1 - Schematic representation of the first step of measurement in the volumetric unit. Green represents the reference volume (Vref). ... 35
Figure 4.2 - Schematic representation of the second step in the volumetric unit. Green represents the
reference volume (V’ref). ... 36 Figure 4.3 – Experimental Pressure History at PT1 during Temperature Raise from 303K to 323K. ... 37 Figure 4.4 – Experimental Single - Component Adsorption Equilibrium of CO2 on ANG 6 at 303K,
323K and 353K. Each color set represents the results for each constant gas amount fed subjected to the temperature variations. ... 38 Figure 4.5 - Experimental Single - Component Adsorption of CO2 in ACHM at 303K, 323K and 353K. Each set of color represent the results for a single point of pressure. ... 38 Figure 4.6 – (A) Adsorption isotherms of CO2 at 303K, 323K and 353K on ANG6. Close symbols
denote the gravimetric adsorption data and empty symbols denote the volumetric adsorption data. (B) Represent the experimental results in a logarithm scale. ... 39 Figure 4.7 - (A) Adsorption isotherms of CO2 at 303K, 323K and 353K on ACHM. Close symbols
List of Tables
Table 2.1 – IUPAC pore size classification [16]: ... 6
Table 2.2 - Advantages and disadvantages of the volumetric method used to measure adsorption equilibria data [10] ... 10
Table 3.1 – Upgraded volumetric unit calibrated volumes ... 26
Table 3.2 - Adsorbents main characteristics [72] ... 26
Table 3.3 – Physical properties of the adsorbents Cu-BTC and Fe-BTC ... 30
Chapter I
1. Introduction
1.1. Motivation
With the rapid increasing of the global population and industrialization, the consumption of energy from combustion of fossil fuels is dramatically growing. The current dependence on fossil fuels, as a primary source of energy, relies to the inherent energy density, abundance, and also on economic factors [1, 2]. Even though, the fossil fuels play an important role in power generation and industrial manufacturing, their combustion releases a large amount of CO2 into the contributing to the
greenhouse effect [2]. The CO2 concentration in the atmosphere, nowadays, is close to 400 ppm
which is significantly higher than the pre-industrial level of about 300 ppm [3].
The primary sources of anthropogenic greenhouse gas emissions, like CO2, are referenced by
the Inventory of U.S Greenhouse Gas Emissions and Sinks. Electricity production (32%), transportation (28%) and industry (20%) are the sectors that most contribute to the emissions of carbon dioxide to the atmosphere [4].
In addition to the efforts to reduce energy consumption and develop renewable energy sources, CO2 capture and storage (CSS) emerge as an option. Therefore, important research work on efficient
technologies to capture CO2 has been done recently [5, 6]. According to the Intergovernmental Panel
on Climate Change (IPCC) [1], the emissions of CO2 to the atmosphere can be reduced by
approximately 80-90% for a modern power plant that is equipped with suitable carbon dioxide capture and storage (CCS) technologies.
CO2 capture can be performed in three different routes: pre-combustion, oxyfuel and
post-combustion [7]. Post-post-combustion CO2 capture involves a gas separation process of the industrial
combustion effluents. Various technologies have been studied for this application including physical absorption, chemical absorption, and membranes and also, adsorption processes [8]. There are many studies of CO2 separation and storage using solid adsorption processes and a variety of solid
adsorbent have been proposed due to their properties including surface area, pore volume, pore size distribution, regeneration procedure and cost. The extensive list of studied adsorbents for CO2 capture
includes zeolites [9], activated carbons [10] and more recently, metal organic frameworks (MOFs) [2] [11]. The knowledge of CO2 adsorption equilibrium and the chosen adsorbent is of paramount
importance for the design of an efficient adsorption-based separation processes for CCS, such as Pressure Swing Adsorption (PSA) and Temperature Swing Adsorption (TSA) [12,13].
In this work, an in-house developed volumetric unit for the measurement of adsorption equilibrium was upgraded. The new experimental unit was validated by measuring the adsorption equilibrium of CO2 on two different carbon-based adsorbents and two MOFs between 303 and 373K and 0 - 10 bar.
2
research group in high-precision gravimetric unit, to testify its good quality. Furthermore, a new alternative method for volumetric adsorption equilibrium measurements was tested and the obtained results confirmed the feasibility of the new procedure.
1.2. Structure of the Thesis
Besides this introductory chapter, this thesis is structured with the following contents:
Chapter II: Background
In this chapter the theoretical fundamentals regarding the adsorption phenomena are discussed and the latest developments that have been made in this research field are reviewed. A brief description of the adsorbents, activated carbons and metal-organic frameworks, studied in this thesis is also presented.
Chapter III: Volumetric Unit Upgrade, Calibration and Validation
This chapter presents the experimental procedure for the volumetric unit previously built by the research group, as well as the experimental test results obtained. The upgrade of the volumetric unit is also described with detail. The experimental adsorption equilibrium measurements results of CO2 on
ANG6 and ACHM activated carbon samples obtained using the upgraded apparatus are also presented. These results were successfully compared with gravimetrically obtained data, validating the good functioning of the unit. Adsorption equilibrium of CO2 over Cu-BTC and Fe-BTC was also
measured and is reported in this chapter.
Chapter IV: Alternative Volumetric Method for Adsorption Equilibrium Determination
In this chapter, an alternative method for the measurement of adsorption equilibrium using the revamped volumetric apparatus is explained and the experimental procedure is described. The experimentally obtained results for the adsorption equilibrium measurement of CO2 on ANG6 carbon
and ACHM at 303, 323 and 353K and 0 - 10 bar are reported. A comparison between the volumetric and gravimetric experimental data results is also presented.
Chapter V: Conclusions and Future Work
Chapter II
2. Background
In this chapter the main concepts regarding the adsorption phenomena, including adsorption equilibrium isotherms theory, are discussed. The theoretical background of the traditional experimental method employed in this work is discussed, and an alternative method is presented. Finally, the fundamentals of the adsorbent materials tested within this work are also presented.
2.1. Adsorption Phenomena
Adsorption is an exothermic phenomenon and it corresponds to the enrichment of one or more of the components of a fluid phase in the interface region with a solid surface [14]. This phenomenon is different from absorption, in which the species diffuse into a liquid or solid and is, therefore, taken up by volume; in contrast, adsorption is a surface phenomenon [15]. In adsorption processes, porous solids are commonly employed as adsorbents to ensure a large superficial area and microporous volume which allow good adsorption capacities [16].
Adsorbate molecules accumulate onto the surface of the adsorbent until its adsorption capacity is achieved and the equilibrium at the thermodynamic conditions under study is reached. Adsorption applications range many industrial levels for gas separation, storage or purification processes, characterization of porous materials, and others [14, 15].
Depending on how the adsorbed molecules interact with the solid two phenomena can be distinguished: chemisorption and physisorption. In physisorption the adsorbate-adsorbent interactions are weaker than the chemical bonds which characterize chemisorption. Therefore, when dealing with physisorption the adsorbates can generally be released (desorbed) by increasing the temperature or reducing the partial pressure of the adsorbates in the gas phase [17]. On the other hand, in chemisorption sorbent regeneration is more energy intensive and frequently cannot occur without changing the adsorbent properties [18].
When the adsorption phenomena starts, the adsorbent material possesses a large number of active sites, and the number of molecules adhering to the adsorbent surface (i.e. being adsorbed) exceeds the number of molecules leaving the surface (i.e. being desorbed) [15]. As the surface becomes covered with the adsorbates, the probability of an adsorbate molecule to find an available site decreases. The equilibrium state is reached when the rate of adsorption equals the rate of desorption [19]. The amount of gas retained by the adsorbent, after reaching the equilibrium, defines the adsorption capacity of the adsorbent towards a specific adsorbate.
4
combustion of fossil fuels [23], biogas upgrading [24, 25], capture and recovery of volatile organic
compounds (VOC’s) [26] and others.
Cycle engineering is of the great importance in the development of continuous adsorption-based separation processes, but the adsorbent properties and its interaction with the adsorbed species are also of great importance. For this purpose, it is extremely important to study the adsorption equilibrium data of the adsorbates over the adsorbent materials involved in a specific process. The adsorption equilibria data is normally presented as adsorption isotherms which give the relation, at constant temperature, between the amount adsorbed and the equilibrium pressure, or concentration. Although adsorption isotherms are the most commonly type of graphical presentation of equilibrium data there are others options like isobars, which present the amount adsorbed by temperature at constant pressure, and isosteres which relate the equilibrium pressure with temperature for a constant amount adsorbed [27].
2.2. Adsorption Equilibrium: Isotherms
Adsorption isotherms describe the amount of adsorbate retained on the adsorbent surface as a function of pressure (if gas) or concentration, at constant temperature, and also give information about the characteristics of the adsorbent employed. The adsorption isotherm describes the equilibrium between the fluid-phase concentration and the concentration in the adsorbent particles, at a given temperature. The quantity adsorbed is commonly normalized by the mass of the adsorbent to allow comparison between different materials [14] [28].
Figure 2.1 - IUPAC classification for adsorption isotherms [9]
Type I isotherms are characteristic for microporous materials. The interactions between the solid surface and the gas molecules result in an increase in adsorption, especially at low pressures. These isotherms, also known as Langmuir Type isotherms, are thus characterized by a plateau that is almost parallel to the pressure axis [17] [27].
Type II isotherms typically describe adsorption in mesoporous adsorbents, non-porous surfaces and some compacted powders. This type of isotherms occurs due to monolayer adsorption at low pressures followed by multilayer adsorption, at higher pressures. The point B (in Figure 2.1 II) represents the starting point of multilayer adsorption and the ending of the monolayer section. These isotherms can be described by the BET equation or its generalizations [15] [17].
Type III isotherms are very uncommon and are characterized by their convex behaviorrelatively to the pressure axis. This feature is indicative of weak adsorbent – adsorbate interactions. [14]
Type IV isotherms are similar to type II isotherms and are characteristics of monolayer – multilayer adsorption as well. In this case the main difference is the presence of hysteresis which is associated with capillary condensation taking place in mesopores [17] [27].
Type V isotherms are given by mesoporous and microporous solids and very similar to type III. They both present a convex behavior along the axis of relative pressure but the relevant difference between them is the occurrence of two inflection points and hysteresis [17].
Type VI isotherms are also rare and are associated with layer to layer adsorption on a highly uniform non-porous surface. The sharpness of the steps is conditioned by the system and temperature. The height of each step is related to the adsorption capacity of each layer [14] [17].
6 2.3. Adsorbent Materials: General Concepts
Adsorbents are porous solid materials with a high surface area capable of adsorbing molecules from liquids or gases, and may be classified according to their pores average diameter [29]. The classification of pore size according to IUPAC is often used to characterize the material [16] as shown in Table 2.1.:
Table 2.1 – IUPAC pore size classification [16]:
Adsorbent Characterization
Microporous adsorbents d < 2 nm Mesoporous adsorbents 2 < d < 50 nm
Macroporous adsorbents d > 50 nm
The adsorbent material plays an important role in adsorption processes since the effectiveness of both equilibrium and kinetics of adsorption are dependent on the properties of the solid and the adsorbate species.
The selection of an efficient adsorbent for a specific application must consider the adsorption equilibrium and kinetics properties of all constituents in the gas mixture, within the pressure and temperature range of operation. Considering a binary mixture, its separation can be promoted due to different adsorption capacity of the adsorbent towards each species (equilibrium separation) or, on the other hand, due to significant differences in the kinetics of each component (kinetic separation) [16].
An effective adsorbent is the one that is easily regenerated and present the perfect combination between adsorption capacity and kinetics [30]. In order to meet these requirements, the following aspects must be taken into account [16]:
a) The solid must have reasonably large surface area and/or a considerable micropore volume;
b) The solid must have relatively large pore network for the transport of molecules to the micropores.
Although there are many adsorbents to choose from, the research and development of enhanced adsorbents can improve the performance of current adsorption processes. The development of such adsorbents is also important to extend the use of adsorption processes to other applications.
Activated carbons are produced starting with the original pores present in the raw material and more porosity, with desired size distributions, is created by the activation process which can be by two different methods: gas and chemical [30].
Activated carbons have the advantage of being available at low prices and being produced in several morphologies (beds, pellets, monoliths, fibers and others) [30], [35], [36]. In this work, the adsorption equilibrium of CO2, between 303 -373K and 0 – 10 bar, on two activated carbons, including
pelletized carbon and a honeycomb monolith was studied.
There are also other important adsorbents like silica gel, zeolites and more recent metal organic frameworks (MOFs). Silica Gel has the appearance of a hard glassy substance, is milky white in color and it is made from the coagulation of a colloidal solution of silicic acid [30]. This adsorbent is used in most industries because of its desiccant properties being useful in water removal processes [37, 38] and gas drying [39]. Depending on the synthesis procedure silica gel can have a surface area between 200 m2/g and 900 m2/g [16].
Zeolites are crystalline aluminosilicates of alkali or alkali-earth elements, such as sodium, potassium and calcium. Like activated carbons, zeolites are commonly used as adsorbents. These materials occur naturally or be synthetized in many types (A, X, Y, modernite, ZSM, etc.) [16]. The major use of zeolites is in petrochemical cracking, ion exchange (water softening and purification), and in the separation and removal of gases and solvents [30].
More recently a new class of materials, metal organic frameworks (MOFs), also known as porous coordination materials, has been gaining importance. MOFs are highly crystalline inorganic-organic materials that are formed by assembling metal-containing clusters known as building units with multidentate organic ligands (such as carboxylates, tetrazolates, sulfonates) by coordination bonds [40, 41]. Due to their chemical and thermal stability, permanent porosity and high surface area, MOFs are considered adsorbents of great potential in the chemical industry namely for H2 storage
applications [40], CO2 capture [42], drug delivery [41], catalytic processes [43] and other applications.
The functionalization of the organic component of the framework, or the incorporation of functional organic groups directly into the framework, may yield porous solids that contain different groups enhancing its more selectivity [42]. The increasing interest on more efficient adsorbents has motivated the synthesis of more MOF structures and, consequently, this has become a field of interest for research and development purposes [44].
In this work, the adsorption equilibrium of CO2 at 303-373K and 0-10 bar over three MOF
samples, MIL-53(Al), Cu-BTC and Fe-BTC was studied.
a) MIL-53(Al) MOF
8
adsorbate molecules, the lp phase is the most stable form. However, during gas adsorption, the lp phase becomes np at low pressures and inverse transformations occurs at higher pressures [45 - 47].
b) Cu-BTC MOF
Cu-BTC is one of the most studied MOFs for gas adsorption presenting a potential interest for separation of polar and non-polar species [48]. Cu-BTC [Cu3 (BTC), BTC= 1,2,3-benzenetricarboxylate], also known as HKUST-1, is commercially available by the trade mark of Basolite C300TM synthesized by BASF SE (Germany) with a surface area between 1500 and 2100 m2/g [49]. This MOF, has a unique structure with a Cu based center and corners linked by BTC linkers. This configuration gives the material a multiple pore characteristic and adsorption sites that improve adsorption process [50].
Figure 2.2 - Structure of Cu-BTC metal organic framework [45].
Figure 2.2 the CU-BTC structure is represented showing the BTC molecules forming an octahedral shape in the corners. Each corner contains two copper atoms that are bonded to the oxygen atoms of four BTC linkers forming four-connected square-planar vertexes [51]. The remaining axial coordination sites, usually referred to as open metal sites are stable after exposure to liquid water. This is particularly important to improve adsorption selectivity for separating mixtures with molecules of different polarities especially at low pressures [51, 52]
This MOF has been largely used as an adsorbent for various applications such as biogas upgrading [53], adsorption of organosulfur compounds [54, 55], gas storage, separation and purification [50] [56 – 58] and others.
c) Fe-BTC MOF
Fe-BTC is a new MOF adsorbent with potential interest in chemical, biomedical and biochemical industries [59]. This iron based MOF is commercially available by the name of BasoliteTM F300 synthesized by BASF SE (Germany) with a surface area between 1300 and 1600 m2/g [60].
by microporous windows [59]. Even though the reported surface area of Fe-BTC is smaller than MIL-100 one, the specific area of Fe-BTC is still larger and it is reasonable to assume that Fe-BTC should display most of the characteristics features of MIL-100 [61]. Unlike MIL-100(Fe) there are not many studies of Fe-BTC as an adsorbent material published in the actual literature [62 – 64].
2.4. Adsorption Equilibrium Measurement: Experimental Methods
Adsorption equilibrium of gaseous compounds can be measured employing different methods. In this section, the two most widely used methods (gravimetric and volumetric) are described.
2.4.1. Gravimetric Method
The gravimetric method is a method which evaluates the adsorption equilibrium of gases in porous solids by mass weighting. This is a relatively simple method in which a certain amount of gas is brought into contact with an adsorbent sample while the pressure, temperature and mass increase of the sample are monitored and recorded. Although the principle is quite simple, the design and construction of a gravimetric apparatus is not straightforward. The adsorbent containing vessel is usually a conventional metal system, but the balance must have a very high-precision [65].
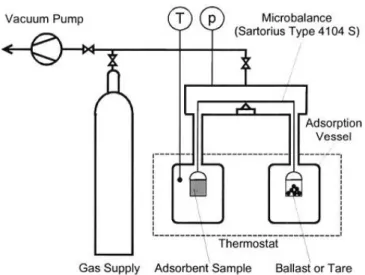
Figure 2.3 shows a simple gravimetric experimental setup. The experimental procedure usually starts by placing a sample of the adsorbent material in the adsorption vessel followed by the sample activation which can be performed by evacuation, heating and flushing with helium [15] [66]. Helium is used for this purpose because it can be considered a non-adsorptive gas at atmospheric pressure and room temperature [15], [67].
Figure 2.3 - Experimental setup for gravimetric measurements of pure gas adsorption equilibria [15]
10
mass and the pressure measurements remain constant at the temperature of the experiment [68]. This method presents the advantage of being significantly more accurate than the volumetric method.
2.4.2. Volumetric / Manometric Method
The volumetric method, also known as manometric method, is the oldest technique used in the measurement of gas-phase adsorption equilibrium. This method consists in an indirect measurement of the amount adsorbed and despite being less precise than gravimetric method it can give accurate results when using suitable equipment and procedures [66].
A volumetric adsorption equilibrium experiment consists in feeding an amount of adsorptive gas into a calibrated volume. Then, the gas stored in the calibrated volume is expanded into a cell containing the previously activated (as in the gravimetric method) adsorbent material. Adsorption takes place and a fraction of the gas is adsorbed on the adsorbent surface, while another fraction remains in the gas-phase. The amount of adsorbed gas can then be calculated by a mass balance considering the gas-phase before and after adsorption. For this procedure, both volumes (calibrated and adsorbent cell volumes) must be previously known [66] [15].
The volumetric method is an efficient technique for measurement of adsorption equilibrium isotherms. This method presents the advantages of being easier to implement and less expensive than the gravimetric method. On the other hand, the significant disadvantage of the method are the experimental errors caused by indirect determination of the adsorbed amount of gas [66], and the consecutive expansions of the adsorptive which is reflected in the accumulation of even more experimental errors. In contrast, the gravimetric method errors are not cumulative and are only dependent of the measuring equipment. In order to obtain the desired adsorption equilibrium isotherm, the procedure has to be repeated as many times as the amount of points desired since each assay to only one point of the isotherm. Table 2.2 summarizes the principal advantages and disadvantages of the volumetric method employed in the measurement of adsorption equilibria.
Table 2.2 - Advantages and disadvantages of the volumetric method used to measure adsorption
equilibria data [10]
Volumetric Method: Advantages and Disadvantages
Advantages
It is simple, easy to implement and do not require complex and expensive technology.
In this work, the described traditional volumetric method for the determination of adsorption equilibrium data is employed. Furthermore, an alternative method for adsorption equilibrium measurements with the volumetric unit is presented. This method is similar do the one described but instead of measuring adsorption equilibria at constant temperature, the gas amount inside the adsorption chamber is maintained constant and the temperature is changed. The experimental procedure will be explained with detail in Chapter 4.
The principal advantage of this non-conventional method is that enables the user to measure three adsorption isotherms by varying the temperature. Also, there is no need for adsorbent re-activation of the samples between isotherms introducing less experimental error.
2.5. Summary
In this chapter the theoretical fundamentals regarding the adsorption phenomena were discussed and the latest developments that have been made in this research field are reviewed. A brief description of the adsorbents, activated carbons and metal-organic frameworks, studied in this thesis is also presented.
The interest in the knowledge of the properties of pure gases is strictly linked to the objective of performing their purification and separation from different gas streams. The knowledge of CO2
adsorption equilibrium, in particular, and the chosen adsorbent is of paramount importance for the design of an efficient adsorption-based separation processes for CCS, such as Pressure Swing Adsorption (PSA) and Temperature Swing Adsorption (TSA) [12, 13].
Disadvantages
Traditionally, in volumetric adsorption equilibrium measurements adsorbent degassing is not performed between each isotherm point determined. For this reason, the experimental error is cumulative for each point (i.e. the error of the previously measured point must be taken into account in the forthcoming point.
Chapter III
3. Volumetric Unit: Upgrade, Calibration and Validation
A recent home-made volumetric unit was the starting point of this thesis [69]. The work that was recently developed with this apparatus revealed several drawbacks. Therefore, an upgrading of the existing volumetric equipment, its subsequent calibration and experimental validation were required and are presented in this work.
The original volumetric unit was employed to study the adsorption equilibrium of ethane over two adsorbents: an activated carbon, ANGUARD 5 (ANG5) and the metal organic framework MIL-53(Al), both materials previously studied and characterized by the group [45][70
– 73]. During these adsorption studies it was confirmed that the solenoid valves used in the original volumetric unit could not properly seal the gas in the desired section within all the pressure range employed in the experimental procedure.
Due to the confirmation of this valve malfunction, changes in the volumetric unit had to be performed. During this re-arrangement the experimental unit was also upgraded in order to allow testing an alternative method for the measurement of adsorption equilibria. This method is described in detail, in Chapter 4.
In this chapter the results obtained in the previously built unit regarding the adsorption equilibrium of ethane in the MIL-53(Al) and ANG5 at 303, 323 and 373K within 0-20bar are presented and compared with data previously measured by the research group, using a high-pressure microbalance from Rubotherm GmbH (Germany) – gravimetric method.
After the volumetric unit improvement its operation was validated. For this purpose, the adsorption equilibrium of carbon dioxide (CO2) at 323K and 0 - 20 bar were measured on two
different activated carbon samples, in the of extrudates (ANG6) and of a honeycomb monolith (ACHM) and the results were compared with data previously measured by gravimetry in our group. Furthermore, the adsorption equilibrium of CO2 at 303K and 0 - 10 bar on Metal-Organic
Frameworks (MOFs) Cu-BTC and Fe-BTC was also studied.
3.1. Experimental
3.1.1. Apparatus Description
14
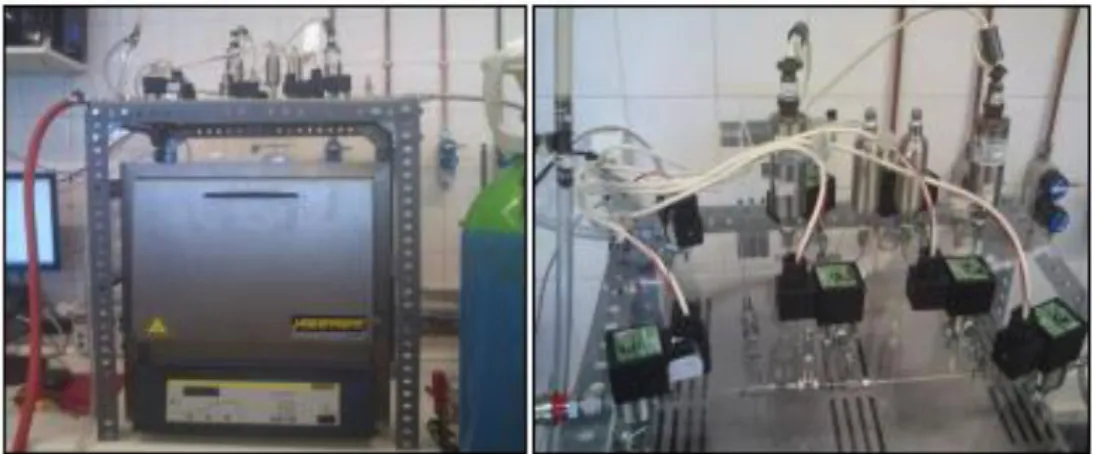
pressure transducers (Omega Eng. Inc., USA) measure the operation pressure in the range of 0 to 20 bar with an uncertainty of 0.05% of the Full Scale (FS); The apparatus includes two stainless steel (SS) vessels (Swagelok, USA) of 40 cm3 of volume each, used to obtain a certain reference volume (Vref); Two Pt-100 probes (RS Amidata, Spain), placed inside of each
reference volume, measuring the temperature of that unit section, while an oven (Nabertherm B170 GmbH, Germany) with a temperature range of 303K to 1373K enclosed the two sample cells at a constant temperature. Figure 3.1 and 3.2 presents the general view of the original volumetric unit, and a schematic of the volumetric unit originally built [69], respectively. The auxiliary volume is a known volume used only for calibration.
Figure 3.1 - General view of the original volumetric unit
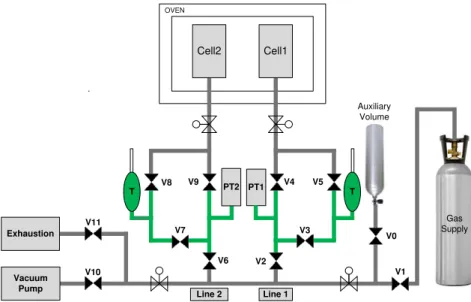
Line 1 Line 2 Vacuum Pump Exhaustion PT1 PT2 Cell1 Cell2 OVEN V1 V3 V5 V4 V6 V8 V7 V2 V0 Auxiliary Volume Gas Supply T T
Figure 3.2 – Schematic representation of the original volumetric unit. The green section represents
the reference volume (Vref); PT denote the pressure transducers and V denote the valves and T the
The adsorption equilibrium measurements using the volumetric unit follow a standard procedure [15] [30] [74, 75]. The calibration of the reference and cell volumes of the original volumetric unit was previously done by the research group [69].
Prior to adsorption measurements it is important to ensure the absence of leaks. For this purpose helium is fed into the unit and pressure variations are monitored. Helium is generally used for this method considering the assumption that it does not adsorb at low pressure and ambient temperature [15] [67]. In these conditions if the pressure drops, the presence of leaks must be considered and repaired. After ensuring the absence of leaks in the system, the gas is fed into the reference volume presented in Figure 3.2 (green section) by opening the valves V1, V2, V3 and V5 with V4, V6, V7 and V8 closed.
To begin the adsorption equilibrium measurements, the adsorbent has to be activated (degassed) in order to remove impurities and moisture. The activation of the samples at a known temperature depends on the adsorbent characteristics. In this case, the adsorbents were activated in situ by heating the samples at 373.15K for the ANG5 and 473K for the MIL-53(Al) under vacuum conditions (for 3 to 4 hours) before each experiment. The heating-rate of the oven is set to 2 K/min until the required temperature for activation is reached. The slow temperature increase reduces the temperature impact in the sample structure and prevents any damages.
In order to measure an adsorption isotherm, the gas fed into the reference volume is expanded into the sample cell while the pressure is measured by the two pressure transducers PT1 and PT2. As adsorption takes place the pressure decreases until the equilibrium is established, this is assumed to occur when the pressure becomes constant and origins a plateau.
The equilibrium state generally takes a few hours to be established depending on the characteristics of the adsorbent-adsorbate system under study. When the equilibrium is established the valves V4 and V6 are closed and the procedure is repeated as many times as desired taking into account the limit range of the pressure transducers which is 20 bar.
The desorption equilibrium measurements are done in similar way as the adsorption ones, but instead of feeding the gas into the reference volume it has to be released using the exhaustion stream line. This way, when the maximum pressure is reached, a similar procedure is repeated, but this time by stepwise depressurization of the reference volume and subsequent contact with the adsorption cells. This checks possible hysteresis effects [76].
3.1.2. Materials
16
ANG5 carbon supplied by Sutcliffe Speakman Carbons Ltd. (UK) is a pelletized carbon (2 mm diameter extruded) with high density and activity [70]. The activated carbon extruded form is an interesting morphology for gas separation process applications since it allows decreasing the adsorption bed pressure drop, has good mechanical strength and less dusting when compared with powdered materials, which are unpractical for industrial applications [70].
Approximately 0.3 grams of each material were employed in the experimental measurements, after a proper activation in situ, under vacuum at 373K for the activated carbon and 473K for the MOF. All gases used in the work were supplied Air Liquide (Portugal): CO2
N48, C2H6 N35 and He N50.
3.2. Theory
Adsorption equilibrium data are often reported as excess amount adsorbed (qex) which gives the amount of gas adsorbed in excess that occupies the same volume at the same pressure and temperature, if the gas is not adsorbable in the solid [31]. The mass balance employed in the determination of the excess amount adsorbed is presented in Equation (1):
[
(
) (
)(
)
]
Equation (1)where ms correspond to the solid mass activated, Vref is the reference volume, Vcand Vs are
the cell volume and the solid volume respectively and qads-1 is the amount of gas adsorbed in the previous step, ρref and ρcell are the densities of the bulk gas in the reference volume and in the cell at the initial pressure (i) and temperature and after expansion at pressure and temperature of equilibrium (f). This density values were obtained using the NIST database [78].
The total amount adsorbed (qt) is related to the excess amount adsorbed by the equation 2 where Vp is referred to the pore volume of the adsorbent and ρg is the density of the gas [79]. This quantity considers the adsorbed phase as well as the coexisting gas within the pore volume of the adsorbent [70]:
Equation (2)
Gumma and Talu [79] have recently proposed a new thermodynamic quantity, net amount adsorbed (qnet), to report adsorption equilibrium data. It is the total amount of gas present in the measuring cell with the adsorbent minus the amount that would be present in the empty cell (without the adsorbent) at the same pressure and temperature. This quantity can be related to qex by Equation (3) where Vs is the solid volume [73]:
The advantage of reporting adsorption results in therms of qnet is that it completely circumvents the use of probe molecules to fix the reference state of each sample since the value of Vref and Vcell are independent of the fluid-adsorbent system [73] [79].
3.3. Experimental Results and Discussion
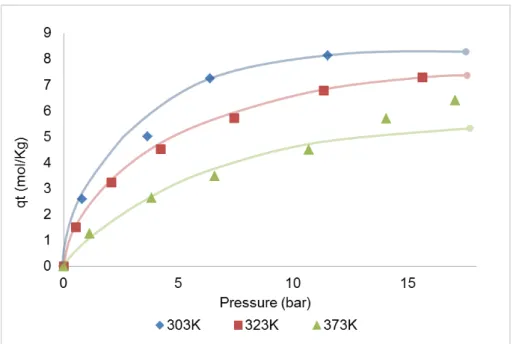
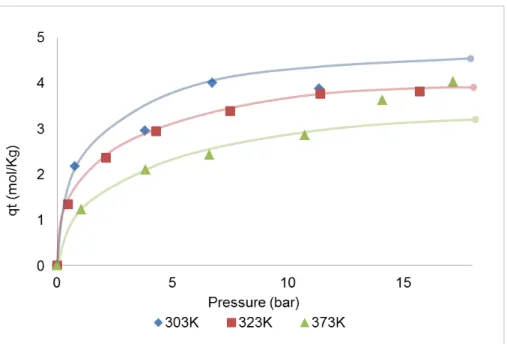
The experimental adsorption equilibrium isotherms of ethane on ANG5 and MIL-53(Al) at 303K, 323K and 373K are presented in Figures 3.3 and 3.4, respectively and the tables listing the obtained results are presented in Appendix A and B. As expected, the isotherms show a decreasing adsorption capacity as the temperature increases since adsorption is an exothermic phenomenon. Despite this fact, in some points the isotherms present an unexpected shape as it is possible to observe in Figure 3.3 for the adsorption equilibrium isotherm of ethane on ANG5 at 373K. The same is observed for MIL-53(Al) where the isotherms for different temperatures intersect each other (Figure 3.4). These observations confirmed that the solenoid valves were not able to work properly within all the experimental conditions. These valves could not work in a bidirectional system, allowing the gas to backflow when pressure variations occurred.
Figure 3.3 – Single-component adsorption equilibrium isotherms for ethane at 303K, 323K and
373K on ANG5. Solid lines are a guide-to-the-eye.
18
for obtaining experimental results in which the isotherms at different temperatures intercept each other.
Figure 3.4 - Single-component adsorption equilibrium isotherms for ethane at 303K, 323K and 373K
on MIL-53(Al). Solid lines are a guide-to-the-eye.
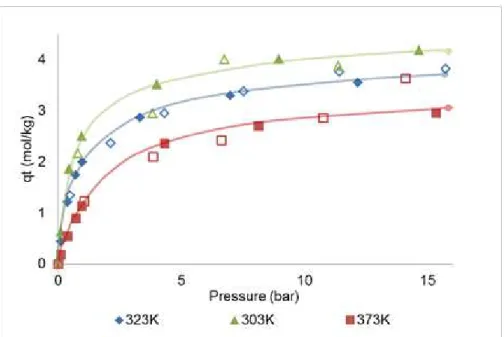
Figure 3.5 - Single-component adsorption equilibrium isotherms for ethane at 303K, 323K and 373K
on MIL-53(Al). Filled plots denote the experimental data obtained previously by Gravimetry by the
research group [73]; empty plots denote the volumetric results obtained in this work. Solid lines
are a guide-to-the-eye.
After 10 bar, the adsorption isotherm measured at 373K was expected to maintain an absolute amount adsorbed lower than 3 mol/kg instead of a total adsorption almost coincident to the one measurement at 323K which indicates a leak of gas.
Subsequently to the analysis of these results it was concluded that the volumetric unit had to be upgraded to allow its correct operation. Therefore, the solenoid valves were substituted by manual ball valves. Furthermore, an additional change in the apparatus was promoted in order to allow testing a new method for the measurement of adsorption equilibrium, as described in Chapter 4.
3.4. Volumetric Unit Upgrade
The upgrading of the unit consisted mainly in the substitution of the solenoid valves for manually operated ball valves. Unlike the automatic solenoid valves, the newly employed ball valves have a spherical disk that permits the total blockage of the gas flow independently of the direction of the flow.
20
performed since the reference volume, which was kept at ambient temperature, has nearly 40 cm3 while the adsorbent cell volume is inferior to 3 cm3. Therefore, if the previous unit configuration was maintained it would be unfeasible to test the alternative method proposed in this work, and detailed in Chapter 4. The result of the modifications made to the upgraded volumetric unit is presented in Figure 3.6 and 3.7 and a schematic is showed in Figure 3.8.
Despite the modification of the volumetric unit, the experimental procedure to operate this installation remains similar to the previous one. During the adsorption equilibrium measurements the valve V0 remains closed (Figure 3.8) during the entire process being only used for the reference and cell volumes calibration.
Figure 3.6 - General view of the upgraded volumetric unit
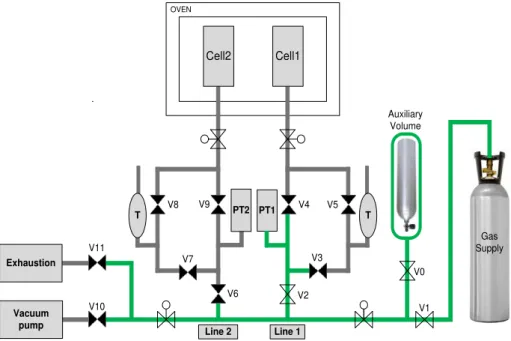
Line 1 Line 2 Vacuum Pump Exhaustion PT1 PT2 T T Cell1 Cell2 OVEN V1 V0 V2 V6 V10 V11 V3 V4 V5 V7 V8 V9 Auxiliary Volume Gas Supply
Figure 3.8 - Schematic representation of the upgraded volumetric unit. The green section
represents the reference volume (Vref); PT denote the pressure transducers, V the valves, and T
the Pt100 sensor.
In the adsorption equilibrium measurements, following the traditional method at constant temperature, the gas is fed into the reference volume represented in green (Figure 3.8) by opening valves V1, V2 and V3, with V4 and V5 closed for line 1, and V6 and V7 open with V8 and V9 closed for line 2. The gas is then enclosed inside the reference volume by closing the valves V2 and V6. After approximately 10 minutes, the gas contained in the reference volume is expanded to the adsorption cells by opening the valves V4, V5, V8 and V9. This way, the adsorbate species contacts with the adsorbent inside the adsorption cells placed in the oven and thus the adsorption occurs. This step is limited by the time needed to reach the equilibrium fluid-solid, after which valves V4, V5, V8 and V9 are closed and the procedure is repeated as many times as necessary but limited to the pressure transducers operation limit, which is 20 bar. When the maximum pressure is reached, depressurization steps to desorb the retained species can be performed by stepwise depressurization of the reference volumes and subsequent contact with the adsorption cells.
3.4.1. Volumetric Unit Upgraded: Reference and Cell Volume Calibration
The modifications of the experimental unit led to different reference and cell volumes that had to be recalibrated. The volumes calibration was performed using a previously determined volume (auxiliary volume in Figure 3.9). The auxiliary volume (334.11cm3) was calibrated by measuring the weight difference when empty and filled with deionized water (298K) considering the water density of 996.99 Kg/m3 [80].
22
to a pre-defined pressure which is monitored using one of the pressure transducers, as showed in Figure 3.9.
Line 1 Line 2 Exhaustion PT1 PT2 T T Cell1 Cell2 Vacuum pump OVEN Auxiliary Volume Gas Supply V0 V1 V2 V3 V4 V5 V6 V7 V8 V9 V10 V11
Figure 3.9 - Schematic representation of the first step of the volumes calibration.
After the pressure in the auxiliary volume is registered, the valve V0 is closed and the remaining volume of the experimental unit is depressurized and evacuated, as shown in Figure 3.10. This is performed by opening valve V11 and when atmospheric pressure is reached V11 is closed and V10 is opened to evacuate the system.
Line 1 Line 2 Exhaustion PT1 PT2 T T Cell1 Cell2 Vacuum pump OVEN Auxiliary Volume Gas Supply V0 V1 V2 V3 V4 V5 V6 V7 V8 V9 V10 V11
Figure 3.10 - Schematic representation of the second step in the volume calibration.
Line 1 Line 2 Exhaustion PT2 PT1 T T Cell1 Cell2 Vacuum pump OVEN Auxiliary Volume Gas Supply V0 V1 V2 V3 V4 V5 V6 V7 V8 V9 V10 V11
Figure 3.11 - Schematic representation of the third step in the volumes calibration. This step
permits the determination of the volume of the green section, VA.
The pressure is registered in line 1 by opening V2. With this step the volume that comprehends the green line (VA) represented in Figure 3.11 can be calculated applying the
ideal gas law (Equation 5):
Equation (4)
Considering that the amount of gas in the experimental unit is maintained constant, the following relation is observed:
Equation (6)
where VA is the green section presented in Figure 3.10 at the temperature TA and pressure PA;
Vcylinder is the auxiliary volume already known at temperature Tcylinder and pressure Pcylinder. As the
reference volume and the cylinder are both outside the oven and at room temperature, Equation 6 can be simplified:
Equation (7)
After determination of the volume of the green section, VA, the valve V6 is opened, as
24 Line 1 Line 2 Exhaustion PT1 PT2 T T Cell1 Cell2 Vacuum pump OVEN Auxiliary Volume Gas Supply V0 V1 V2 V3 V4 V5 V6 V7 V8 V9 V10 V11
Figure 3.12 - Schematic representation of the fourth step of the volume calibration. This step
permits the determination of the volume of the green section, VB.
As the volume of the section represented in Figure 3.11 is known, the volume (VB)
comprehended by the valves V6, V7 and V9 is calculated by difference, using the pressure registered after this first expansion and following the same logic:
Equation (8)
where VA is the volume calculated in the third step of calibration (Figure 3.11) at a pressure PA
and temperature TA. This way the total volume (VB) of the green section presented in Figure
3.12 can be calculated.
Equation (9)
After the volume VB is calculated, the first reference volume can be determined by
difference applying equation (10). This reference volume (V’ref) corresponds to the section comprehended between valves V6, V7 and V9. The remaining volumes are obtained following the same logic.
The following steps are very straightforward and based on successive expansions, as represented in Figures 3.13 and 3.14, where the volumes are calculated by difference between the initial and the final pressure and employing the ideal gas law.
Line 1 Line 2 Exhaustion PT1 PT2 T T Cell1 Vacuum pump OVEN Auxiliary Volume Gas Supply V0 V1 V2 V3 V4 V5 V6 V7 V8 V9 V10 V11 Cell2
Figure 3.13 - Schematic representation of the fifth step of the volume calibration.
The last step of the volume calibration is the expansion to the adsorption cell (Figure 3.14) which allows the calculation of the cell volume by the same methodology. All the procedure was performed five times in order to minimize the error and obtain averaged values for each volume determined. Line 1 Line 2 Exhaustion PT1 PT2 T T Cell1 Vacuum pump OVEN Auxiliary Volume Gas Supply V0 V1 V2 V3 V4 V5 V6 V7 V8 V9 V10 V11 Cell2
26
In order to calibrate the volumes of line 1, the procedure is repeated symmetrically. The values of the volumes obtained for both lines are showed in Table 3.1:
Table 3.1 – Upgraded volumetric unit calibrated volumes
Results Line 1 Line 2
Vcell (cm 3
) 2.03 ± 0.03 1.92 ± 0.03
Vref (cm 3
) 41.54 ± 0.03 41.51 ± 0.03
V'ref (cm 3
) 2.60 ± 0.01 2.56 ± 0.01
The error of the measurements was determined applying the Standard Combined Uncertainty model (SCU) suggested by the literature [81, 82].
3.5. Validation of the Upgraded Volumetric Unit
The validation of the upgraded volumetric unit was made using both adsorption cells in parallel for the measurement of adsorption equilibrium of CO2 on two different adsorbents. The
experimental results obtained were compared with similar adsorption measurements measured in a high-precision gravimetric unit (Rubotherm GmbH, Germany) [31] [45].
The two adsorbents studied consist in an activated carbon ANGUARD6 (ANG6) presented in the form of extrudates with 1mm diameter, supplied by Sutcliffe Speakman Carbons Ltd. (UK), and an activated carbon honeycomb monolith (ACHM) with cylindrical shape and 20 mm of external diameter, containing 300 cells per square inch. Detailed characterization of the two adsorbents was previously done by the research group [72]. The adsorbate used was carbon dioxide (CO2, 99.998%) supplied by Air Liquide Portugal.
Adsorption equilibrium measurements were performed after both materials were activated in situ at 373K (heating rate of 3K/min) under vacuum for a minimum of four hours. Cells 1 and 2 were packed with 0.23g of ANG6 and 0.17g of monolith respectively.
The main properties of the two adsorbents used are presented in Table 3.2. They have approximate surface areas and pore volumes which indicate similar adsorption capacities for both materials.
Table 3.2 - Adsorbents main characteristics [72]
Adsorbents
Cell1: ANG6 Cell2: ACHM
Pore Volume, Vp (cm3/g) 0.980 0.990
Solid Density, ρs (g/cm
3
) 2.62 2.85
The experimental adsorption equilibrium isotherms of CO2 on ANG6 and ACHM at 323K
are presented in Figures 3.15 and 3.16, respectively. The experimental data (qt, qex and qnet) is reported in Appendix C and D.
Adsorption equilibrium isotherms of CO2 on both adsorbents are reported up to 10 bar,
despite the fact that the unit was designed to allow measurements up to 20 bar of pressure. This is due to the fact that the adsorption cells employed in the volumetric unit could not avoid gas leaks above 10 bar. This indicates that the adsorption cells must be changed in the future to allow measurements within 0-20 bar.
Figure 3.15 – Single-component adsorption equilibrium isotherm for CO2 at 323K on ANG6.
28
Figure 3.16 - Single-component adsorption equilibrium isotherm for CO2 at 323K on ACHM
monolith.
The results obtained with the modified volumetric unit prove that problem revealed by the previous unit was overcome. The obtained isotherms are perfectly shaped and unlike the previous measurements (with the original volumetric unit), this results shows a great agreement when compared with the results obtained by the high-precision gravimetric unit, performed at the same thermodynamic conditions. Figures 3.17 and 3.18 present the comparison between the CO2 adsorption equilibrium data at 323K obtained in the gravimetric unit and in the
revamped volumetric apparatus in ANG6 and ACHM, respectively.
Figure 3.17 - Single-component adsorption equilibrium isotherm for CO2 at 323K on ANG 6.
The isotherms are coincident for both experimental methods. The difference between the two experimental methods is 7% for the ANG6 and 4% for the ACHM monolith at a pressure value of 6 bar thus validating that the revised volumetric unit is working properly and can be used in future work. It should be noted that at pressures higher than 6 bar the ANG6 present an absolute amount adsorbed higher in the volumetric experiment than in the gravimetric perhaps because of the cumulative error presented by the volumetric method, due to the consecutive gas loading and subsequent expansion.
Figure 3.18 - Single-component adsorption equilibrium isotherm for CO2 at 323K on ACHM
monolith. Comparison between the gravimetric and volumetric data.
3.6. Adsorption Equilibrium of CO2 on Metal-Organic Frameworks Cu-BTC and
Fe-BTC
30
Table 3.3 – Physical properties of the adsorbents Cu-BTC and Fe-BTC
Adsorbents
Cell1: Fe-BTC Cell2:Cu-BTC
Surface Area, S (m2/g) [49] 1300-1600 1500-2100 Reactivation Temperature (K) [49] 473 473
Pore Volume, Vp (cm3/g) [83] 0.400 0.610
Solid Density, ρs (g/cm3) [84] 1.677 1.663
The adsorption equilibrium isotherms of CO2 at 303K in Fe-BTC and Cu-BTC in terms of
qnet, qex and qt, are presented in Figures 3.19 and 3.20 respectively. The experimental data is listed in Appendix E and F. The adsorption equilibrium point obtained at higher pressure (approximately 10 bar), for each adsorbent does not follow the same trend as the lower pressure points. This was due to the adsorption cell malfunctioning which could not avoid gaseous leaks when pressures of around 10 bar or higher are reached. This gas sealing problem observed is due to the fact that the adsorbent containing cell was adapted from a Swagelok filter. This piece was not conceived for sequential opening and closing, reason why after several cycles of opening/closure and heating up to high temperatures, it started to allow CO2 leaks.
The Fe-BTC adsorbent is a new material that is not well studied reason why there are not many adsorption experimental data available. This makes interesting to study this material for several potential applications. The adsorption equilibrium isotherm obtained for CO2 over
Fe-BTC adsorbent is a Type I isotherm [74]. The absolute amount adsorbed obtained at 9.89 bar and 303K is 3.7 mol/kg. This value is in coherent with previously reported values (3.34 mol/kg at 318K) at the same pressure [85].
As for the adsorption isotherm for the Cu-BTC adsorbent the plots also show a classic Langmuir-type isotherm [74] with a well-shaped adsorption curve. Figure 3.20 presents the amount adsorbed in terms of qnet, qex and qt of CO2 in Cu-BTC. The absolute amount adsorbed
at 5.9 bar (approximately 10.4 mol/Kg) is in agreement with the highest values reported in literature [55][86, 87]. Also the adsorption rapidly increases at pressures below 5 bar and then slowly increases with the increasing pressure. The rate of increase depends on the surface area, at intermediate pressures, and pore volume of the sample at high pressures [88].
Figure 3.20 - Single-component adsorption equilibrium isotherm for CO2 at 303K on Cu-BTC.
Cu-BTC show higher adsorption capacity towards CO2 than Fe-BTC, which can be
explained by it larger surface area and pore volume when compared with Fe-BTC. Figures 3.21 and 3.22, presented the comparison of the experimental data obtained in this study for the adsorption equilibrium measurement of CO2 on Cu-BTC and Fe-BTC, with the data reported in
32
Figure 3.21 – Single-component adsorption equilibrium isotherm of CO2 at 303K on Fe-BTC.
Comparison with the Deniz and co-workers data [85].
It is possible to observe that the measurements are in accordance, even though the temperatures are slightly different. The last point of each isotherm presents a higher adsorption capacity due to the fact that is attributed to experimental difficulties related with the adsorption cell characteristics, as described earlier.
Figure 3.22 - Single-component adsorption equilibrium isotherm of CO2 at 303K on Cu-BTC-
![Figure 2.1 - IUPAC classification for adsorption isotherms [9]](https://thumb-eu.123doks.com/thumbv2/123dok_br/16491206.733164/25.892.221.668.115.436/figure-iupac-classification-adsorption-isotherms.webp)
![Table 2.2 - Advantages and disadvantages of the volumetric method used to measure adsorption equilibria data [10]](https://thumb-eu.123doks.com/thumbv2/123dok_br/16491206.733164/30.892.130.758.891.1145/table-advantages-disadvantages-volumetric-method-measure-adsorption-equilibria.webp)