Environmental variables influencing the expression of morphological
characteristics in clones of the forage cactus
1Variáveis ambientais condicionando a expressão de características morfológicas de
clones de palma forrageira
Marcela Lúcia Barbosa2, Thieres George Freire da Silva3*, Sérgio Zolnier2, Sérvulo Mercier Siqueira e Silva4 and
Williams Pinto Marques Ferreira5
ABSTRACT - The environmental factors that affect the morphological characteristics of different genera of cacti are little known. The aim of this study therefore was to analyse the contribution of environmental variables to growth in cladodes and plant of forage cactus clones of the generaNopalea andOpuntia. The data used in this study were obtained from an experiment conducted in Serra Talhada, Pernambuco, Brazil, between 2012 and 2013, where the clones ‘IPA Sertânia’ (Nopalea), ‘Miúda’ (Nopalea) and ‘Orelha de Elefante Mexicana’ (Opuntia) were submitted to different irrigation depths (2.5, 5.0 and 7.5 mm) and fixed irrigation intervals (7, 14 and 28 days). Morphological characteristics of the cladodes and plants and weather variables were obtained over time. Pearson’s correlation, followed by multicollinearity, canonical and path analysis were applied. The minimum temperature, maximum and minimum relative humidity, wind speed and solar radiation were the variables that most affected growth in the cactus. The genusOpuntia showed less sensitivity to variations in air temperature compared to the genusNopalea. The higher intensities of global solar radiation affected clones of the genusNopalea more than the genus
Opuntia. It can be concluded that there are different environmental requirements between forage cacti of the generaNopalea
andOpuntia.
Key words: Statistical analysis.Nopalea sp.Opuntia sp. Weather variables.
RESUMO - Os fatores ambientais que afetam as características morfológicas de distintos gêneros de cactáceas são pouco conhecidos. Assim, objetivou-se analisar a contribuição de variáveis ambientais para o crescimento dos cladódios e da planta de clones de palma forrageira dos gênerosNopalea eOpuntia. Os dados usados nesse estudo foram adquiridos de um experimento
conduzido em Serra Talhada, Pernambuco, entre os anos de 2012 e 2013, onde os clones ‘IPA Sertânia’ (Nopalea), ‘Miúda’
(Nopalea) e ‘Orelha de Elefante Mexicana’ (Opuntia) foram submetidos a distintas lâminas (2,5; 5,0; e 7,5 mm) e intervalos
fixos de irrigação (7; 14 e 28 dias). Características morfológicas dos cladódios e das plantas, e variáveis meteorológicas foram obtidas ao longo do tempo. Correlação de Pearson, seguida de análises de multicolinearidade, canônica e trilha foram aplicadas. Temperatura mínima, umidade relativa máxima e mínima, velocidade do vento e radiação solar foram as variáveis que mais afetaram o crescimento da palma. O gênero Opuntia revelou menor sensibilidade à variação da temperatura do ar quando
comparado ao gêneroNopalea. As maiores intensidades de radiação solar global afetaram mais os clones do gêneroNopalea
do que do gêneroOpuntia. Conclui-se que há uma exigência ambiental diferenciada entre os gênerosNopalea eOpuntia de
palma forrageira.
Palavras-chave: Análise estatística.Nopalea sp..Opuntia sp.. Variáveis meteorológicas. DOI: 10.5935/1806-6690.20180045
*Author for correspondence
Received for publication 06/06/2016; approved 16/08/2017
1Parte da Dissertação de Mestrado da primeira autora apresentada no Programa de Pós-graduação em Meteorologia Agrícola
2Departamento de Engenharia Agrícola, Universidade Federal de Viçosa, Av. Peter Henry Rolfs, s/n,Campus Universitário, Viçosa-MG, Brasil,
36.570-900, [email protected], [email protected]
3Unidade Acadêmica de Serra Talhada, Universidade Federal Rural de Pernambuco, Av. Gregório Ferraz Nogueira, s/n, José Tomé de Souza Ramos,
Serra Talhada-PE, Brasil, 56.909-535, [email protected]
4Estação Experimental de Arcoverde, Instituto Agronômico de Pernambuco, BR 232, s/n, Arcoverde-PE, Brasil, 56.500-000, servulo.mercier@
yahoo.com.br
5Unidade de Pesquisa em Café, Empresa Brasileira de Pesquisa Agropecuária, Vila Gianetti, Casa 46,Campus Universitário, Viçosa-MG, Brasil,
INTRODUCTION
Knowledge of the interaction between plants and the environment is an aid to understanding the influence of weather elements on species growth, development and productivity (SENTELHAS; MONTEIRO, 2009). These elements influence the dynamics of plant metabolism, interfering directly or indirectly in processes such as stomatal activity, photosynthesis, morphology, and the
duration of phenological phases, among others (JIAet al.,
2015; LLORENSet al., 2015; MOTSAet al., 2015).
Depending on the interaction with environmental variables, the plants can undergo processes of phenotypic plasticity in order to develop characteristics
for adaptation to the growth environment (LOUWet al.,
2015). An example of this is the acid metabolism of the crassulaceae (CAM), which allows the plants to tolerate conditions of water stress at high ambient temperatures as found in arid and semi-arid regions. CAM plants
open their stomata to capture the CO2 necessary for
their metabolism, especially at night, when ambient temperatures and water losses to the atmosphere are lower. Photosynthesis takes place during the day through photochemical stimulus of the solar radiation; however, the stomata remain closed (LÜTTGE, 2010).
Among CAM species, the cactus (Opuntia sp. and
Nopalea sp.) is important due to its use as a source of food
and water for animals during periods of drought. In this species, the leaves are atrophied and only spines remain in their place, so that the photosynthetic tissue is located in
the cladodes, which in addition to storing water and CO2
for photosynthesis, convert light energy into chemical
energy (AZEVEDOet al., 2013).
Despite having the same photosynthetic type, cactus clones differ in their morphological characteristics as they have different cladode sizes and structures. These characteristics reflect differences in the photosynthetic structures and in the architecture of the plant canopy, resulting in different methods of water extraction and
storage in the cladodes (SILVAet al., 2008; SILVAet al.,
2014).
Multivariate analysis, such as canonical correlation, is an aid to understanding these characteristics, since they evaluate the interrelationships between two groups of variables. Many studies have used these techniques for
forage cactus. Peña-Valdiviaet al. (2008) correlated the
vegetative characteristics of the cladodes with those of
clones of the genusOpuntia. Pinheiroet al. (2014) studied
the interrelation between the cladode area index and the morphogenic and productive characteristics of clones
of the genera Opuntia andNopalea. Silva et al. (2010)
and Neder et al. (2013) identified the morphological
characteristics that contribute most to the productivity of different forage cactus clones.
Based on the above, it is expected to answer the following questions: How do environmental variables affect expression of the morphological characteristics of the forage cactus? Although belonging to the same photosynthetic group (CAM), do clones of different genera respond differently to environmental variables? The aim of this study therefore was to analyse the contribution of environmental variables to the expression of morphological characteristics in plants and cladodes of
clones of the genera Nopalea andOpuntia in a semi-arid
environment.
MATERIAL AND METHODS
The experiment was carried out at the Agronomic Institute of Pernambuco (IPA), in the district of Serra Talhada, in the semi-arid region of the State of Pernambuco, Brazil (PE). The local climate characteristics are determined by the average annual temperature of 24.8 ºC, relative humidity of 62% and rainfall of approximately 642 mm
year-1, with a more concentrated distribution from January
to April. The soil of the experimental area is classified as a eutrophic Red Yellow Argisol with a sandy loam texture, and the climate, according to the Köppen classification, is type BSh.
Three forage cactus clones were evaluated, one of
the genusOpuntia (‘Orelha de Elefante Mexicana’, OEM)
and two of the genus Nopalea(‘Miúda’, MIU and
‘IPA-Sertânia’, IPA), during the second production cycle (after the 1st cut), giving a total of 532 days from March 2012 to August 2013. The spacing used was 1.6 x 0.2 m, with the crop rows planted in a system of terraces.
The design was of randomised blocks in a 3x3x3+3 factorial arrangement, with three replications and one control for each clone. Using a drip irrigation system (emitters spaced 0.40 m apart) three fixed irrigation depths [2.5 mm (D2.5), 5.0 mm (D5.0) and 7.5 mm (D7.5) - plots] were applied to replenish the water in the soil, at three irrigation frequencies [every 7 days (F7), 14 days (F14) and 28 days (F28) – subplots]. The three clones (IPA, OEM and MIU) made up the sub-subplots. The experiment had 90 sub-subplots, each comprising 4 rows of 20 plants, giving a total of 80 plants with an area of
25.6 m2 and a working area of 11.52 m2. The working area
consisted of 32 plants located in the two central rows. During the experimental period, the three clones received the equivalent of 756 (D7.5 F7), 672 (D5.0 F7), 622 (D7.5 F14), 586 (D2.5 F7), 579 (D5.0 F14), 555 (D7.5 F28), 536 (D2.5 F14), 535 (D5.0 F28), 514 (D2.5 F28)
Fertilisation was carried out monthly, with an
application of 50 kg ha-1 NPK formulation 14-00-18, as
recommended by the Agronomic Institute of Pernambuco. Throughout the experimental period, crop treatments, such as weeding and the application of herbicides, were carried out to eliminate weeds; disease control was carried out whenever necessary.
Data of global solar radiation (Rg, MJ m-2 day-1),
mean (Tm, °C), maximum (Tx, °C) and minimum (Tn, °C) temperatures, and mean (RHm,%), maximum (RHx,%) and minimum (RHn,%) relative humidity, wind speed (u,
m s-1) and rainfall (R, mm) were obtained daily from an
automatic weather station of the National Weather Institute - INMET, located 1.7 km from the experimental area.
The morphological characteristics of plant and cladode growth were recorded in 13 campaigns: 24/07/2012 - DAC 146, 22/08/2012 - DAC 175, 19/09/2012 - DAC 203, 27/10/2012 - DAC 241, 24/11/2012 - DAC 269, 22/12/2012 - DAC 297, 26/01/2013 - DAC 332, 2/23/2013 - DAC 360, 03/23/2013 - DAC 388, 04/27/2013 - DAC 423, 05/25/2013 - DAC 451, 06/07/2013 - DAC 493 and 07/27/2013 - DAC 514.
The experimental data were arranged in three groups of response and/or explanatory variables according to the interest under study, as follows.
The group known as ‘Environment’ consisted of weather and soil water supply (SWS) data, which were obtained by integrating the values for precipitation and irrigation; the latter depending on the treatments of irrigation depths and frequencies. Data of the weather elements, as well as those of SWS, were considered for the intervals between the recording campaigns of the morphological characteristics. Daily mean values for air temperature, relative humidity and wind speed data were determined. On the other hand, integration of the global solar radiation data and the sum of the precipitation data was carried out daily.
The ‘Plant’ group consisted of morphological characteristics, represented by plant height (PH, from the soil surface to the highest cladode) and plant width (PW, at the widest part), obtained with the aid of a tape measure. The total number of cladodes in each plant (TNC) was also counted in order of cladode appearance (NC1, the first units to emerge from the basal cladode) to the fourth order (NC2, NC3, NC4), depending on the clone. The cladode area index (CAI) was determined by the ratio between total cladode area and plant spacing (1.6 x 0.2 m).
The ‘Cladode’ group comprised the morphological characteristics of the cladodes, which consisted of measurements of the basal cladodes up to the fourth order of appearance on a representative branch of the plant.
These measurements included cladode length (CLB, CL1, CL2, CL3 and CL4), width (CWB, CW1, CW2, CW3 and CW4), and thickness (CTB, CT1, CT2, CT3 and CT4) from the basal cladodes to the fourth order, which were measured with a tape measure and callipers. In addition, values for cladode area were calculated for all orders (CAB, CA1, CA2, CA3 and CA4), using statistical models
adjusted by Silvaet al. (2014) for the clones, based on the
data of cladode length and width.
The ‘Environment’ group was considered an explanatory variable, and the ‘Plant’ and ‘Cladode’ groups considered response variables.
The data from each group were submitted to tests of normality and analysis of variance, and of the interrelationships between the explanatory and response characteristics of the clones and the crop environment as described above. First, the Pearson correlation matrix was prepared, in which the existence, direction and intensity of the linear relationship between the groups of variables was evaluated. The significance of the coefficients was evaluated by Student’s t-test.
The response and explanatory variables that presented significant correlations were submitted to the multicollinearity test. This was done for the data of each group, with the aim of identifying the existence and intensity of the correlation between the variables.
Only the variables that showed weak multicollinearity were used in the canonical correlation analysis, and evaluated for associations between groups of variables. The canonical axes were established from the number of variables of the smallest group. The canonical correlations were tested using the chi-square test.
Path analysis was applied in the breakdown of the correlation coefficient, allowing the degree of the effect of an explanatory variable on the response variable to be determined by means of the path coefficient. In this analysis, the partial correlation coefficient between two variables was calculated, disregarding the effect of the remaining variables. The significance of the partial correlation adopted was the same as used in the Pearson correlation.
All statistical analyses followed the procedures suggested by Toebe and Cargnelutti Filho (2013), and were carried out using the GENES statistical software (CRUZ, 2006).
RESULTS AND DISCUSSION
cladodes in the forage cactus clones was influenced by
the environmental variables. Pinheiro et al. (2014),
Nederet al. (2013) and Silvaet al. (2010) also reported
morphological differences between clones that may influence the different responses to the growth environment.
One canonical axis for IPA Sertânia - IPA (p<0.001,
χ2 = 34, degree of freedom = 15) and another for ‘Miúda’
- MIU (p<0.001, χ2 = 39, degree of freedom = 25) showed
the relationship of the ‘Plant’ group with the environmental variables. In both cases, the minimum temperature (Tn), maximum (RHx) and/or minimum (RHn) relative
humidity, and wind speed (u) in that order, explained
96.8% and 97.8% of the changes in the morphological characteristics of the plants.
In terms of the cladodes, there were two significant
canonical axes for IPA (p<0.001, χ2 = 130/57, degree
of freedom = 40/28) and three for MIU (p<0.001, χ2 =
141/56/31, degree of freedom = 40/28/18), showing a relationship with the ‘Environment’ group. On these
axes, the environmental variables RHx, RHn,u and Rg,
explained 99.9% and 99.8% of cladode growth in the IPA
clone, while Tn, RHn andu were responsible for 99.9%,
99.7% and 98.7% in the MIU clone.
For the ‘Orelha de Elefante Mexicana’ - OEM, there was no significant canonical axis for the morphological characteristics of the ‘Plant’ and ‘Cladode’ groups with the ‘Environment’ group, showing that its elements explained the growth variables differently.
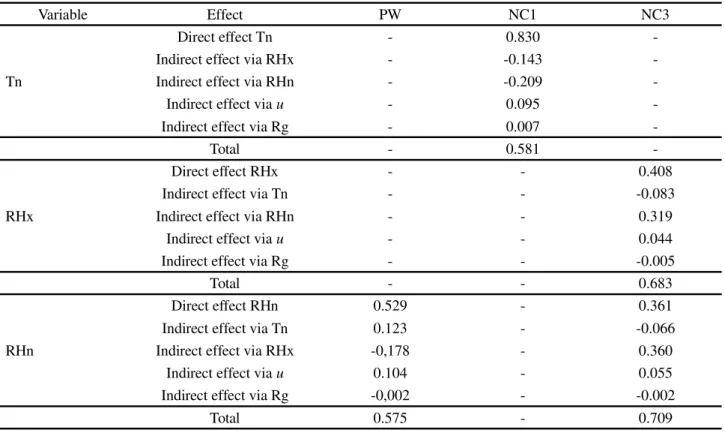
From the breakdown of the Pearson correlation between the morphological characteristics and the environmental variables, a direct (0.830) and indirect effect
viau (-0.535) from Tn was seen on the appearance of
first-order cladodes in the IPA clone (Table 1). On the other hand, in the MIU clone, Tn exerted an indirect negative
effect viau on plant width (PW) (-0.598) (Table 2).
No effect from Tn was seen in the OEM clone,
(Table 3). The data show that clones of the genusOpuntia
supposedly have a lower sensitivity to variations in air
temperature. In the literature, it is stated that Opuntia
fícus-indica requires a night-time to daytime temperature
ratio of 1.7 (25/15 °C) for full growth. These conditions
favour CO2 capture and therefore the accumulation of
biomass (NOBEL, 2001). There are no records for the
influence of temperature on clones of the genusNopalea.
In the present study, maximum and minimum temperatures varied between 30-36 (33) ºC and 18-23 (21) ºC, in that
Variable Effect PW NC1 NC3
Tn
Direct effect Tn - 0.830
-Indirect effect via RHx - -0.143
-Indirect effect via RHn - -0.209
-Indirect effect viau - 0.095
-Indirect effect via Rg - 0.007
-Total - 0.581
-RHx
Direct effect RHx - - 0.408
Indirect effect via Tn - - -0.083
Indirect effect via RHn - - 0.319
Indirect effect viau - - 0.044
Indirect effect via Rg - - -0.005
Total - - 0.683
RHn
Direct effect RHn 0.529 - 0.361
Indirect effect via Tn 0.123 - -0.066
Indirect effect via RHx -0,178 - 0.360
Indirect effect viau 0.104 - 0.055
Indirect effect via Rg -0,002 - -0.002
Total 0.575 - 0.709
Where: ‘Environment’ group: Tn - minimum air temperature, RHx - maximum relative humidity, RHn - minimum relative humidity, u - wind speed; ‘Plant’ group: PW: plant width, NC1 - number of first-order cladodes, NC3 - number of third-order cladodes. “-” indicates that the environmental variable showed no correlation with any of the variables of the ‘plant’ group
order, resulting in a daily average of 23-29 (26) ºC. Values in parentheses indicate the respective mean values. These data resulted in a thermal ratio of 1.6 (33/21), close to that reported by Nobel (2001) of 1.7.
Table 2 - Breakdown of the Pearson correlation coefficient into direct and indirect effects between variables of the ‘Plant’ response group (plant structural characteristics), with variables of the ‘Environment’ explanatory group (environmental variables) in the ‘Miúda’ clone - MIU, under irrigated conditions in a semi-arid environment in the district of Serra Talhada, PE, Brazil
Variable Effect PW NC1 NC3 NC4 CAI
Tn
Direct effect Tn - 0.070 - -
-Indirect effect via RHx - 0.475 - -
-Indirect effect via RHn - -0.256 - -
-Indirect effect viau - 0.379 - -
-Indirect effect via Rg - 0.014 - -
-Total - 0.682 - -
-RHn
Direct effect RHn - - - 0.581
-Indirect effect via Tn - - - -0.096
-Indirect effect via RHx - - - 0.082
-Indirect effect viau - - - 0.056
-Indirect effect via Rg - - - -0.002
-Total - - - 0,620
-u
Direct effectu 0.116 -0.587 -0.522 -0.438 -0,887
Indirect effect via Tn -0.598 -0.045 -0.189 -0.126 0,230
Indirect effect via RHx -0,089 0.078 -0.011 -0.009 0.031
Indirect effect via RHn -0,019 -0.066 -0.057 -0.074 -0.062
Indirect effect via Rg 0,024 0.052 0.040 0.031 0.055
Total -0.567 -0.568 -0.739 -0.617 -0.633
Coefficient of determination 0.677 0.841 0.903 0.805 0.913
Scalisiet al. (2016) state that air temperature is the
variable that most affects the growth dynamics of cladodes when the cactus is grown under conditions of no water restriction. On the other hand, under water limitation,
u
Direct effectu -0.823 -0.148 -0.437
Indirect effect via Tn 0.161 -0.535 -0.087
Indirect effect via RHx 0,020 -0.023 -0.041
Indirect effect via RHn -0,067 -0.054 -0.046
Indirect effect via Rg 0,047 0.028 0.029
Total -0.662 -0.732 -0.582
Coefficient of determination 0.923 0.805 0.871
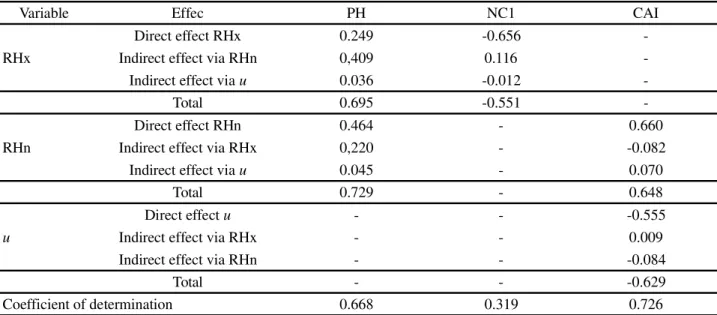
Continuation Table 1
Variable Effec PH NC1 CAI
RHx
Direct effect RHx 0.249 -0.656
-Indirect effect via RHn 0,409 0.116
-Indirect effect viau 0.036 -0.012
-Total 0.695 -0.551
-RHn
Direct effect RHn 0.464 - 0.660
Indirect effect via RHx 0,220 - -0.082
Indirect effect viau 0.045 - 0.070
Total 0.729 - 0.648
u
Direct effectu - - -0.555
Indirect effect via RHx - - 0.009
Indirect effect via RHn - - -0.084
Total - - -0.629
Coefficient of determination 0.668 0.319 0.726
the soil water content is the most determining factor. In the present study, the effect of most of the environmental variables occurred during the rainy season, which may explain why no effect was identified on cactus growth from the water supply. In addition, under ample water availability, the immediate response of the cactus may not be noted due to its high capacity for storing water in the cladodes, low water requirement and low dry-matter
conversion (QUEIROZet al., 2015).
Direct and indirect effects from RHx and RHn were seen in an increase in the number of third-order cladodes; RHn further contributed to the growth in plant width (PW) in the IPA clone. RHn had a direct positive effect on the emergence of higher-order cladodes (NC4) (0.581), while higher values of RHx via Tn contributed to increase the number of first-order cladodes (NC1) (0.475) in MIU. Greater values for RHn favoured PH (0.464) and CAI (0.660) in OEM. In contrast, lower values of RHx did not promote the appearance of new first-order cladodes (NC1) (-0.656).
Higher values for RHn and RHx result in a lower vapour pressure deficit, which decreases water loss from
the plant to the atmosphere and favours CO2 uptake
(LLORENSet al., 2015; MOTSAet al., 2015). However,
the effects also depend on air temperature, which affects several phases of plant metabolism, such as the enzyme action of metabolic processes, respiration and the duration
Table 3 - Breakdown of the Pearson correlation coefficient into direct and indirect effects between variables of the ‘Plant’ response group (plant structural characteristics), with variables of the ‘Environment’ explanatory group (environmental variables) in the ‘Orelha de Elefante Mexicana’ clone - OEM, under irrigated conditions in a semi-arid environment in the district of Serra Talhada, PE, Brazil
of phenological phases (BAHUGUNA; JAGADISH,
2015; JIAet al., 2015). In this research, the maximum and
minimum values for relative humidity were around 69-86 (78) % and 7-38 (26) %, with a daily average of 41-65 (52) %.
Increases in the number of third-order cladodes (-0.437) and in plant width (-0.823) in the IPA clone
occurred at the lower values of u. Under this condition,
the CAI of the MIU clone did not display much evolution (-0.887); similarly for the CAI of the OEM clone (-0.555).
The wind speed varied over time between 2-4 (3) m s-1.
Within this range,u promotes renewal of the air near the
vegetative canopy, aiding in the availability of CO2. In
contrast, higher values contribute to an excessive increase in the processes of transpiration, influencing the stomatal activity of the leaves with a subsequent reduction in
photosynthesis (KIM et al., 2014; LOUW et al., 2015).
The influence of wind speed in the present research was
similar to that seen by Silva et al. (2015), who found a
direct negative effect on the morphological characteristics of cactus grown under rainfed conditions in the district of Serra Talhada, PE.
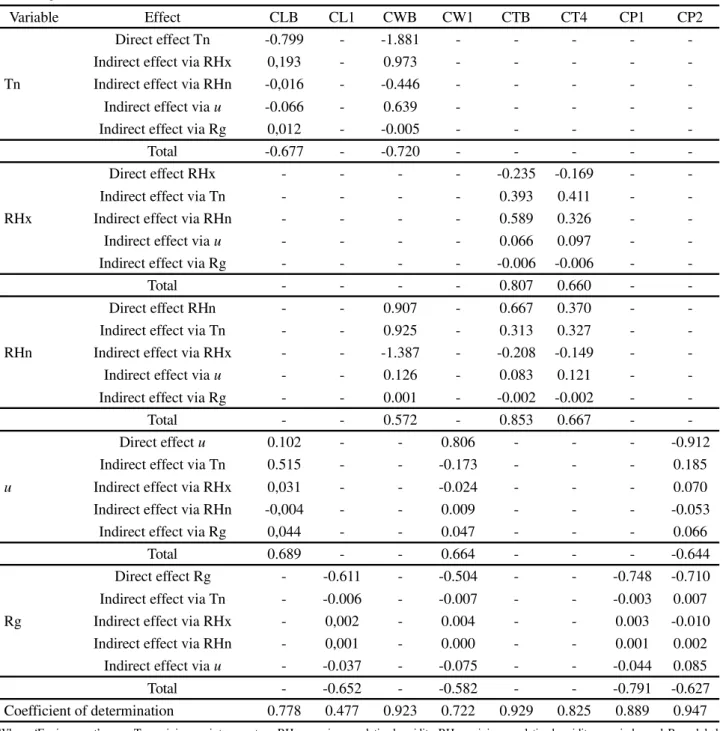
For cladode characteristics, it was found that Tn did not affect the IPA clone (Table 4); the same was not seen in the MIU clone (Table 5), which suffered a direct negative effect on growth in the basal cladodes (CLB, CWB), and an indirect effect via RHx on CT4 (0.411). Tn also had a
the basal and third-order cladodes (CPB, CT3) in OEM. The growth of the second-order cladodes in IPA occurred
at lower values ofu (-0.655). The higher values ofu did
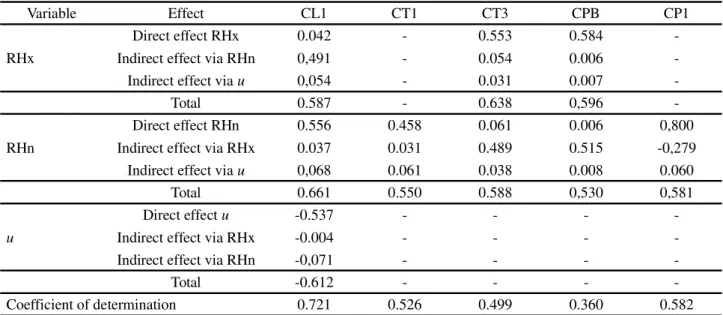
not favour increases in the width of the first-order (CW1) (0.806) or the second-order cladodes (CP2) in the MIU clone (-0.912), and in OEM did not benefit growth in the older cladodes (CLl) (-0.537). Rg only had an effect on
cladode characteristics in clones of the genus Nopalea,
where the highest intensity reduced the growth of the order cladodes in IPA, and decreased the growth of the first-and second-order cladodes in MIU. Over time, this variable
presented magnitudes of 17-25 (22) MJ m-2 day-1.
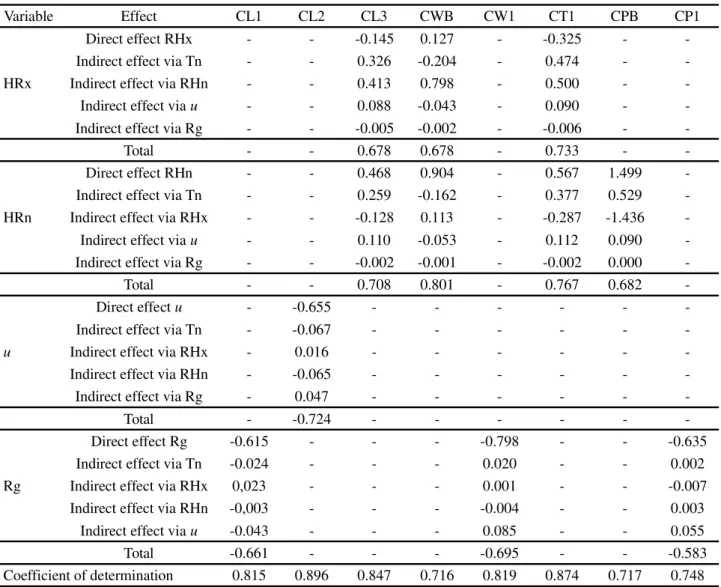
Table 4 - Breakdown of the Pearson correlation coefficient into direct and indirect effects between variables of the ‘Cladode’ response group (cladode structural characteristics), with variables of the ‘Environment’ explanatory group (environmental variables) in the IPA Sertânia clone - IPE, under irrigated conditions in a semi-arid environment in the district of Serra Talhada, PE, Brazil
Variable Effect CL1 CL2 CL3 CWB CW1 CT1 CPB CP1
HRx
Direct effect RHx - - -0.145 0.127 - -0.325 -
-Indirect effect via Tn - - 0.326 -0.204 - 0.474 -
-Indirect effect via RHn - - 0.413 0.798 - 0.500 -
-Indirect effect viau - - 0.088 -0.043 - 0.090 -
-Indirect effect via Rg - - -0.005 -0.002 - -0.006 -
-Total - - 0.678 0.678 - 0.733 -
-HRn
Direct effect RHn - - 0.468 0.904 - 0.567 1.499
-Indirect effect via Tn - - 0.259 -0.162 - 0.377 0.529
-Indirect effect via RHx - - -0.128 0.113 - -0.287 -1.436
-Indirect effect viau - - 0.110 -0.053 - 0.112 0.090
-Indirect effect via Rg - - -0.002 -0.001 - -0.002 0.000
-Total - - 0.708 0.801 - 0.767 0.682
-u
Direct effectu - -0.655 - - -
-Indirect effect via Tn - -0.067 - - -
-Indirect effect via RHx - 0.016 - - -
-Indirect effect via RHn - -0.065 - - -
-Indirect effect via Rg - 0.047 - - -
-Total - -0.724 - - -
-Rg
Direct effect Rg -0.615 - - - -0.798 - - -0.635
Indirect effect via Tn -0.024 - - - 0.020 - - 0.002
Indirect effect via RHx 0,023 - - - 0.001 - - -0.007
Indirect effect via RHn -0,003 - - - -0.004 - - 0.003
Indirect effect viau -0.043 - - - 0.085 - - 0.055
Total -0.661 - - - -0.695 - - -0.583
Coefficient of determination 0.815 0.896 0.847 0.716 0.819 0.874 0.717 0.748
Where: ‘Environment’ group: RHx - maximum relative humidity, RHn - minimum relative humidity, u - wind speed, Rg - global solar radiation; ‘Cladode’ group: CL1 - length of the first-order cladode, CL2 - length of the second-order cladode, CL3 - length of the third-order cladode, CWB - width of the basal cladode, CW1 - width of the first-order cladode, CT1 - thickness of the first-order cladode, CPB - perimeter of the basal cladode, CP1 - perimeter of the first-order cladode. “-” indicates that the environmental variable showed no correlation with any of the variables of the ‘cladode’ group
positive effect on CLB viau (0.515). There was also no
significant effect from Tn on OEM (Table 6).
Table 5 - Breakdown of the Pearson correlation coefficient into direct and indirect effects between the ‘Cladode’ response group (cladode structural characteristics), and the ‘Environment’ explanatory group (environmental variables) in the ‘Miúda’ clone - MIU, under irrigated conditions in a semi-arid environment in the district of Serra Talhada, PE, Brazil
Solar radiation provides the driving force for photosynthesis; however, in excess, it inhibits growth in
species ofOpuntia sp. (AZEVEDOet al., 2013; LÜTTGE,
2010; NOBEL; HARTSOCK, 1983). Silva et al. (2015),
in a study carried out with the IPA Sertânia, Miúda and
Variable Effect CLB CL1 CWB CW1 CTB CT4 CP1 CP2
Tn
Direct effect Tn -0.799 - -1.881 - - - -
-Indirect effect via RHx 0,193 - 0.973 - - - -
-Indirect effect via RHn -0,016 - -0.446 - - - -
-Indirect effect viau -0.066 - 0.639 - - - -
-Indirect effect via Rg 0,012 - -0.005 - - - -
-Total -0.677 - -0.720 - - - -
-RHx
Direct effect RHx - - - - -0.235 -0.169 -
-Indirect effect via Tn - - - - 0.393 0.411 -
-Indirect effect via RHn - - - - 0.589 0.326 -
-Indirect effect viau - - - - 0.066 0.097 -
-Indirect effect via Rg - - - - -0.006 -0.006 -
-Total - - - - 0.807 0.660 -
-RHn
Direct effect RHn - - 0.907 - 0.667 0.370 -
-Indirect effect via Tn - - 0.925 - 0.313 0.327 -
-Indirect effect via RHx - - -1.387 - -0.208 -0.149 -
-Indirect effect viau - - 0.126 - 0.083 0.121 -
-Indirect effect via Rg - - 0.001 - -0.002 -0.002 -
-Total - - 0.572 - 0.853 0.667 -
-u
Direct effectu 0.102 - - 0.806 - - - -0.912
Indirect effect via Tn 0.515 - - -0.173 - - - 0.185
Indirect effect via RHx 0,031 - - -0.024 - - - 0.070
Indirect effect via RHn -0,004 - - 0.009 - - - -0.053
Indirect effect via Rg 0,044 - - 0.047 - - - 0.066
Total 0.689 - - 0.664 - - - -0.644
Rg
Direct effect Rg - -0.611 - -0.504 - - -0.748 -0.710
Indirect effect via Tn - -0.006 - -0.007 - - -0.003 0.007
Indirect effect via RHx - 0,002 - 0.004 - - 0.003 -0.010
Indirect effect via RHn - 0,001 - 0.000 - - 0.001 0.002
Indirect effect viau - -0.037 - -0.075 - - -0.044 0.085
Total - -0.652 - -0.582 - - -0.791 -0.627
Coefficient of determination 0.778 0.477 0.923 0.722 0.929 0.825 0.889 0.947
Where: ‘Environment’ group: Tn – minimum air temperature, RHx - maximum relative humidity, RHn - minimum relative humidity, u - wind speed, Rg - global solar radiation; ‘Cladode’ group: CLB - length of the basal cladode, CL1 - length of the first-order cladode, CWB - width of the basal cladode, CW1 - width of the first-order cladode, CTB - thickness of the basal cladode, CT4– thickness of the fourth-order cladode, CP1 - perimeter of the first-order cladode, CP2 - perimeter of the second-order cladode. “-“ indicates that the environmental variable showed no correlation with any of the variables of the ‘cladode’ group
Table 6 - Breakdown of the Pearson correlation coefficient into direct and indirect effects between variables of the ‘Cladode’ response group (cladode structural characteristics), with variables of the ‘Environment’ explanatory group (environmental variables) in the ‘Orelha de Elefante Mexicana’ clone - OEM, under irrigated conditions in a semi-arid environment in the district of Serra Talhada, PE, Brazil
Variable Effect CL1 CT1 CT3 CPB CP1
RHx
Direct effect RHx 0.042 - 0.553 0.584
-Indirect effect via RHn 0,491 - 0.054 0.006
-Indirect effect viau 0,054 - 0.031 0.007
-Total 0.587 - 0.638 0,596
-RHn
Direct effect RHn 0.556 0.458 0.061 0.006 0,800
Indirect effect via RHx 0.037 0.031 0.489 0.515 -0,279
Indirect effect viau 0,068 0.061 0.038 0.008 0.060
Total 0.661 0.550 0.588 0,530 0,581
u
Direct effectu -0.537 - - -
-Indirect effect via RHx -0.004 - - -
-Indirect effect via RHn -0,071 - - -
-Total -0.612 - - -
-Coefficient of determination 0.721 0.526 0.499 0.360 0.582
In general, at times when the minimum temperature was higher, associated with higher maximum and minimum relative humidity and lower intensity wind speeds and global solar radiation, the environmental variables favoured growth in the plant and cladodes of the forage cactus, with an increase in their dimensions. Therefore, when planting this species, it is important to consider the period of the year when these conditions predominate, in order to promote the initial growth of the plants and ensure their establishment. In the Brazilian semi-arid region, such environmental conditions are typical of the transition between summer (December-March) and autumn (March-June), which coincides with the rainy season.
CONCLUSIONS
1. Growth was most favoured in the forage cactus when the minimum temperature and the maximum and minimum relative humidity were increasing, and the intensity of the wind speed and solar radiation were lower;
2. Growth in clones of the genus Nopalea was affected
by the association of environmental variables, unlike
the genus Opuntia, which occurred in isolation and
depended on morphological characteristics;
3. The variability of the water regime did not significantly explain the seasonality of the growth of the forage cactus, irrespective of clone or genus;
4. The genus Opuntia showed a lower sensitivity to
variations in air temperature when compared to the
genusNopalea;
5. Global solar radiation affected only the morphological characteristics of the cladodes;
6. The highest intensities of global solar radiation
affected the clones of the genus Nopalea (IPA
Sertânia and ‘Miúda’) more than of the genusOpuntia
(Mexican Elephant Ear).
ACKNOWLEDGEMENTS
The authors wish to thank FACEPE for their financial assistance (APQ-0215-5.01 / 10) and CAPES for granting the scholarship.
REFERENCES
AZEVEDO, C. F.et al. Morfoanatomia vegetativa deOpuntia brasiliensis (Willd) Haw. Ambiência, v. 9, n. 1, p. 73-82, 2013.
BAHUGUNA, R. N.; JAGADISH, K. S. V. Temperature regulation of plant phenological development.Environmental and Experimental Botany, v. 111, p. 83-90, 2015.
CRUZ, C. D.Programa Genes: biometria. 1. ed. Viçosa, MG: UFV, 2006. 382 p.
JIA, Y.et al. Effect of low water temperature at reproductive
stage on yield and glutamate metabolism of rice (Oryza sativa
L.) in China.Field Crops Research, v. 175, p. 16-25, 2015. KIM, D.et al. Sensitivity of stand transpiration to wind velocity
in a mixed broadleaved deciduous forest. Agricultural and Forest Meteorology, v. 187, n. 1, p. 62-71, 2014.
LLORENS, L.et al. The role of UV-B radiation in plant sexual
reproduction. Perspectives in Plant Ecology, Evolution and Systematics, v. 17, n. 3, p. 243-254, 2015.
LOUW, E. L. et al. Physiological and phenological responses of Protea ‘Pink Ice’ to elevated temperatures. South African Journal of Botany, v. 99, n. 1, p. 93-102, 2015.
LÜTTGE, U. Ability of crassulacean acid metabolism plants to overcome interacting stresses in tropical environments.AoB Plants, v. 2010, n. 1, p. 1-15, 2010.
MOTSA, M. M.et al. Effect of light and temperature on seed germination of selected African leafy vegetables.South African Journal of Botany, v. 99, n. 1, p. 29-35, 2015.
NEDER, D. G.et al. Correlations and path analysis of morphological
and yield traits of cactus pear accessions. Crop Breeding and Applied Biotechnology, v. 13, n. 1, p. 203-207, 2013.
NOBEL, P. S. Ecophysiology of Opuntia ficus-indica. In:
MONDRAGÓN-JACOBO, C.; PÉREZ-GONZÁLEZ, S. (Ed.).Cactus (Opuntia spp.) as forage. 1. ed. Rome: Food and Agriculture Organization of the United Nations, 2001. p. 13-20. NOBEL, P. S.; HARTSOCK, T. L. Relationships between photosynthetically active radiation, nocturnal acid accumulation, and CO2 uptake for a crassulacean acid metabolism plant,
Opuntia ficus-indica.Plant Physiology, v. 71, n. 1, p. 71-75, 1983.
PEÑA-VALDIVIA, C. B.et al. Morphological characterization of Opuntia spp.: a multivariate analysis. Journal of the Professional Association for Cactus Development, v. 10, n. 1, p. 1-21, 2008.
PINHEIRO, K. M. et al. Correlações do índice de área do
cladódio com características morfogênicas e produtivas da palma forrageira. Pesquisa Agropecuária Brasileira, v. 49,
n. 12, p. 939-947, 2014.
QUEIROZ, M. G. et al. Características morfofisiológicas
e produtividade da palma forrageira sob diferentes lâminas de irrigação. Revista Brasileira de Engenharia Agrícola e Ambiental, v. 19, n. 10, p. 931-938, 2015.
SCALISI, A.et al. Cladode growth dynamics inOpuntia ficus-indica under drought. Environmental and Experimental Botany, v. 122, n. 1, p. 158-167, 2016.
SENTELHAS, P. C.; MONTEIRO, J. E. B. A. Agrometeorologia dos cultivos: informações para uma agricultura sustentável.In:
MONTEIRO, J. E. B. A. (Org.).Agrometeorologia dos cultivos:
o fator meteorológico na produção agrícola. 1. ed. Brasília: INMET, 2009. p. 4-12.
SILVA, N. G. M. et al. Relação entre características morfológicas e produtivas de clones de palma-forrageira.
Revista Brasileira de Zootecnia, v. 39, n. 11, p. 2389-2397, 2010.
SILVA, T. G. F.et al. Área do cladódio de clones de palma
forrageira: modelagem, análise e aplicabilidade. Revista Brasileira de Ciências Agrárias, v. 9, n. 4, p. 633-641, 2014.
SILVA, T. G. F. et al. Crescimento e produtividade de clones
de palma forrageira no semiárido e relações com variáveis meteorológicas.Revista Caatinga, v. 28, p. 10-18, 2015.
TOEBE, M.; CARGNELUTTI FILHO, A. Não normalidade multivariada e multicolinearidade na análise de trilha em milho.
Pesquisa Agropecuária Brasileira, v. 48, n. 5, p. 466-477, 2013.